|
|

Table Of Contents
Understanding the Topology User Interface
Roles Required for Managing Maps
Understanding Static and Dynamic Links
Adding a Network Element to an Existing Map
Finding the Network Elements in a Map
Deleting a Network Element from a Map
Deleting a Static Link from a Map
Managing the Network Elements in a Map
Aggregating the Network Elements in a Map
Disaggregating the Network Elements in a Map
Understanding Overview and Outline Views
Viewing Network Element Properties
Viewing Topology Link Properties
Working with Topology Maps
The ANA Monitoring Perspective provides views that allow you to perform operations on a group of network elements. The topology map displays the status of the network elements and the connectivity between them. The topology map is used as a general dashboard to view the network elements, their status, the relationships between them, and the alarms that are raised on them.
You can create multiple topology maps to represent specific network views. Views can cover specific network segments, customer networks, or any other mix of network elements desired. Once the maps have been created, they are available for all connecting ANA clients.
The ANA Topology module allows you to:
•
View network inventory and multilayer connectivity.
•
•
•
•
ANA provides functionality for displaying and managing the topology maps by providing:
•
•
•
•
The tasks that you can perform using Topology are described in these sections:
•
•
•
•
•
•
•
•
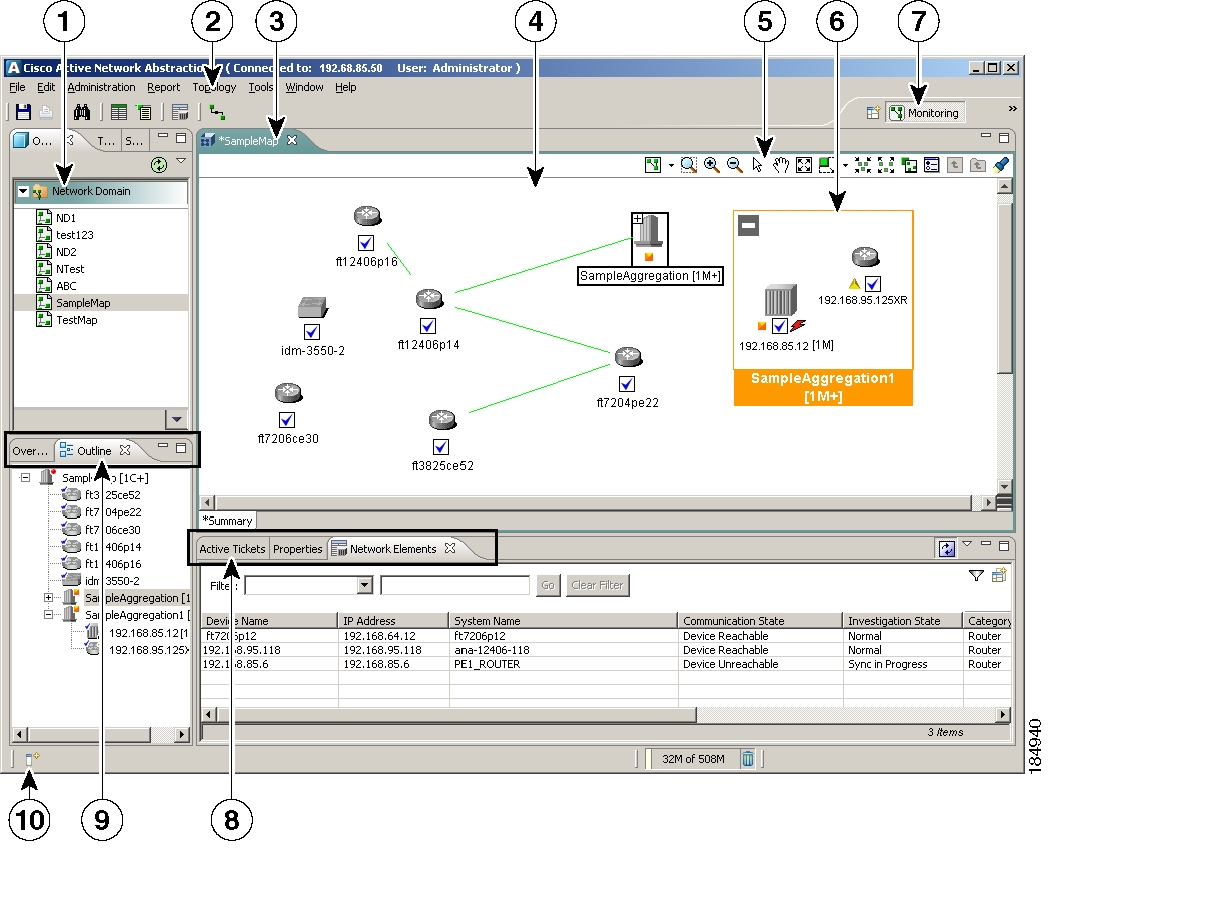
Understanding the Topology User Interface
Figure 5-1 Topology User Interface
Roles Required for Managing Maps
Table 5-1 lists the roles that are required for managing maps. For more information on roles, see Creating and Managing Users and Scopes, page 14-27.
Understanding Static and Dynamic Links
The ANA Topology module enables you to manage the links between network elements and to add a new static link between them.
A dynamic link is a link that is detected by ANA and connected automatically. A static link is a link that you can manually create.
When adding a new link the state of the link reflects its current state. For example, if the operation status of a port is down, the link is colored red.
For information on creating static and dynamic links, see:
Managing Maps
These topics describe how to manage maps:
•
•
•
•
Creating a Map
You must create a new map, or open a map that was previously saved, to display the network. The ANA Topology module supports the creation of multiple topology maps to represent specific network views. The topology maps provide a graphic display of Alarm severity, network element state, and VNE state. See Network Element Decorators, page F-4 to understand the network element icons that are displayed in the map.
You can create a new map, and then add the network elements to the map. You cannot define the same name for two or more maps.
To create a map:
Step 1
Step 2
Step 3
You can use alphanumeric values. The minimum map name length is 1 character and the maximum is 65 characters. The only special characters you can enter are an underscore (_) and dollar symbol ($).
Step 4
You can add a maximum of 999 network elements to a map.
The list of network elements that you have selected is displayed in the Summary workspace.
Step 5
Creating Static Links
When dynamic links are not visible in your topology map, you can create static links. You can create a static link between network elements by selecting the two end ports of the network elements. You can create a static link between two managed network elements. To create a static topological link, you have to select the exact location of the two end ports (at both ends of the link).
The new link is validated after the two ports are selected but before the link is added. The ANA Topology module validates the following:
•
•
•
•
•
To create a new static link:
Step 1
Step 2
Step 3
Step 4
Step 5
See Viewing Network Element Properties and Viewing Topology Link Properties for details on the element and link properties.
Opening a Topology Map
You can open a map that was previously saved. When you open the map, the network information is automatically refreshed. For example, if a network element was up the last time that the map was saved and closed, and then the network element is moved to maintenance state, the next time you open the map, the management status of the network element is updated accordingly and the network element is displayed in the maintenance state.
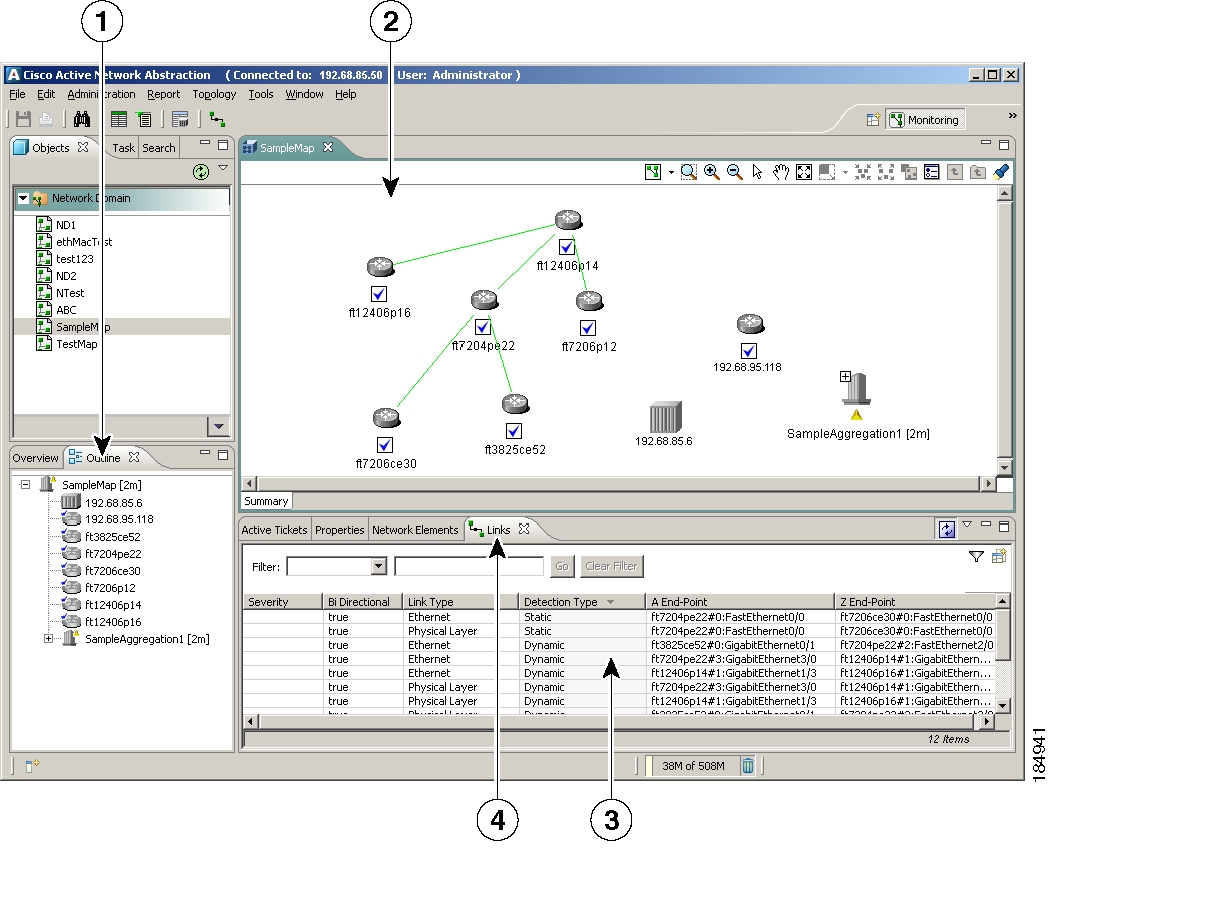
Figure 5-2 Static and Dynamic Links
Outline view. See Understanding Overview and Outline Views for more information on Outline view
Map workspace.
Aggregate node shown as an icon.
View table.
Link view.
To open a topology map:
Step 1
The list of maps that are accessible to you is displayed in the Network Domain drawer.
Step 2
If you have added a business tag to a network element, the business tag name is displayed instead of the network element name in the topology map. See Defining Business Tags, page 6-1 to create business tags.
The following color codes are used to display the map links:
•
•
•
If there are multiple links (for example, physical and Ethernet links) between network elements, these links are represented in a single line. The A and Z ends of the links are displayed in the topology maps. The details of these links are available in the Link view. See Viewing Topology Link Properties from the Link View for details on links.
After discovering the network, if the interfaces are disconnected, the physical link is still visible between these interfaces. However, the alarm for Link Down connection is logged.
The topology map shows a different icon (a lock) for the network elements that are not within the scope of the user. See Creating and Managing Users and Scopes, page 14-27 for information on user access control.
To understand network elements representation, see Icon Reference, page F-3.
Adding a Network Element to an Existing Map
To add a network element:
Step 1
Step 2
Step 3
Step 4
You can add a maximum of 999 network elements to a map.
The list of network elements that you have selected is displayed in the Summary workspace.
Step 5
Finding the Network Elements in a Map
You can find the network elements based on the name or IP address that you entered in the ANA database.
To find a network element in a map:
Step 1
Step 2
Step 3
You can enter either a complete or a partial NE name or IP address.
Step 4
The network element name that you have entered is highlighted in the map workspace. If your search criteria match more than one NE, you have to click OK multiple times to see all the NEs.
If the NE is inside an aggregate, the aggregate is expanded and the NE is highlighted.
Renaming a Map
A map name change affects all users of the map. The new name is displayed in the Network Domain drawer.
To rename a map:
Step 1
Step 2
Step 3
Step 4
The new name is displayed in the Network Domain drawer.
Saving a Map
You can save map layouts and change existing map layouts.
The following changes to the workspace are only saved when the Save option is selected:
•
•
•
•
•
•
•
•
The maps can then be opened later as required.
To save changes to a map, do one of the following:
•
•
Deleting a Network Element from a Map
To delete a network element:
Step 1
Step 2
Step 3
Step 4
The list of deleted network elements that you have selected is displayed in the Summary workspace.
Step 5
Deleting a Static Link from a Map
To delete a static link:
Step 1
The list of maps that are accessible to you is displayed in the Network Domain drawer.
Step 2
Step 3
Step 4
The link properties are displayed in the Link view.
Step 5
Step 6
The static link is deleted from the map workspace and also from the Link view.
Deleting a Map
To delete a map:
Step 1
Step 2
Step 3
The map is deleted from the Network Domain drawer.
Managing the Network Elements in a Map
These topics describe how to manage the network elements within a map:
•
•
•
•
•
Aggregating the Network Elements in a Map
To aggregate the network elements in a map:
Step 1
Step 2
Step 3
Step 4
Step 5
The aggregated node is displayed in the map workspace. Aggregated nodes are displayed as a single entity with the Aggregation icon. The aggregation node is appended with the alarm severity.
For example, the aggregation name SampleAggregation, appended with the alarm severity, might result in the name SampleAggregation [5M+]. This indicates that the aggregation has five major severity alarms. The plus sign indicates that there are more alarms in this aggregation.
See Network Element Decorators, page F-4 for information on alarm severity icons.
Renaming an Aggregation Node
To rename an aggregation node:
Step 1
Step 2
Step 3
Step 4
Step 5
The renamed aggregated node is displayed in the map workspace.
Disaggregating the Network Elements in a Map
To disaggregate an aggregation node:
Step 1
Step 2
Step 3
Step 4
Step 5
Selecting a Map Layout
You can select different map layouts and different map views of the network elements using the selection tools in the map workspace.
Table 5-2 Topology Map Tool Buttons
Layout
Defines the way in which the map is displayed in the map workspace; for example, Circular, Tree, Hierarchical, or Symmetric.
Zoom Selection
Activates the zoom selection mode, which enables you to select an area in the map workspace to be enlarged by clicking and dragging to view the selected area.
Zoom In
Zooms in on the topology map.
Zoom Out
Zooms out of the topology map.
Normal Selection
Activates the normal selection mode.
Pan
Activates the Pan mode, which enables you to move around in the map workspace by clicking and dragging.
To deselect the Pan icon, click the Normal Selection icon.
Fit In Window
Fits the entire subnetwork or map in the map workspace.
Resize
Enables you to resize the NE in the map workspace. By default, the NE size is medium.
•
•
•
New Aggregation
Enables you to aggregate network elements.
See Aggregating the Network Elements in a Map for more details.
Disaggregate
Enables you to disaggregate an aggregate node.
See Disaggregating the Network Elements in a Map for more details.
Show Aggregation as Thumbnail
Enables you to look into an aggregation node in the map, including all of the aggregated elements. Thumbnails can also be nested.
This is activated only if you select an aggregation node.
Topology Map Filter
Enables you to filter the links.
Go to Parent
Enables you to navigate to the parent of the network element.
Go to Root
Enables you to navigate to the root of the network element.
Find in Topology Map
Enables you to find the network elements in a topology map.
See Finding the Network Elements in a Map for more details.
Filtering Topology Links
The links filter enables you to filter the links displayed in the map workspace.
To filter the topology links:
Step 1
Step 2
Step 3
Step 4
•
•
•
•
Step 5
The appropriate links are displayed in the map workspace. See Viewing Topology Link Properties for more information on link properties.
Understanding Overview and Outline Views
When you open a topology map, the Overview and the Outline views are displayed automatically. See Topology User Interface.
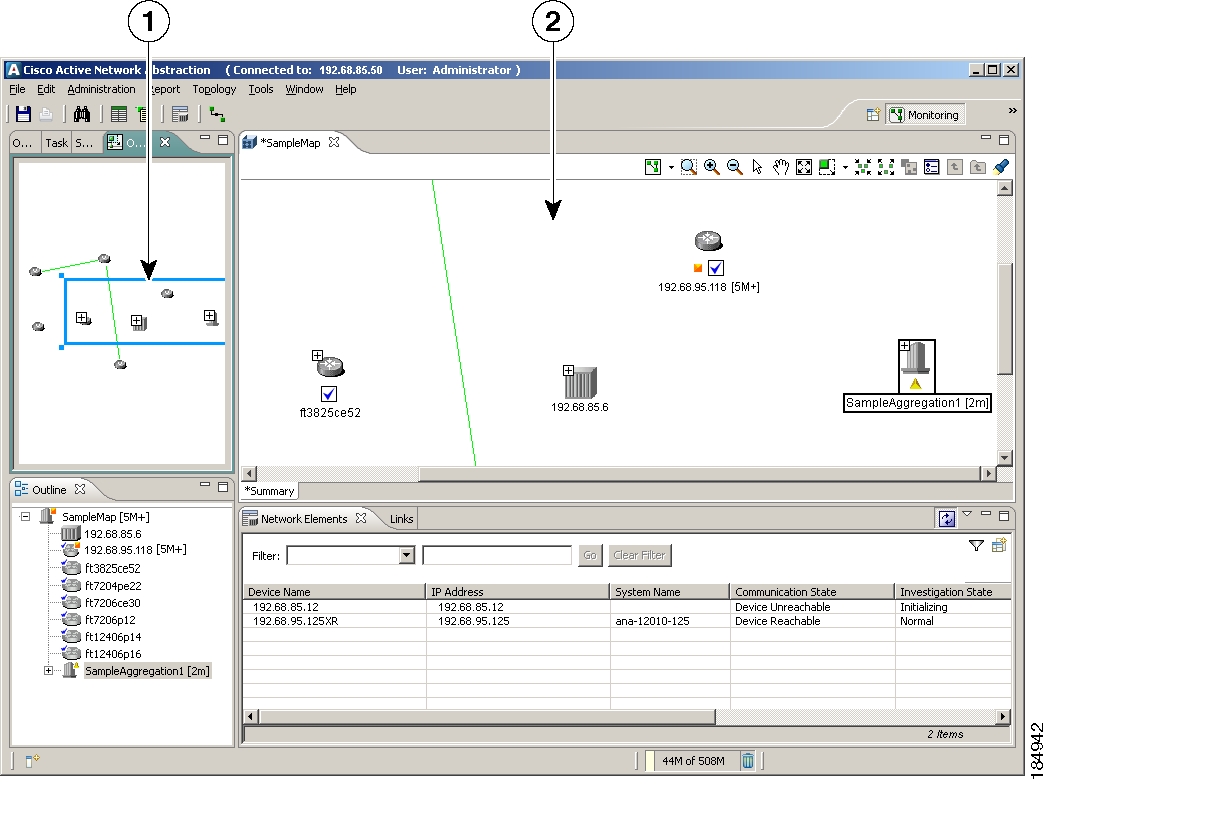
Figure 5-3 Topology Outline View
Overview view. Select the blue outline to zoom in on the map.
Map workspace. The selected area in the Outline view is zoomed in in the workspace.
The Overview view shows a scaled down version of the map that is displayed in the map workspace. The selected area in the Overview view is zoomed in on the map workspace. This feature is useful in navigating large maps.
The Outline view shows all the network elements that are part of the selected map. From this view, you can:
•
For example, the network element name 192.168.10.10, appended with the alarm severity, might result in the name 192.168.10.10 [2M+]. This indicates that the network element has two major severity alarms. The plus sign indicates that there are more alarms associated with this network element.
See Network Element Decorators, page F-4 for information on alarm severity icons.
•
•
Viewing Network Element Properties
The Network Elements view displays network element properties in the selected map. You can launch the following applications from this view:
•
•
•
•
•
•
To view the network element properties in a map:
Step 1
The list of maps that are accessible to you is displayed in the Network Domain drawer.
Step 2
Step 3
All the network elements that are available in the map are displayed in the Network Element view:
Viewing Topology Link Properties
You can view the topology link properties in two ways:
•
•
Viewing Topology Link Properties from the Map Workspace
To view the topology link properties:
Step 1
Step 2
The Properties context menu is enabled only if there is a single link between NEs. If there are multiple links between NEs (for example, physical and Ethernet links) the Properties context menu is not enabled. The A and Z ends of the links are displayed in the topology maps. These links details are also available in the Link view. See Viewing Topology Link Properties from the Link View for details on links.
The Link properties are displayed in the workspace:
Viewing Topology Link Properties from the Link View
To view the topology link properties:
Step 1
The list of maps that are accessible to you is displayed in the Network Domain drawer.
Step 2
Step 3
All the links that are available in the map are displayed in the Link view:
Severity
Displays a severity icon, which is colored according to the severity of the alarm on the link. This indicates the impact of the alarm on the network.
•
•
•
•
•
•
•
See Tracking Faults, page 12-1 for more details on alarms.
A End-Point
Displays the source of the topology link between network elements.
Z End-Point
Displays the destination of the topology link between network elements.
Link Type
Displays the link type: Physical layer, Ethernet, PPP, MPLS, or IP.
Detection Type
Displays whether the link is dynamic link or static link.
BiDirectional
Displays whether the link is a bidirectional link. The values can be either True or False.
Finding a Ticket Source
You can find the source of a ticket displayed in the ticket view. See Tracking Faults, page 12-1 for more details on alarms.
Step 1
Step 2
Step 3
Step 4
Step 5
Finding a Link Source
To find a link source:
Step 1
Step 2
Step 3
Step 4
Step 5
![]()
![]()
![]()
![]()
![]()
![]()
![]()
![]()
Posted: Mon Sep 24 07:37:32 PDT 2007
All contents are Copyright © 1992--2007 Cisco Systems, Inc. All rights reserved.
Important Notices and Privacy Statement.