|
|

Table Of Contents
Sequence Association and Root Cause Analysis
Understanding the Troubleshooting Perspective
Viewing Provisioning Information
Ticket Status in the Ticket Workspace
Adjusting Polling Rates and Defining Threshold Crossing Alarms
Tracking Faults
This chapter introduces some of the key concepts of ANA alarm management and describes fault tracking elements and procedures, including the following topics:
•
Understanding Faults—Describes the basic concepts and terms used throughout this section.
•
•
Understanding Faults
The challenge of dealing effectively with events and alarms is to know how to understand and efficiently process and organize bulks of raw events that might be generated as a result of single root cause events.
Figure 12-1 Event Flood
Meeting the event management challenge is done by correlating related events into a sequence that represents the alarm lifecycle, and using the network dependency model to determine the causal interrelationship between alarms.
ANA can be used for analyzing and managing faults through fault detection, isolation, and correlation. Once a fault is identified, the system uses the autodiscovered virtual network model to perform fault inspection and correlation to determine the root cause of the fault and, if applicable, to perform service impact analysis.
Alarms
An alarm represents a scenario which involves a fault occurring in the network or management system. Alarms represent the complete fault lifecycle, from the time that the alarm is opened (when the fault is first detected) until it is closed and acknowledged.
Examples of alarms include:
•
•
•
An alarm is composed of a sequence of events, each representing a specific point in the alarm lifecycle.
Events
An event is an indication of a distinct occurrence that happened at a specific point in time. Events are derived from incoming traps and notifications, and from detected status changes.
Examples of events include:
•
•
•
•
•
Events are written to the ANA database once and never change.
Event Sequences
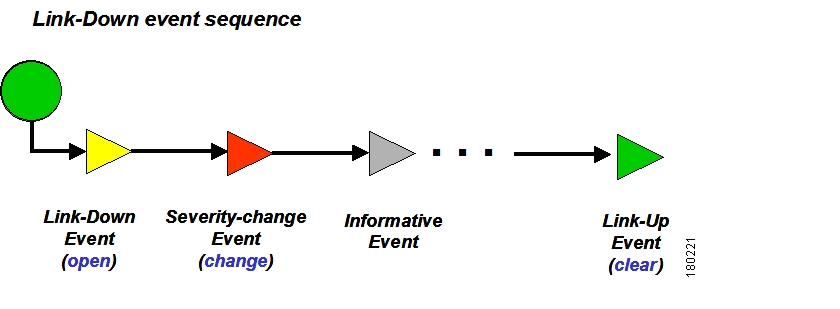
An event sequence is the set of related events which comprises a single alarm; for example, Link Down > ack > link-up.
Figure 12-2 Link Down Event Sequence Example
Typically, a complete event sequence includes three mandatory events:
•
•
•
Optionally, there can be any number of alarm change events which can be triggered by new severity events, affected services update events, and so on.
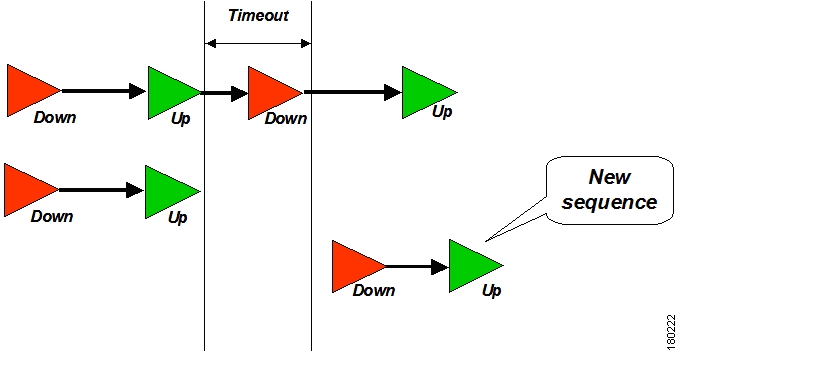
Repeating Event Sequences
If a new opening event arrives within a configurable timeout after the clearing event of the same alarm, the alarm is updatable, and a repeating event sequence is created; that is, the event attached to the existing sequence the severity is updated accordingly. If the new opening event occurs after the timeout, a new alarm (new event sequence) is opened.
Figure 12-3 Repeating Event Sequence
Flapping
If a series of events are considered to be similar (for example, each occurs in the network in a certain user-defined time window for a certain user-defined number of times), the VNE might (upon configuration) reduce further the number of events and issue a single event of the type event flapping. Only when the alarm stabilizes and the event frequency is reduced, is another update to the event sequence issued as event stopped flapping. Another update is issued with the most up-to-date event state.
Figure 12-4 Flapping Event
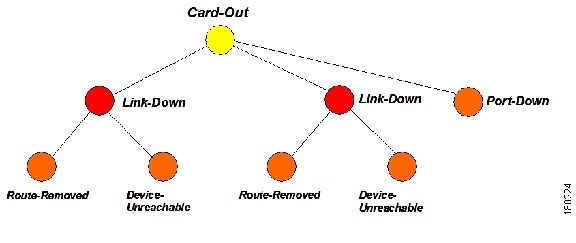
Correlation by Root Cause
Root cause correlation is determined between alarms or event sequences. It represents a causal relationship between an alarm and the consequent alarms that occurred because of it.
For example, a card-out alarm can be the root cause of several linkdown alarms, which in turn can be the root cause of multiple route-lost and NE unreachable alarms, and so on. A consequent alarm can serve as the root cause of other consequent alarms.
Figure 12-5 Root Cause Correlation Hierarchy Example
Tickets
A ticket represents the complete alarm correlation tree of a specific fault scenario. It can also be identified by the topmost or "root of all roots" alarm. The Troubleshooting perspective displays tickets and allows drilling down to view the consequent alarm hierarchy.
For the operator, the managed entity is always a complete ticket. Operations such as Acknowledge, Force Clear, or Clear and Mark for Deletion are always applied to the whole ticket. The ticket also assumes an overall, propagated severity.
How Are Faults Generated?
The following basic sources of alarms, which indicate a problem in the network, exist in the system:
•
•
•
•
The alarm conditions could be:
–
–
–
•
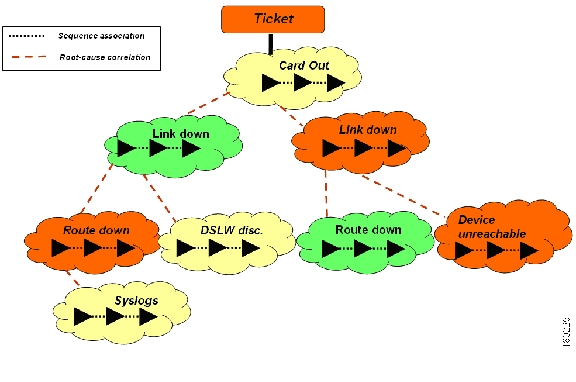
Sequence Association and Root Cause Analysis
There are two different types of relationships in ANA alarm management:
•
•
The following figure shows how both types of relationship are implemented in the ticket hierarchy:
Figure 12-6 Sequence Association vs. Root Cause Correlation
In the previous figure, the alarms are correlated into a hierarchy according to a root cause. Within each alarm is its respective event sequence representing the lifecycle of the alarm.
Understanding the Troubleshooting Perspective
The Troubleshooting perspective allows you to monitor the health of the network and ANA. A set of views relevant to various health monitoring tasks and activities is displayed in this view. From the Troubleshooting perspective you can view further detail about, and the management history of, a particular fault (details of tickets, alarms, and events). Though you can view details of open events or tickets from the other perspectives, the Troubleshooting perspective maintains an archive and keeps complete details of resolved tickets as well.
This perspective is also the access point for any troubleshooting application that you have installed on your network to diagnose faults. The main display for this perspective in ANA is the fault browser. Supporting views display the details of the chosen faults on browser tabs.
This section includes the following Troubleshooting perspective topics:
•
•
•
Navigating the User Interface
The Troubleshooting perspective provides the views showing faults arising from network elements and the ANA system itself. The anchor views and common supporting views expose the details and the operations possible on individual faults. Any changes to the faults as reported by the server are shown in the anchor view. Faults are categorized and shown under different sections for quick location. The functional areas of the Troubleshooting perspective are shown in Figure 12-7.
Figure 12-7 Troubleshooting Perspective
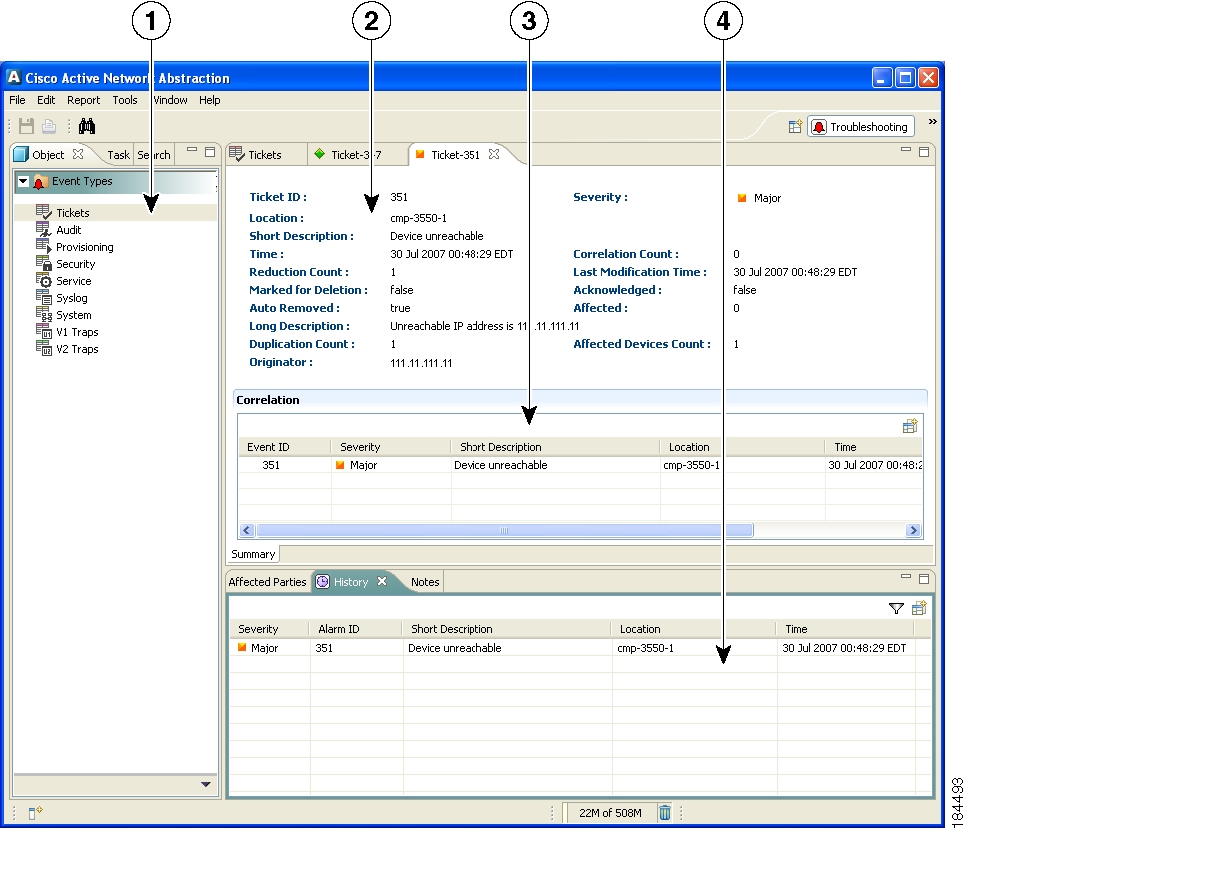
Viewing Ticket Properties
To view ticket property information:
Step 1
The Ticket table appears in the workspace on the right.
Step 2
Ticket and correlation details are displayed in a separate tab titled by ticket event ID number.
The following fields are described below:
•
Ticket Tab
•
•
•
•
•
•
•
•
•
•
•
•
Ticket Details
The Ticket Properties tab includes the following fields:
•
•
•
•
•
•
•
•
•
•
•
•
•
•
Correlation Workspace
The correlation workspace of the Ticket tab includes the following fields:
•
•
•
•
•
•
Views
Views include the following tabs:
•
•
•
Viewing Audit Information
The Audit tab displays all the events generated for each command or request in ANA. Audit details are displayed in a separate tab titled by audit event ID number.
To view audit information:
Step 1
The Audit table appears in the workspace on the right.
Step 2
The Audit workspace contains the following fields, in column format:
•
•
•
•
•
•
•
Viewing Provisioning Information
Click Provisioning from the Navigation workspace to display events triggered during the configuration of an NE. ANA sends an event explaining the configuration operation.
To view provisioning information:
Step 1
The Provisioning table appears in the workspace on the right.
Step 2
Provisioning details are displayed in a separate tab titled by provisioning event ID number.
The Provisioning workspace contains the following fields, in column format:
•
•
•
•
•
•
•
Viewing Security Information
The Security tab displays detailed information related to client login and user activity when managing the system and the environment. Security details are displayed in a separate tab titled by security event ID number.
To view security information:
Step 1
The Security table appears in the workspace on the right.
Step 2
The Security tab displays all the events generated for each Security command or request in ANA. Security details are displayed in a separate tab titled by security event ID number.
The Security workspace contains the following fields, in column format:
•
•
•
•
•
•
•
Viewing Service Information
Service events are related to the alarms that are generated by the ANA system. Service details are displayed in a separate tab titled by service event ID number.
To view service information:
Step 1
The Service table appears in the workspace on the right.
Step 2
The following additional information is displayed in the Service tab:
•
•
•
•
•
Viewing Syslog Information
The Syslog tab displays all the syslog events related to the predefined set of syslogs received from the NEs by the VNEs, which are used to generate the syslog events. Individual Syslog details are displayed in a separate tab titled by security event ID number.
To view syslog information:
Step 1
The Syslog table appears in the workspace on the right.
Step 2
Syslog details are displayed in a separate tab titled by syslog event ID number.
The Syslog workspace contains the following fields, in column format:
•
•
•
•
•
Viewing System Information
The System tab displays all the system events related to the everyday working of the internal system and its components. These events might be related to ANA resources, representing the system log.
To view system information:
Step 1
The System table appears in the workspace on the right.
Step 2
System details are displayed in a separate tab titled by system event ID number.
The System workspace contains the following fields, in column format:
•
•
•
•
•
Viewing V1 Trap Information
A V1 Trap event is triggered when the network element sends a trap message to ANA because of a network event, for example, Link Down. The V1 Trap tab displays the details of any V1 trap information received from the NE.
To view V1 Trap information:
Step 1
The V1 Trap table appears in the workspace on the right.
Step 2
V1 Trap details are displayed in a separate tab titled by V1 Trap event ID number.
The V1 Trap workspace contains the following fields, in column format:
•
•
•
•
•
Viewing V2 Trap Information
A V2 Trap event is triggered when the network element sends a trap message to ANA because of a network event, for example, Link Down. The V2 Trap tab displays the details of any V2 trap information received from the NE.
To view V2 Trap information:
Step 1
The V2 Trap table appears in the workspace on the right.
Step 2
V2 Trap details are displayed in a separate tab titled by V2 Trap event ID number.
The V2 Trap workspace contains the following fields, in column format:
•
•
•
•
•
Customizing Fault Tracking
The following sections provide details and procedures for managing events:
•
•
Acknowledging a Ticket
When an alarm occurs, a warning or ticket is displayed in the ticket workspace. From the Troubleshooting Perspective, you can handle the status of a ticket by acknowledging it. This acknowledges the fault.
The change is reported to the ANA gateway and all open ANA network resource management components. Several tickets can be acknowledged at the same time.
Note
An acknowledged ticket changes back to unacknowledged when a new event is correlated to it. You cannot undo this operation.
To acknowledge a ticket:
Step 1
Step 2
or
Click Acknowledge in the Ticket Properties dialog box.
The ticket is handled as described previously.
Clearing a Ticket
When an alarm occurs, a warning or ticket is displayed in the ticket workspace. From the Troubleshooting Perspective, you can verify the report of what is faulty and clear the faulty network element. The change is reported to the ANA gateway and all open ANA network resource management components. This operation cannot be reversed.
Clearing an open ticket does the following:
•
•
Note
To clear a ticket:
Step 1
Step 2
Clear
or
Clear and Mark for Deletion
The ticket is handled as described previously.
Ticket Status in the Ticket Workspace
The appearance of a ticket displayed in the ticket workspace depends on the status or severity of the alarm and what effect manipulating the ticket has on the way in which the ticket is displayed in the ticket workspace.
Tickets detailed in the ticket workspace change as a result of any the following:
•
•
•
•
•
•
•
Generated Ticket
Table 12-1 shows the typical information that appears in the Ticket workspace when a ticket is generated.
Table 12-1 Generated Ticket
Major
27
Port down
False (unacknowledged)
Cleared Ticket
Table 12-2 shows the typical information that appears in the Ticket workspace when a ticket is cleared.
Table 12-2 Cleared Ticket
Cleared
27
Cleared due to Force Clear
True (Acknowledged)
A ticket that has been cleared can then be removed from the ticket workspace. For more information, see Clearing a Ticket.
When a ticket is cleared, its definition automatically changes to acknowledged in the ticket workspace, and its definition in the Acknowledged column is True.
Acknowledged Ticket
Table 12-3 shows the typical information that appears in the Ticket workspace when a ticket is Acknowledged. When a ticket is acknowledged, it can then be cleared, and the severity changes to Cleared.
Table 12-3 Acknowledged Ticket
Major
27
Port up
True
When a ticket with an information severity is acknowledged, the ticket is automatically removed from the ANA gateway and from the ticket workspace.
Generated Up Ticket
The cause of the alarm is fixed; therefore an Up Ticket is automatically generated with a Cleared severity. Table 12-4 shows the typical information that appears in the Ticket workspace when an Up Ticket is Generated.
Table 12-4 Generated Up Ticket
Cleared
27
Port up
True
Adjusting Polling Rates and Defining Threshold Crossing Alarms
While the Troubleshooting perspective provides the user interface (UI) for fault management, there are several key functions that you need to customize elsewhere in ANA. For information on customizing polling rates that determine how often units poll the network elements to discover and display accurate and up-to-date information about the network, see Managing Polling Groups, page 14-4.
The use of alarm thresholds is one of the major areas in which ANA can boost its northbound clients. With this mechanism, ANA constantly monitors chosen properties and generates an alarm every time those properties cross a user-defined threshold or violate a condition. For information on managing soft properties and defining Threshold Crossing Alarms (TCAs), see Customizing Network Element Information Using Soft Property Builder, page A-1.
![]()
![]()
![]()
![]()
![]()
![]()
![]()
![]()
Posted: Mon Sep 24 07:21:29 PDT 2007
All contents are Copyright © 1992--2007 Cisco Systems, Inc. All rights reserved.
Important Notices and Privacy Statement.