|
|

This chapter describes the following tasks for operating ISM:
Starting the ISM program consists of two tasks:
For more information about defining the ISM autotasks in NetView, see the section, "Updating NetView" in the "Installing ISM" chapter of the CiscoWorks Blue Internetwork Status Monitor Installation Guide.
autotask opid=ismmgr
autotask opid=ismmgra
autotask opid=ismmgrb
The ismmgra and ismmgrb autotasks are optional, depending upon the number of routers that are going to be managed at your site. For more information about setting up the autotasks to manage your routers, see the section "Assigning ISM Autotasks to Monitor Routers" in the chapter "Setting Up the ISM Environment."
If you have previously used the NSP Release 2.0 interface, then you can run the NSP user interface after ISM is initialized until you become more familiar with the ISM user interface. New users should run the ISM user interface.
For more information about migrating your NSP Release 2.0 data, see the CiscoWorks Blue Internetwork Status Monitor Installation Guide.
To run NSP Release 2.0, perform the following tasks:
Step 1 Log in to NetView.
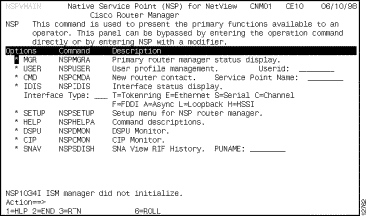
Step 2 At the command line on the NetView main menu panel, type nsp and press Enter. The Native Service Point (NSP) for NetView main menu panel is displayed (Figure 2-1).
To run ISM Release 3.0, perform the following tasks:
Step 1 Log in to NetView.
Step 2 At the command line on the NetView main menu panel, type ism and press Enter. The ISM main menu panel is displayed (Figure 2-2) showing the date and time that ISM was last initialized and identifying the autotask that is running.
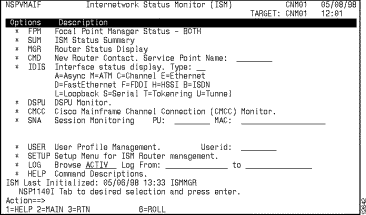
The ISM main menu panel is the panel that opens when you start the ISM program interface (Figure 2-2). In most cases you can access the ISM main menu panel from any other ISM panel by pressing F2.
From the ISM main menu panel, you can access each of ISM's primary applications. Each of the options on the left side of the panel provides access to one of ISM's applications or features.
If the application is enabled in ISM Router Management Setup, an asterisk appears beside the option, and the option is shown in white. For more information on setting up ISM's applications, see the "Setting Up the ISM Environment" chapter. If the application is disabled, the asterisk is removed and the option is shown in turquoise.
Each of the applications has a corresponding command that you can use to go directly to the application's panel from anywhere within ISM. For more information, see the "Using the ISM Command-Line Interface" section.
In addition to the ISM main menu panel, ISM provides secondary menu interfaces for monitoring routers, downstream physical units (DSPUs), and Cisco Mainframe Channel Connections on the following panels:
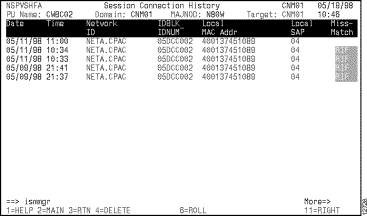
The following example shows how you can access the Router Status panel using the ismmgr command from a Session Connection History panel (Figure 2-3):
Step 1 At the command prompt, type ismmgr.
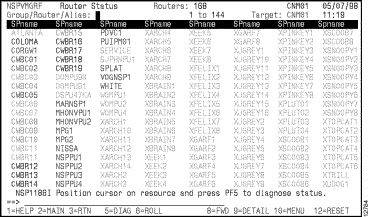
Step 2 Press Enter to display the Router Status panel (Figure 2-4).
 Tips
Tips
You can execute NetView commands directly from the ISM command line by typing the command and pressing Enter. ISM automatically switches to the NetView console and runs the command that you entered. Press F6 to return to ISM.
The standard function keys in ISM are described in Table 2-1. There are exceptions to the implementation of the standard function keys on some of the ISM panels to provide adequate operation of those panels. However, most panels use the functions keys according to the standard descriptions.
To help you locate options on any panel within the ISM interface, all data-entry field options are indicated in green with an underline. Informational and descriptive fields are normally in white and turquoise.
Use the following guidelines when making updates to options on the ISM panels:
The event log allows you to view the contents of the active or inactive log and to specify a date and time range for which you want to view events. The default view shows events that have occurred in the current hour for all routers currently being managed by ISM. Once you have opened the log, you can change the date and time range that you want to review from within the log.
There are several options that you can specify from the ISM main menu panel to view the ISM event log:
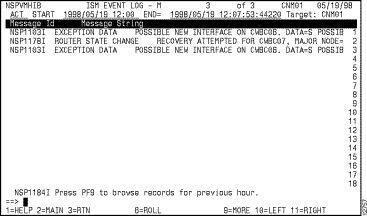
To view additional information from within the ISM log, you can perform the following operations:
There are several panels in ISM that provide the primary functions for managing your router resources. The following sections describe how you can use these panels to monitor your network resources:
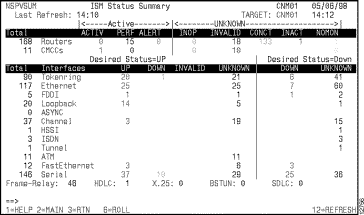
Use the ISM Status Summary panel (Figure 2-6) to monitor the overall status of the resources being managed by ISM. The ISM Status Summary panel provides a color-coded status by resource type and summarizes the number of resources that are in the corresponding condition. You can access the ISM Status Summary panel from the ISM main panel by positioning the cursor on * SUM and pressing Enter.
 Timesaver To go directly to the ISM Status Summary panel, type the ismsum command at any ISM command prompt and press Enter.
From the ISM Status Summary panel, you can tab to the resource type and status condition that you are interested in and press Enter.
You can access all of ISM's resource-specific status panels from the ISM Status Summary. For example, if you position the cursor in the Total field for routers and press Enter, ISM displays the ISM Router Status panel for all of the routers that ISM is managing. If you position the cursor in a router field where there is a performance (PERF) or alert condition and press Enter, ISM displays the ISM Router Status panel showing only the routers that are in the condition that you selected.
For details about using the panel to monitor a specific resource type, see the following chapters in this guide:
Use the Router Status panel (Figure 2-7) to monitor the status of all of the routers (by service point name) that are being managed by ISM. You can access the Router Status panel from the ISM main menu panel by positioning the cursor on * MGR and pressing Enter, or from the ISM Status Summary panel.
 Timesaver To go directly to the Router Status panel, type the ismmgr command at any ISM command prompt and press Enter.

The Router Status panel provides the following functions:
For details about monitoring routers, see the "Monitoring Routers" chapter in this guide.
Use the Router Status with Options panel (Figure 2-8) to view and execute the ISM router operations for a specific router. The Router Status with Options panel also provides a color-coded status for the selected router and other management information, such as what hardware and Cisco IOS software release are being used. You can access the Router Status with Options panel by selecting a router on the Router Status panel and pressing either Enter or F10.
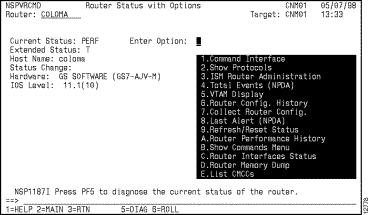
As on the Router Status panel (Figure 2-4), you can also diagnose a router condition by pressing F5 from the Router Status with Options panel. ISM automatically displays the appropriate diagnostic panel for the router condition, such as NetView's NPDA for troubleshooting hardware problems.
To execute one of the router menu operations, type the option number or letter in the Enter Option field and press Enter. Or, you can press the Tab key until it is positioned on the option that you want to select and press Enter.
 Tips
Tips
You can execute NetView commands directly from the ISM command line by typing the command and pressing Enter. ISM automatically switches you to the NetView console and runs the command that you entered. To return to ISM, press F6.
To maintain security integrity across ISM in the remote NetView domain, the ISM operator's NetView userid (not ISM operator ID) must be set up identically on the local and remote NetView domain. When an ISM operator attempts to perform management functions on a target system (remote domain) ISM verifies that the NetView userid has the required authority on the remote domain before executing any commands.
For information about setting up the Focal Point Management application, see the section "Setting Up Focal Point Management" in the "Setting Up the ISM Environment" chapter. For information about monitoring resources in multiple domains, see the "Using the Focal Point Manager" chapter.
|
|