|
|

Table Of Contents
Understanding the Service Path Trace Windows and Views
Saving and Loading Service Path Trace Map Files
Tracing the Packet Path
This section describes how to view a network path between network objects using Service Path Trace. You can view the network path in packet-switched networks, such as Ethernet and IP. The Service Path Trace module displays the path a packet takes when running in the live network with all relevant network elements and nodes and the relevant layer properties (Layer 1, Layer 2 and Layer 3).
The tasks that you can perform using Service Path Trace are described in these sections:
•
Understanding the Service Path Trace Windows and Views
•
Roles Required to Use Service Path Trace
Table 11-1 lists the roles that are required to use the Service Path Trace. For more information on roles, see Creating and Managing Users and Scopes, page 14-27.
Note
Opening Service Path Trace
Service Path Trace can be opened from a physical interface or from a logical IP interface. The IP routing and path finding process is enabled according to the routing tables of each router. To view a specific path you must specify an initial point such as a port connector or an IP Flow point and a destination IP address.
The Service Path Trace module provides you with two windows in which you can view the path:
•
•
You can enter the required destination IP address after opening the Service Path Trace from the right-click shortcut menu at one of the following locations:
•
•
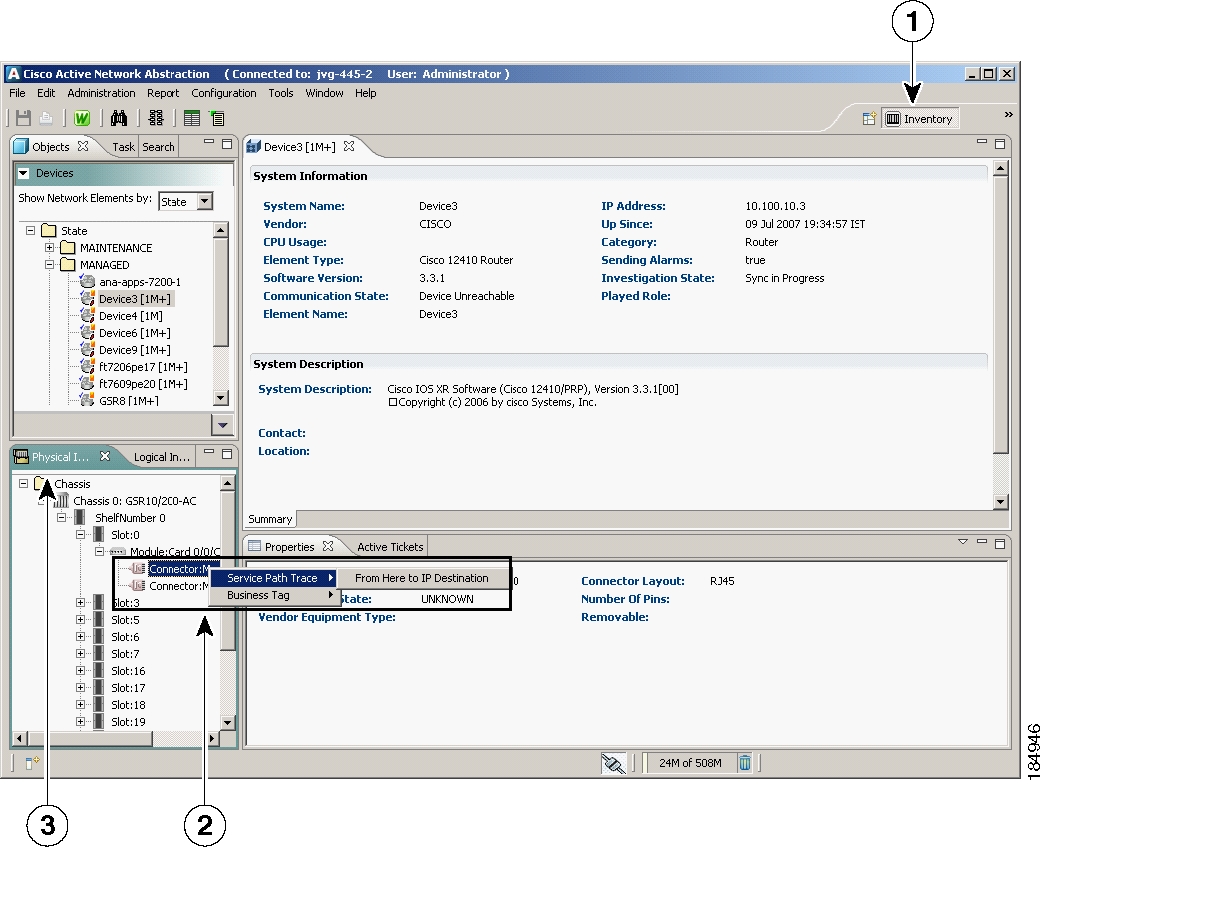
Figure 11-1 Launching Service Path Trace from the Physical Inventory Tab
Inventory perspective.
Physical Inventory tab.
Launching Service Path Trace by right-clicking a Port Connector.
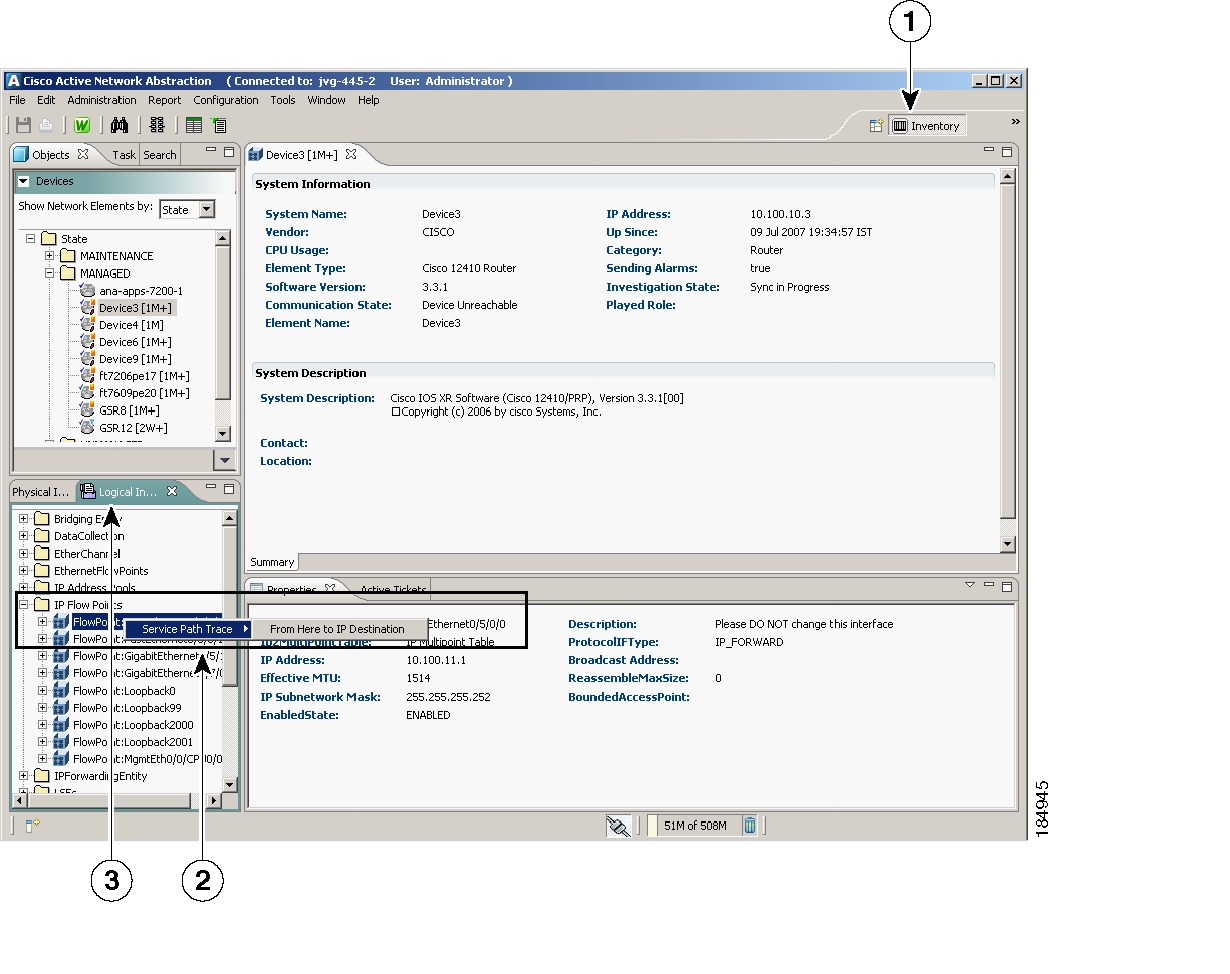
Figure 11-2 Launching Service Path Trace from the Logical Inventory Tab
Inventory perspective.
Logical Inventory tab.
Launching Service Path Trace by right-clicking an IP Flow Points.
To open a Service Path Trace:
Step 1
Step 2
•
or
•
Step 3
Step 4
Step 5
For information on Service Path Trace windows, see Understanding the Service Path Trace Windows and Views.
Understanding the Service Path Trace Windows and Views
This section describes the Service Path Trace windows and views:
•
•
•
Understanding the Service Path Trace Multi Path Window
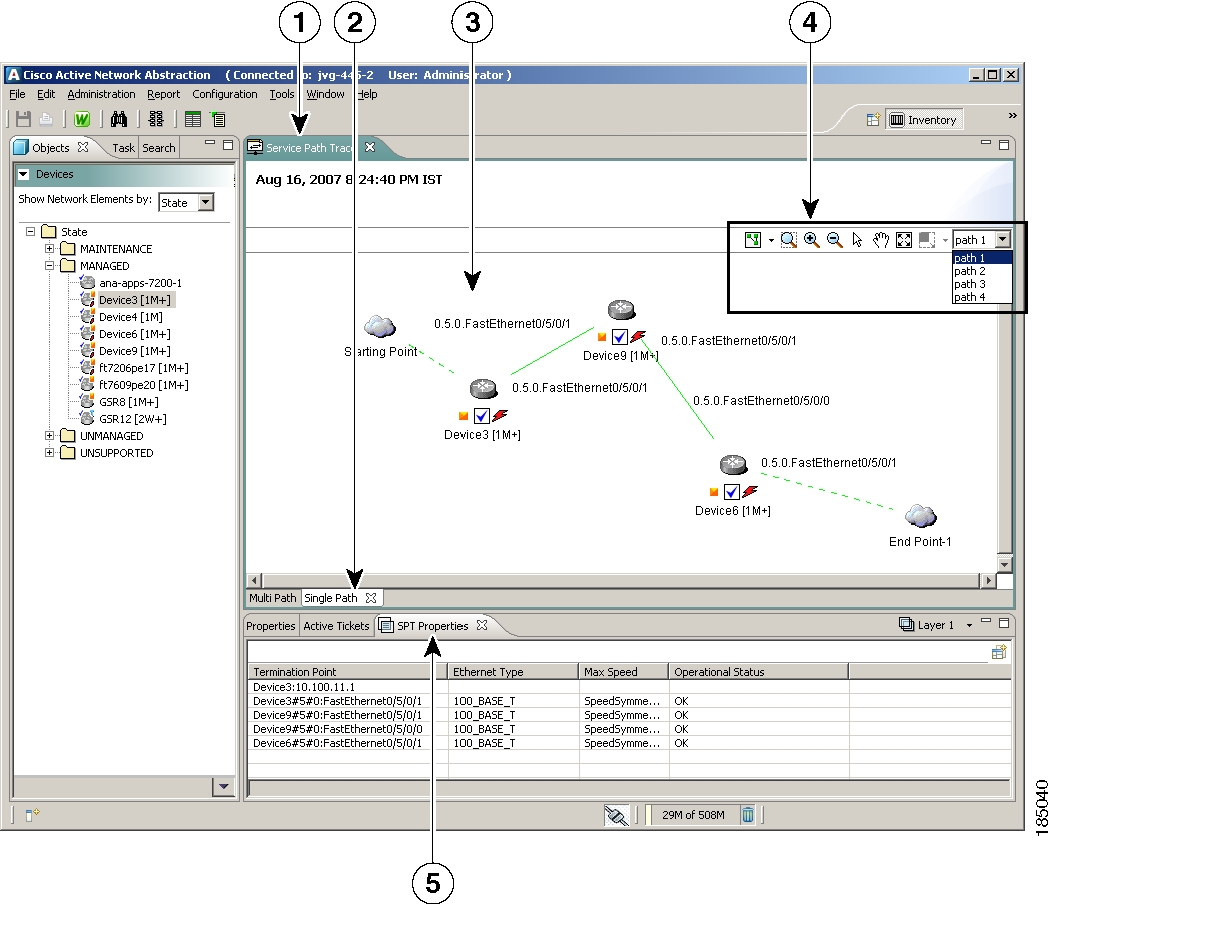
The Service Path Trace Multi Path window displays all the discovered paths for the selected context, including network elements, and physical links in the topology workspace. If multirouting is configured on the network elements, Service Path Trace displays the data relevant to more than one possible path.
Figure 11-3 shows the Multi Path window. This window contains the following:
•
•
•
•
•
•
•
•
You can select any network element in the topology workspace and view the NE properties. For information on NE properties, see Viewing the Network Element Inventory, page 3-3.
Figure 11-3 Service Path Trace Multi Path Window
The Service Path Trace Multi Path window enables you to perform the following functions:
Table 11-2 Service Path Trace Multi Path Window Tool Buttons
Run Again
Enables you to run Service Path Trace again with the same source and destination used to launch the current Service Path instance without re-entering the source and destination information. A new tab with an up-to-date (refreshed) path is created with the tab title indicating the snapshot time.
Layout
Defines the way in which the map is displayed in the topological map pane; for example, Circular, Tree, Hierarchical, or Symmetric.
Zoom Selection
Activates the zoom selection mode, which enables you to select an area in the map workspace to be enlarged by clicking and dragging to view the selected area.
Zoom In
Zooms in on the topology map.
Zoom Out
Zooms out of the topology map.
Normal Selection
Activates the normal selection mode.
Pan
Activates the pan mode, which enables you to move around in the map workspace by clicking and dragging.
To deselect the Pan icon, click Normal Selection.
Fit In Window
Fits the entire subnetwork or map in the topology workspace.
Resize
Enables you to resize the NE in the map workspace. By default, the NE size is medium.
•
•
•
Save to file
Saves the current path trace. For more information, see Saving and Loading Service Path Trace Map Files
Load from file
Loads any previously saved Service Path trace instance and displays the path in the topology workspace. For more information, see Saving and Loading Service Path Trace Map Files.
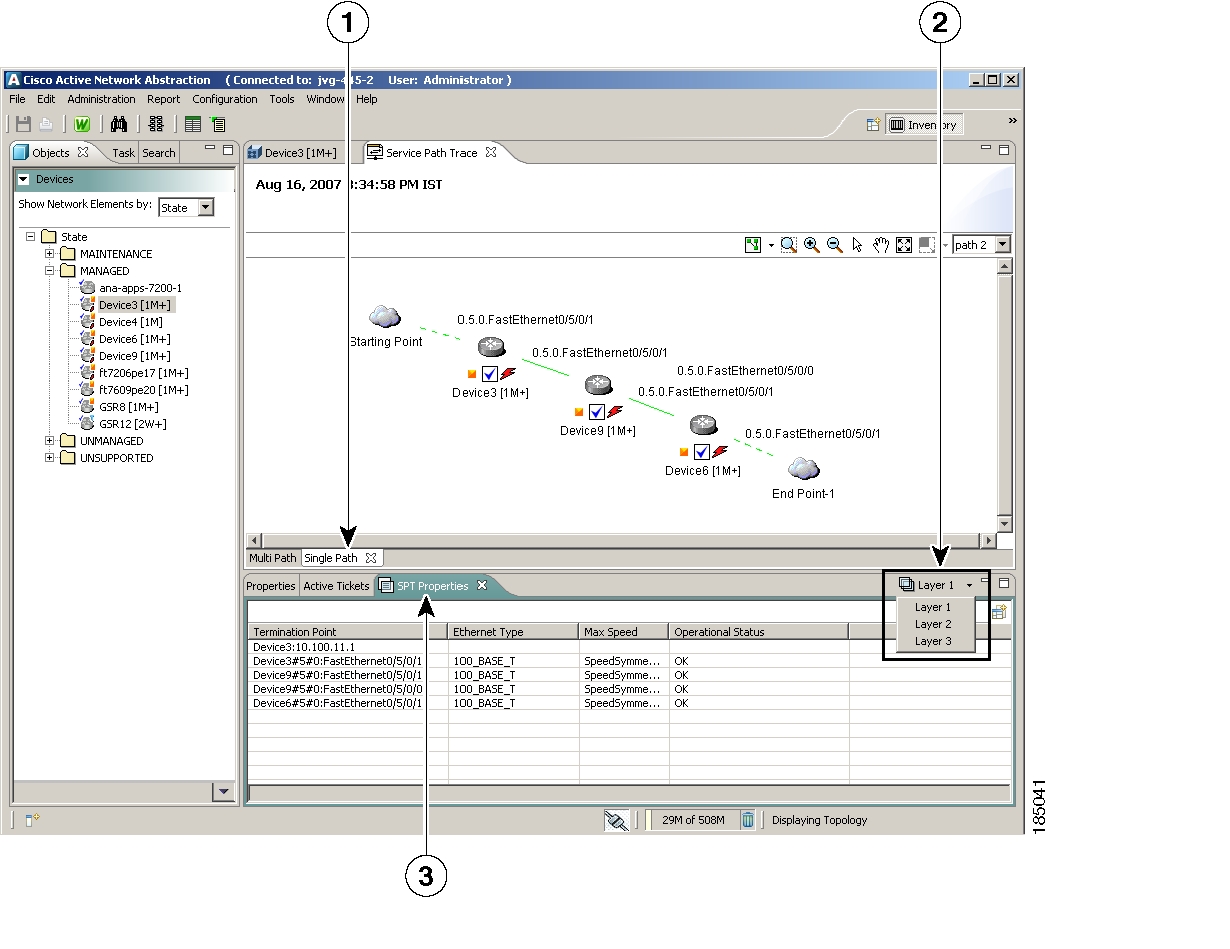
Understanding the Service Path Trace Single Path Window
The Single Path window displays the topology showing the layer properties of the selected single path. You can view the details of the path using the Service Path Trace (SPT) view. For information on the SPT view, see Viewing the Path Trace Properties Using the SPT View.
You can select any network element in the topology workspace and view the NE properties. For information on NE properties, see Viewing the Network Element Inventory, page 3-3.
Figure 11-4 Service Path Trace Single Path Window
Service Path Trace map tab.
Single Path tab.
Map workspace.
Single Path window local toolbar.
SPT view. By default, this view is activated when the Single Path window is opened.
The Service Path Trace Single Path window enables you to perform the following functions:
Viewing the Path Trace Properties Using the SPT View
When the Service Path Trace is launched, a common supporting view is also launched, showing Layer 1, Layer 2, and Layer 3 as a table.
Figure 11-5 SPT View
You can choose a layer from the drop-down list. Based on your selection, the NE labels displayed in the links are updated in the topology workspace.
•
•
•
Saving and Loading Service Path Trace Map Files
Service Path Trace enables you to export the maps (paths) displayed in the Multi Path window to a XML file. The data can then be viewed at a later stage to assess whether anything has changed.
The Service Path Trace load icon allows you to load the previously saved path trace that is saved in the XML format.
Note
To save and load the multipath map:
Step 1
Step 2
Step 3
You can also load the Service Path Trace file from File > Service Path Trace > Load Multi-Path.
Step 4
![]()
![]()
![]()
![]()
![]()
![]()
![]()
![]()
Posted: Mon Sep 24 07:35:24 PDT 2007
All contents are Copyright © 1992--2007 Cisco Systems, Inc. All rights reserved.
Important Notices and Privacy Statement.