|
|

Fault and performance management includes the following topics:
The Cisco MGM Alarm component, which is a customized component of the CEMF3.1 platform, handles Cisco MGX 8260 Media Gateway alarms and events. Cisco MGM receives alarm and event messages from managed objects and displays them in the Map Viewer and Event Browser. The Map Viewer displays alarms on the topology view, and the event browser displays events in tabular form. The tabular data includes severity, date, source, and other information.
Cisco MGM implements alarm features using SNMP trap messages. A configuration file maps SNMP traps to Cisco MGM alarms. For more information, see the Cisco Element Management Framework User Guide. Before Cisco MGM can process alarm information, you need to register the traps you want the Cisco MGX 8260 Media Gateway to forward. You register traps using the Cisco WebViewer tool. You can also view MGX 8260 alarms and events directly from the Cisco WebViewer.
The Cisco MGX 8260 Media Gateway reports performance information for DS1, E1, DS3, and SONET lines. In addition, you can set performance thresholds and assign alarm severities that the nodes report. You view this information using the Cisco WebViewer tool. For more information, see the "Cisco WebViewer Sessions" section.
An optional product, the Cisco Voice CORBA Gateway, forwards Cisco MGX 8260 Media Gateway performance information to higher-level managers.
You can monitor alarms and events from two screens:
In addition, you can configure notification groups and channels. These notifications provide audible and visual alerts when significant events occur. For usage details, refer to the Cisco Element Management Framework User Guide; these sections are provided only as an orientation.
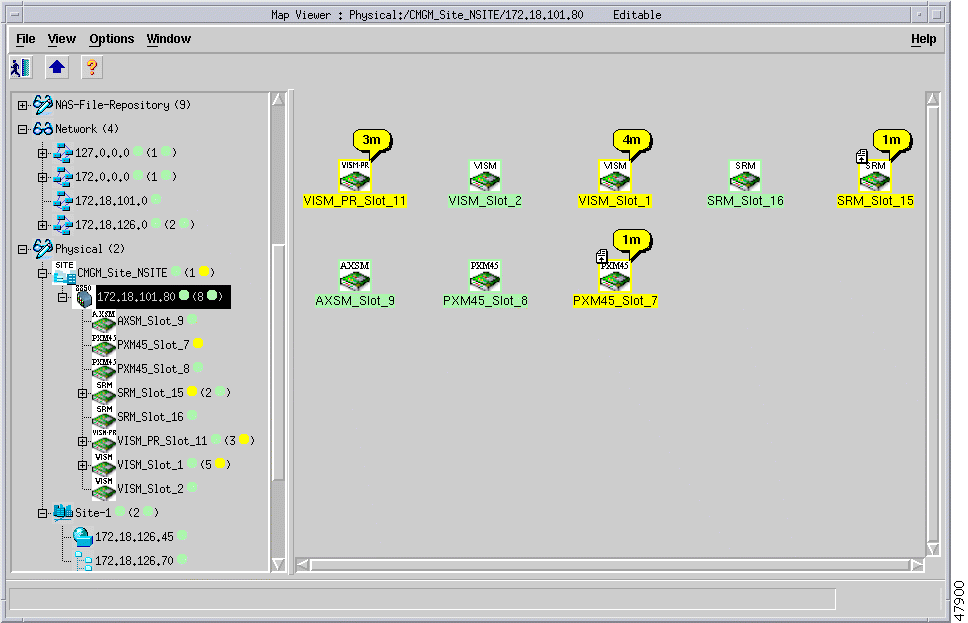
For Cisco MGM, the Map Viewer displays information about the Cisco MGX 8260 nodes, cards, and other network equipment (see Figure 7-1).

Each object shown in the right window provides graphical cues about its network element. The information can be structural information, for example, a network element name, or state and event information, such as "out of service." If an object becomes unreachable, it displays as a bomb icon.
Each object may display the following information about its associated network element:
 |
Note The icon displays the most severe event only. |
The colors and codes of severities used in Cisco EMF are shown in Table 7-1.
| Icon Color | Balloon Code | Severity of Event |
|---|---|---|
Red | C | Critical |
Orange | M | Major |
Yellow | m | Minor |
Cyan | W | Warning |
Green | (none) | Normal |
White | i | Informational |
The event status of objects contained in a map can affect the event status of the parent icon. In other words, if the event status changes on a map object, this is propagated to the parent icon. The event status is changed to reflect the most severe event of its children.
In Cisco EMF, when a condition (fault) occurs on a managed object, the system is notified immediately. This notification is shown as an event and can be viewed with the Cisco EMF Event Browser. The Event Browser is opened from the Cisco EMF Launchpad. A window similar to Figure 6-3 is displayed.
The Event Browser provides a tool to manage the network efficiently; you can list, query, and sort all or some events according to how you want to manage the network. Services can be invoked on events so faults can be attended to from the window that shows the event.
 |
Note You can also view events on Cisco EMF maps; however, only the most severe fault on a managed object is shown on the map icon. |
The main panel in the Event Browser window displays a list of events including:
Two indicators, color coded to the severity of the event, are available to the left of the object name:
Click the Ack button to indicate to other users that the fault is being worked on. The button changes to the color of the severity. If for any reason you cannot clear the problem, this button can be deselected so the event can be reassigned. The Clear button is highlighted when the fault has been rectified to indicate that the event requires no further attention.
You launch the Event Browser application using an icon on the Cisco EMF Launchpad.
This icon opens the Query Editor window, from which you can specify the type of
events to view.
Alternatively, you can right click on one or more objects in the Map Viewer and then select the Event Browser. The Event Browser displays only the events associated with the selected objects.
You can check the log files for significant Cisco MGM and Cisco EMF events. The following table summarizes the important logs:
| File | Description |
|---|---|
<CEMF_ROOT>/logs/cmgmCtlr.log | Controller event log |
<CEMF_ROOT>/logs/LogercmgmCtlr.log | Cisco MGM-specific log |
Cisco MGX 8260 Media Gateway nodes notify Cisco MGM of alarms and events using trap messages. Before Cisco EMF can display alarms, you must register traps at each MGX 8260 node.
When working with traps, you configure the following parameters:
You register traps using the Cisco WebViewer. The following table summarizes the Cisco WebViewer procedures for trap registration and community string configuration. for more information, see the "Cisco MGM Community String Configuration" section.
| Configuration Task | Navigation Tree Selection | Screen | Screen Link |
|---|---|---|---|
Trap configuration | Node>SNMP>Trap Registration | Trap Registration | + to add |
Community string configuration | Node>SNMP>Community String | Community String | + to add |
The Cisco MGX 8260 Media Gateway supports the following trap categories:
| Bit | Trap | Description |
|---|---|---|
0 | Severity | Major (trap severity selection) |
1 | Severity | Minor (trap severity selection) |
2 | Severity | Information (trap severity selection) |
3 | 1000 to 1099 | Shelf |
4 | 1100 to 1199 | Card |
5 | 1200 to 1299 | SNMP |
6 | 1300 to 1399 | Dsx1 Line |
7 | 1400 to 1499 | Dsx3 Line |
8 | 1500 to 1599 | Sonet Line |
9 | 1600 to 1699 | Ether Line |
10 | 1700 to 1799 | Voice Port |
11 | - | Ether Channel |
12 | - | Voice Channel |
13 | 1800 to 1899 | EMM |
14 | 1900 to 1999 | Clock |
15 | 2000 to 2099 | DSP |
16 | 2100 to 2199 | DMCMAP |
17 | 2200 to 2299 | ISDN |
18 | 2300 to 2399 | MGCP |
19 | 2400 to 2499 | Backhaul Session |
The Cisco WebViewer displays the entire list of traps on the configuration forms.
The Cisco MGX 8260 Media Gateway notifies maintenance or operations personnel about equipment alarms at several levels:
You can view the event log for notices about changes in the system. For example, inserting a new card adds an event to the log.
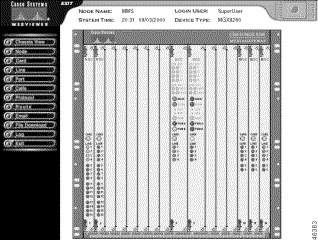
The WebViewer displays the most severe alarm in the upper right corner of every screen (see Figure 6-4).

The alarm indicator is a rectangular icon, which is green for normal operation and flashes red or yellow for alarms. You can obtain more information about the alarm by clicking the alarm indicator.
The chassis view also shows a graphical representation of the front panel, including alarm indications for each card. To obtain more information about a specific card, click the corresponding Card or Line indicator.
The Cisco MGX 8260 Media Gateway reports the alarms from the following sources:
The following table summarizes the Cisco WebViewer support for monitoring alarms.
| Surveillance Task | Navigation Tree Selection | Screen | Screen Link |
|---|---|---|---|
View alarm status | Node>Alarm | Alarm Status | i for environmental |
View card alarms | Card>All-Cards | Physical Slot Configuration | i for card details |
View DS1 alarms | Line>Dsx1-T1>All-Lines | Dsx1-T1 Line Configuration | i for line details |
Set DS1 alarm thresholds | Line>Dsx1-T1>All-Lines | Dsx1-T1 Line Configuration | A for thresholds |
View E1 alarms | Line>Dsx1-E1>All-Lines | Dsx1-E1 Line Configuration | i for line details |
Set E1 alarm thresholds | Line>Dsx1-E1>All-Lines | Dsx1-E1 Line Configuration | A for thresholds |
View DS3 alarms | Line>Dxs3>All-Lines | Dsx3 Line Configuration | i for line details |
Set DS3 alarm thresholds | Line>Dsx3>All-Lines | Dsx3 Line Configuration | A for thresholds |
View SONET alarms | Line>Sonet>All-Lines | Sonet Line Configuration | i for card details |
Set SONET alarm thresholds | Line>Sonet>All-Lines | Sonet Line Configuration | A for thresholds |
View Fast Ethernet alarms | Line>Ether>All-Lines | Ether Line Configuration |
|
View trap log | Log>Trap Log | Trap Log |
|
The Cisco MGX 8260 Media Gateway reports performance statistics for the following lines:
The following table summarizes the Cisco WebViewer support for monitoring performance.
| Surveillance Task | Navigation Tree Selection | Screen | Screen Link |
|---|---|---|---|
View DS1 performance | Line>Dsx1-T1>All-Lines | Dsx1-T1 Line Configuration | C for performance |
View real-time DS1 statistics | Line>Dsx1-T1>Counters and Alarm | T1 Line Counters/Alarm |
|
View interval DS1 statistics | Line>Dsx1-T1>All-Lines | Dsx1-T1 Line Configuration | P for statistics |
View E1 performance | Line>Dsx1-E1>All-Lines | E1 Line Configuration | C for performance |
View real-time E1 statistics | Line>Dsx1-E1>Counters and Alarm | E1 Line Counters/Alarm |
|
View interval E1 statistics | Line>Dsx1-E1>All-Lines | E1 Line Configuration | P for statistics |
View DS3 performance | Line>Dxs3>All-Lines | Dsx3 Line Configuration | C for performance |
View real-time E1 statistics | Line>Dsx3>Counters and Alarm | Dsx3 Line Counters |
|
View interval E1 statistics | Line>Dxs3>All-Lines | Dsx3 Line Configuration | P for statistics |
View SONET performance | Line>Sonet>All-Lines | Sonet Line Configuration | C for performance |
View real-time SONET section statistics | Line>Sonet>Section Performance | Sonet Section Counters | - |
View real-time SONET line statistics | Line>Sonet>Line Performance | Sonet Line Counters | - |
View real-time SONET path statistics | Line>Sonet>Path Performance | Sonet Path Counters | - |
View interval SONET statistics | Line>Sonet>All-Lines | Sonet Line Configuration | S for section L for line P for path |
![]()
![]()
![]()
![]()
![]()
![]()
![]()
![]()
Posted: Thu Jul 18 00:04:28 PDT 2002
All contents are Copyright © 1992--2002 Cisco Systems, Inc. All rights reserved.
Important Notices and Privacy Statement.