|
|

This chapter presents a tutorial describing how to generate and display a Diagnostic Report for the current baseline, then use the information provided in the report, to fix potential network problems. Refer to "Creating and Opening a Baseline" for information on creating and loading a baseline. In actual work environments prior to starting the Connectivity Baseliner or Connectivity Solver, access to the network's router configuration files is required. Methods for retrieving your router configuration files are outside the scope of this tutorial. Therefore, sample router configuration files (located in the install_directory/sample_configs directory) are provided and used by this tutorial. The sample router configuration files contain a representative set of errors the Connectivity Tools are capable of diagnosing, reporting on, and resolving.
We recommend you proceed through this tutorial with the Connectivity Baseliner or Connectivity Solver running thereby enhancing your understanding of and proficiency in using the Connectivity Tools.
Under most circumstances, all of the problems reported in the Diagnostics Report would be fixed, the baseline reloaded, diagnostics rerun on the baseline, then the regenerated diagnostic report analyzed to ensure the problems had been fixed. In this tutorial, a High Priority Access List problem is going to be fixed. The same steps used to fix this problem are used to fix other High Priority and Warning-Level problems. The tutorial follows the steps listed below:
Step 1 Open and load a baseline.
Step 2 Run diagnostics on the baseline.
Step 3 Analyze the Diagnostics Report.
Step 4 Fix a High Priority IP access list problem reported in the Diagnostics Report.
Step 5 Open and load the baseline again.
Step 6 Rerun diagnostics on the baseline checking to ensure the High Priority access list problem was fixed.
Having proceeded through the steps of creating and opening a baseline in the first tutorial as described in "Creating and Opening a Baseline" the Connectivity Tools window, shown in Figure 5-1, is displayed.
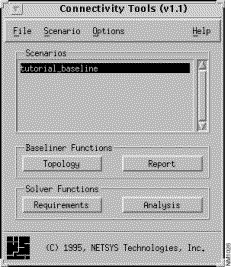
Step 1 Click on the Report button.
A Diagnostic Report pertaining to the tutorial_baseline baseline is generated and displayed. Upon generating the Diagnostic Report, the Report window, partially shown in Figure 5-2, is displayed.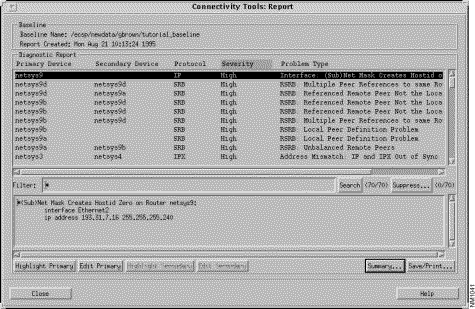
Step 2 To print or save a copy of the Diagnostic Report, click on the Save/Print button.
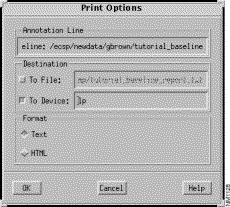
The Print Options window is displayed as shown in Figure 5-3. You can save the report in either ASCII text or HTML format or print the report to a PostScript printer from this window.
Step 3 Analyze the Diagnostic Report.
The Diagnostic Report is initially sorted by the problem severity. High severity problems are listed first followed by warning-level problems. You can alter the way the problems are sorted in the window by clicking on any of the Diagnostic Report column headers. For example, clicking on the Primary Device column header sorts the report entries by the primary device names.
Step 4 Click on the Summary button.
The Report Summary window, shown in Figure 5-4, is displayed. This window provides you with a summary of the types and total number of problems detected while parsing the router configuration files during the opening of the baseline. It also provides you with a statistical summary about the router configuration files and interfaces being used as well as a summary of the number of parsed and unparsed router commands and non-connectivity related router commands detected during the parsing of the router configuration files. See Chapter 5, "Diagnostic Report," in the Enterprise/Solver Connectivity Tools Reference Manual for detailed information about the Report Summary window.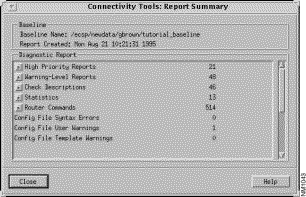
Step 5 Click on the Close button in the Report Summary window when you are through examining the summary report categories.
Step 6 Click on the Suppress button in the Report window.
The Suppress Entries window, shown in Figure 5-5, is displayed. In order to decrease the number of problem entries being displayed in the Report window, you can specify categories of information to be suppressed.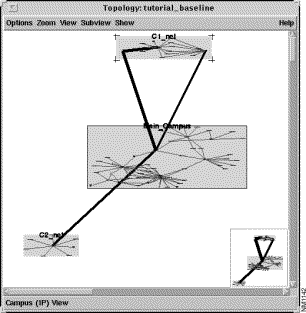
Step 7 Deselect all Add Suppression boxes other than Severity, specify Warning in the Severity text field, then click on the Add button.
In this tutorial a high severity access list problem is going to be addressed, therefore all problem entries that are of warning-level type are going to be suppressed, as shown in Figure 5-6. The suppression parameter is now displayed in the Suppressed Entries list and the Report window's Diagnostic Report list displays only entries containing high severity reports. Notice that forty eight entries have been suppressed in the Reports window as signified by the first number listed in the parentheses following the Suppress .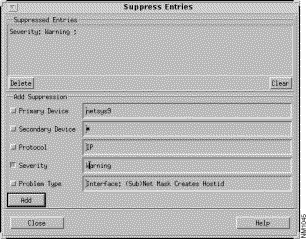
Step 8 Click on the Problem Type column header.
The diagnostic report entries are now sorted alphabetically by problem type. The first problem types listed are access list related problems. You can also display the high severity, access list problems by specifying High *Access in the Filter field then clicking on the Search button.
Step 9 Select the entry for primary device netsys6 in the Diagnostic Report pane.
Information describing the problem in more detail is displayed in the field below the Filter field in the Reports window. To fix the reported problem you must edit the netsys6 router configuration file.
Step 10 Click on the Edit Primary button.
The netsys6 router configuration file can be opened in read only or read/write mode.
Step 11 Click on the Read/Write button. A copy of the netsys6 router configuration file is displayed using the text editor specified by the EDITOR environment variable (in this tutorial, vi).
Step 12 Find the "Undefined ipx output/router/sap filter referenced 950 on interface Ethernet1" entry in the netsys6 router configuration file by using the editor's search feature.
For example, in vi enter /950 to find the line causing the access list problem in the netsys6 router configuration file. The results of the search are shown in Figure 5-7. The cursor is located over the 9 in the problematic line.

Step 13 Delete or comment out the problematic line in the router configuration file.
Having found the problematic line in the netsys6 router configuration file using the editor's search feature, delete or comment out the line, as shown in Figure 5-8. The line has been commented out (first column of the line has an exclamation point in it).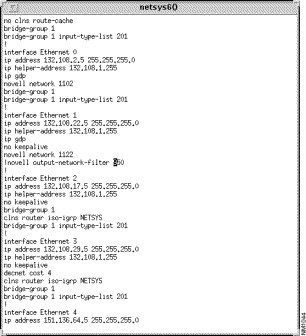
Step 14 Quit from the editor using the editor's quit command.
It is very important to use the editor's quit command and not the window manager's quit command to ensure the changes to the router configuration file are saved.
Step 15 Click on the Report window's Close button.
At this point, the current Diagnostic Report window still contains entries for all of the problems. The modified netsys6 router configuration file is not a part of the currently loaded baseline. In order for the modification to be incorporated into the current baseline, the tutorial_baseline baseline must be reloaded. First, close the current report.
Step 16 Select the File>Open Baseline menu option in the Connectivity Tools window to reload the tutorial_baseline baseline.
Upon invoking this menu option, a message is displayed stating that opening a new baseline causes the current work in progress to be lost. This does not apply to the changes made to the netsys6 router configuration file, therefore click on the Yes button to continue.
Step 17 Select the tutorial_baseline baseline from the Baselines list in the Open Baselines window, then click on the OK button.
The router configuration files (including the modified netsys6 file) are parsed again and the tutorial_baseline baseline is reloaded.
Step 18 Click on the Report button in the Connectivity Tools window.
Another Diagnostic Report is generated reflecting the latest versions of the router configuration files for the tutorial_baseline baseline.
Step 19 Notice the number of entries in this Diagnostic Report has decreased by one (from 70 to 69.)
This is due to the netsys6 IPX access list problem being fixed.
Step 20 Specify High *Access in the Filter field then click on the Search button.
Again, only the high severity, access list related problems are now displayed in the Report window. Notice the netsys6 access list problem is no longer in evidence.
|
|