|
|

Table Of Contents
Monitoring SNA Switch Resources
Enabling ISM to Monitor SNA Switch
Monitoring SNA Switching Using the Standard Interface
Monitoring Status of the SNA Switch
Selecting Options for the SNASw Server
Displaying Internal Variables for Monitoring SNASw
Displaying SNASw Historical Performance Data
Performing Management Operations
ISM SNA Switch Node Administration
Managing the SNA Switch Links on the Router
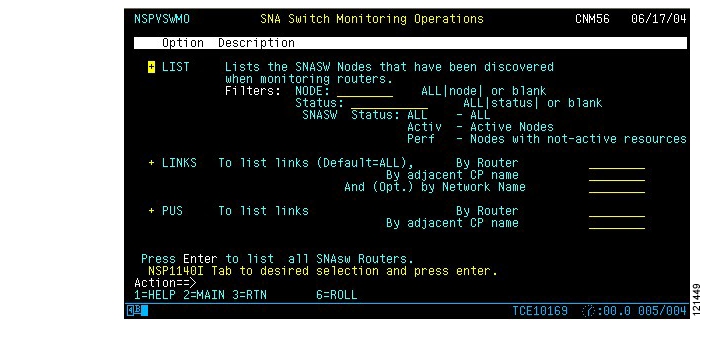
Monitoring SNA Switching Operations Using the Standard Interface
Monitoring SNA Switch Resources
When you monitor SNA Switch (SNASw), keep the following considerations in mind:
•
SNASw monitoring is disabled by default in ISM setup when you first initialize ISM.
•
•
•
To enable ISM to monitor SNA Switching, perform the steps described in the following sections:
•
•
•
Enabling ISM to Monitor SNA Switch
Use the following procedures to monitor Cisco SNA Switching:
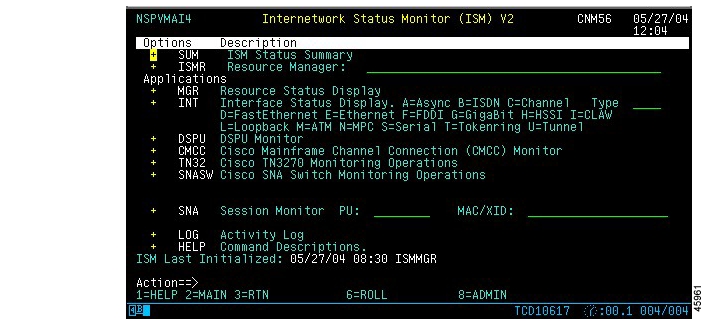
Step 1
The ISM Administration panel ( Figure 9-1) is displayed.
Figure 9-1 Internetwork Status Monitor (ISM) Main Menu Panel
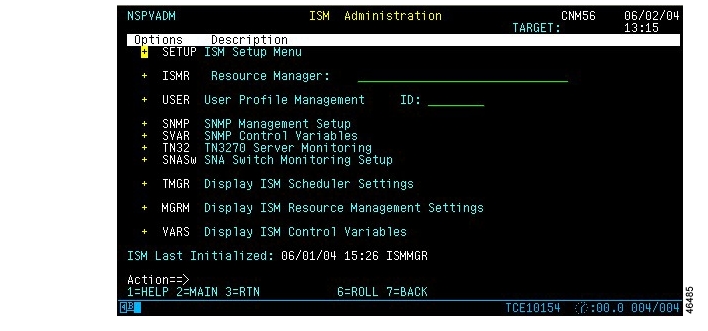
Figure 9-2 ISM Administration Menu Panel
Step 2
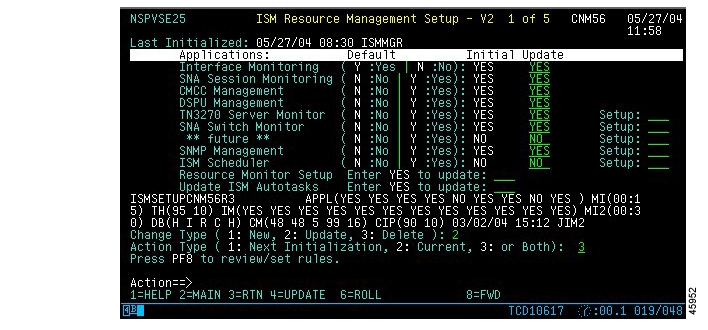
Figure 9-3 ISM Resource Management Setup Panel
Step 3
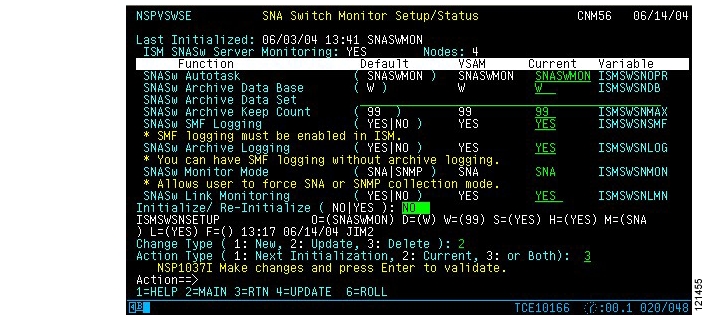
+ SNASW Cisco SNA Switch Monitoring OperationsStep 4
Figure 9-4 SNA Switch Monitor Setup/Status Panel
The following table describes the fields contained in the SNA Switch Monitor Setup/Status panel:
Step 5
Monitoring SNA Switching Using the Standard Interface
This section describes how to monitor the status of SNA Switch using the standard interface. It describes the following tasks:
•
•
•
•
•
•
•
•
Monitoring Status of the SNA Switch
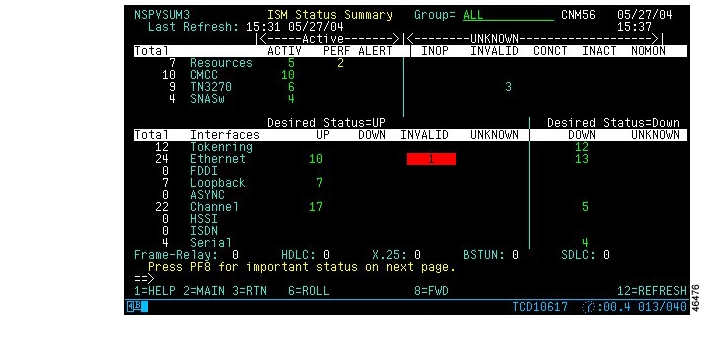
You can monitor the status of SNA Switch from the ISM Status Summary panel or from the ISM main menu panel. The following steps show you how to access SNA Switch Node Status from the ISM Status Summary panel:
Step 1
Figure 9-5 ISM Status Summary Panel
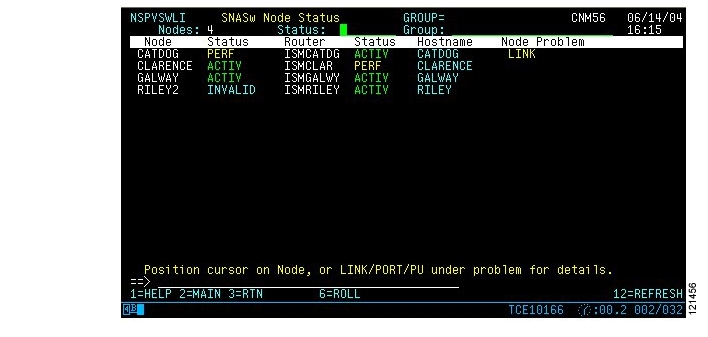
The SNASw Node Status panel ( Figure 9-6) is displayed.
Figure 9-6 SNASw Node Status Panel
The SNASw Node status panel displays the following fields:
Selecting Options for the SNASw Server
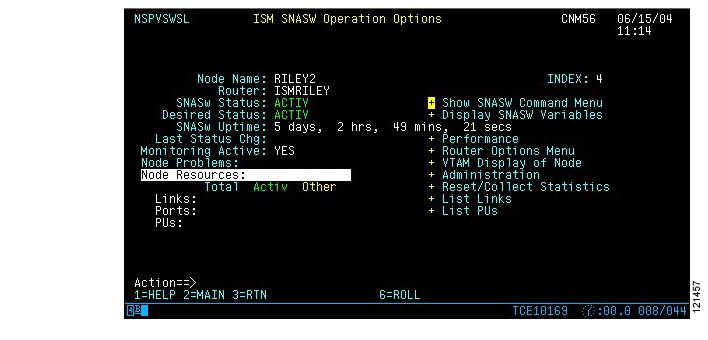
Step 1
Figure 9-7 ISM SNASW Operation Options Panel
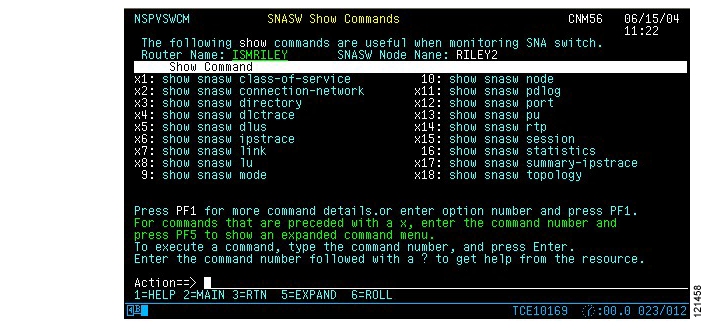
Step 2
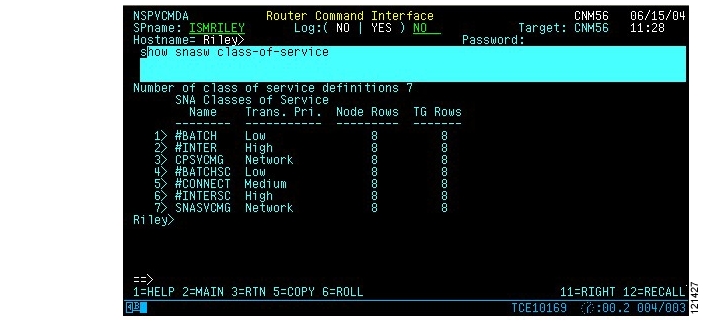
Figure 9-8 SNASW Show Commands Panel
Step 3
Figure 9-9 SNASw Show Commands Output Panel
Displaying Internal Variables for Monitoring SNASw
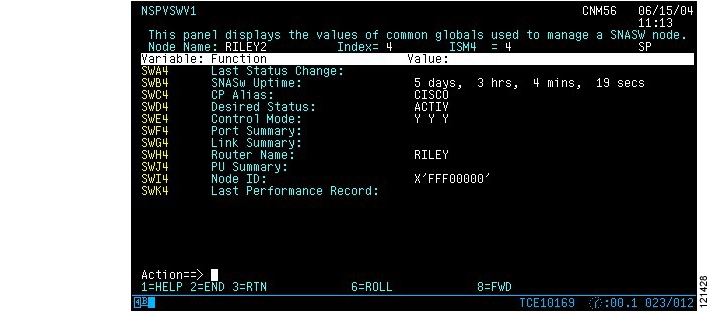
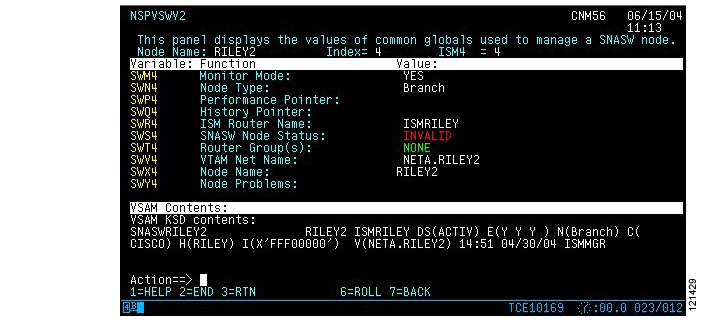
To display the internal variables used by ISM to monitor SNASw, select the Display SNASW Variables option on the ISM SNASW Operation Options Panel ( Figure 9-7) by placing the cursor on it and pressing Enter. Figure 9-10 and Figure 9-11 show the resulting output.
Figure 9-10 SNASw Control Block Panel - 1 of 2
Figure 9-11 SNASw Control Block Panel - 2 of 2
Displaying SNASw Historical Performance Data
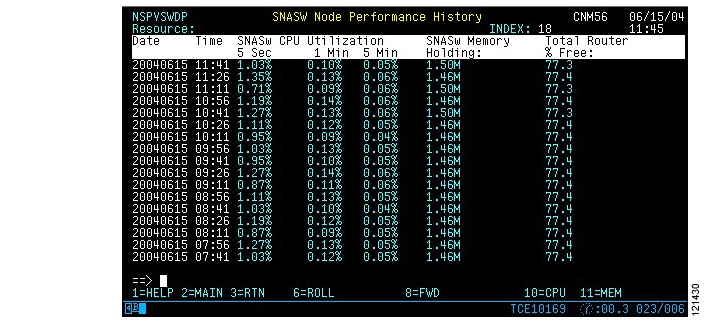
To display SNASw historical performance data, select Performance option on the ISM SNASW Operation Options Panel ( Figure 9-7) by placing the cursor on it and pressing Enter. Figure 9-12 shows sample SNASw performance statistics.
Figure 9-12 SNASW Node Performance History Panel
The SNASW Node Performance History panel displays the following fields:
To display the output from a show process cpu command on the router, press PF10. To display the output from a show process mem command on the router, press PF11. The output from these commands is displayed on the Router Command Interface panel.
Performing Management Operations
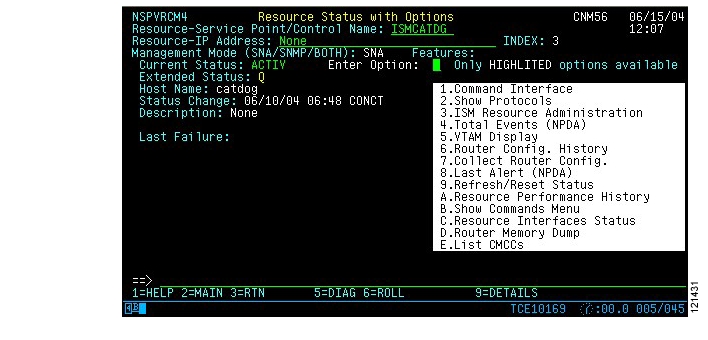
To perform management operations on the router, select the Router Options Menu by placing the cursor on it on the ISM SNASW Operation Options Panel ( Figure 9-7) and pressing Enter. Figure 9-13shows the Router Options Menu.
Figure 9-13 Router Options Menu Panel
The Resource Status with Options panel is described in "Monitoring ISM Resources".
Displaying VTAM Status
To display the VTAM status for the SNASw Control Point Name, select VTAM Display of Node on the ISM SNASW Operation Options Panel ( Figure 9-7) by placing the cursor on it and pressing Enter. Figure 9-14 shows a sample display of a SNASw CPNAME.
Figure 9-14 SNASw Control Point VTAM Status
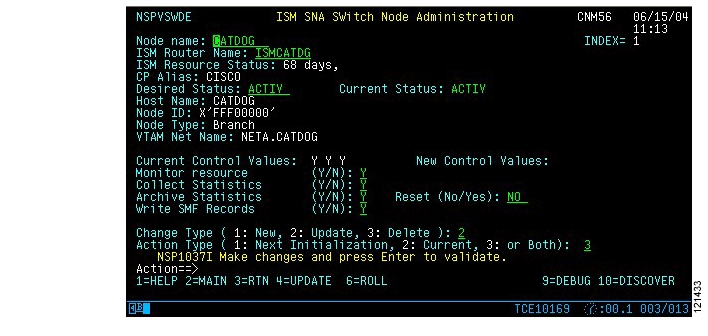
To perform administrative tasks, select the Administration option on the ISM SNASW Operation Options Panel ( Figure 9-7). (This option is displayed only if you have the authority to change the management rules for monitoring routers.) The ISM SNA Switch Node Administration panel ( Figure 9-15) is displayed.
Figure 9-15 ISM SNA Switch Node Administration Panel
ISM SNA Switch Node Administration
This section describes some ISM default behaviors and tasks you can perform using the ISM SNA Switch Node Administration panel to override those defaults and to perform other ISM administration tasks.
ISM Default Behaviors
By default, ISM performs the following tasks:
•
•
•
•
ISM SNA Switch Administration Tasks
From the ISM SNA Switch Node Administration panel, you can perform the following tasks to modify or override ISM default behaviors described in ISM Default Behaviors:
SNA Switch Monitoring
To prevent ISM from monitoring the status of a SNA Switch server and collecting statistics, enter N in the Monitor Resource field.
ISM Statistics Collection for SNA Switch Servers
To prevent ISM from collecting statistics for this SNA Switch server, enter N in the Collect Statistics field.
ISM Statistics Written to the VSAM Database
To suppress the writing of statistics to VSAM for this SNA Switch server, enter an N in the Archive Statistics field.
ISM Statistics Written to SMF
To suppress the writing of statistics to SMF for this SNA Switch server, enter an N in the Write SMF Records field.
SNA Switch Data Archiving
If SNA Switch data archiving is enabled, you can remove history records from the VSAM database for a specific router. To do so, enter YES in the Reset field and press PF4.
Saving Your Administrative Changes
Once you have completed any changes, press Enter to allow ISM to validate your updates. Then enter a 1, 2, or 3 for the Change Type to add, update, or delete a SNASw server respectively. Also enter a 1, 2, or 3 for the Action Type to indicate when the update should be effective.
To display the internal SNASw variables for this SNA Switch server, press PF9. SNASW Node Performance History Panel shows and example of the ISM SNA Switch Node Administration panel that is displayed.
To have ISM check the router in the ISM Router Name field for a SNASw server, press PF10.
Refreshing Status and Collecting Statistics
To refresh the status of SNA Switch and to collect statistics, place the cursor on Reset/Collect Statistics on the ISM SNASW Operation Options Panel ( Figure 9-7) and press Enter.
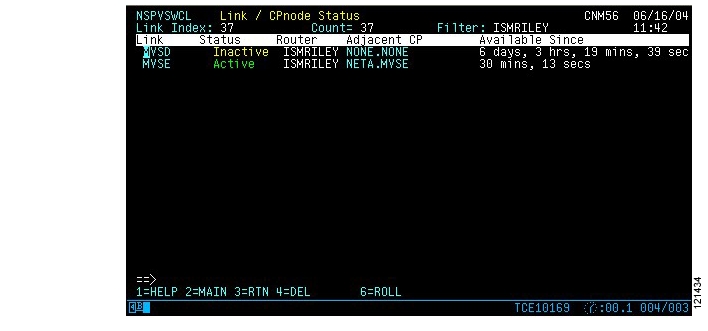
Managing the SNA Switch Links on the Router
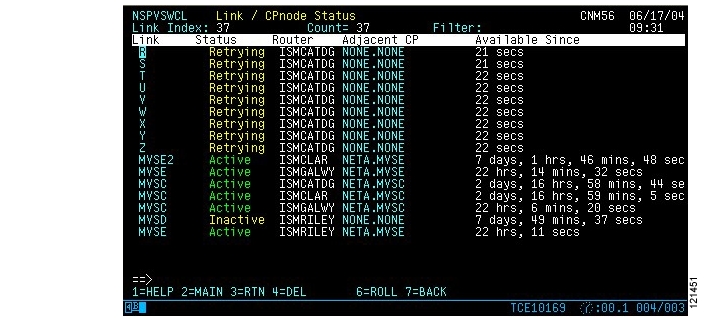
To display the SNA Switch links on the router and their status, position the cursor on List Links on the ISM SNASW Operation Options Panel (Figure 9-8) and press Enter. Figure 9-16 shows an example of the Link / CPnode Status panel that is displayed.
Figure 9-16 Link / CPnode Status Panel
The Link / CPnode Status panel displays the following fields:
Removing and SNA Switch Link
To remove an SNA Switch link from ISM, for example, if a link is no longer configured on the router, place the cursor on the line with the link and press PF4. The definition of the link and its archived statistics will be removed from ISM and the VSAM database.
Display the Status of a Link
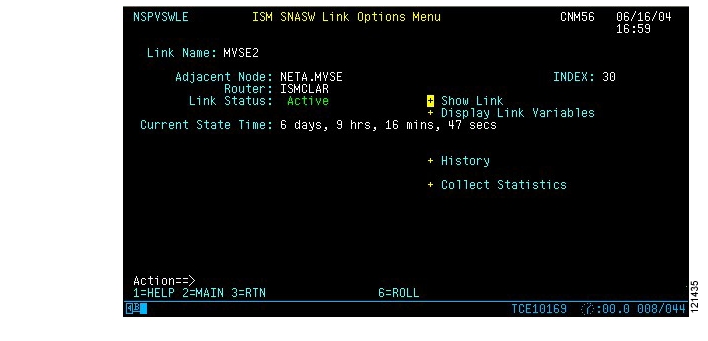
To display details of a SNA Switch link, place the cursor on the link and press Enter. ISM SNASW Link Options Menu Panel shows an example of the ISM SNASW Link Options Menu panel that is displayed.
Figure 9-17 ISM SNASW Link Options Menu Panel
Displaying Details about the Link
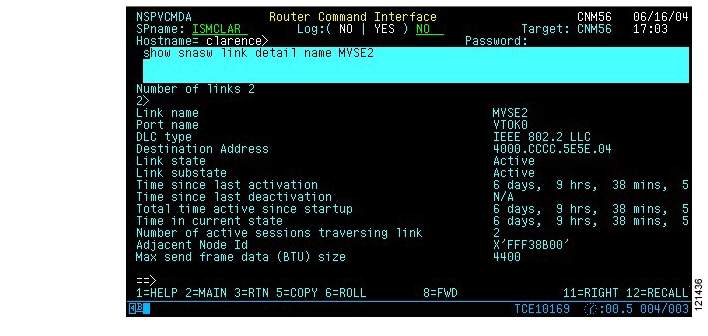
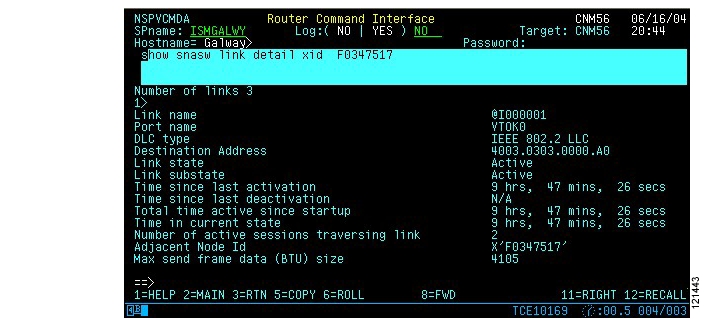
To display details about the link, place the cursor on Show Link field and press Enter. The Router Command Interface panel is displayed with the results of a show snasw link detail name router command. Router Command Interface Panel with Show SNASW Link Detail Name Output shows an example of the information displayed.
Figure 9-18 Router Command Interface Panel with Show SNASW Link Detail Name Output
Displaying ISM Internal Variables for the Link
To display the ISM internal variables for the link, place the cursor on the Display Link Variables field on the ISM SNASW Link Options Menu Panel ( Figure 9-19) and press Enter. Figure 9-20 shows an example of the ISM SNASW Operation Options panel that is displayed.
Figure 9-19 ISM SNASW Operation Options Panel
Displaying History Data for the Link
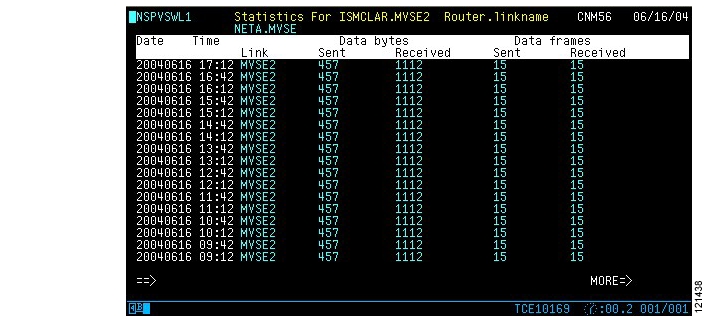
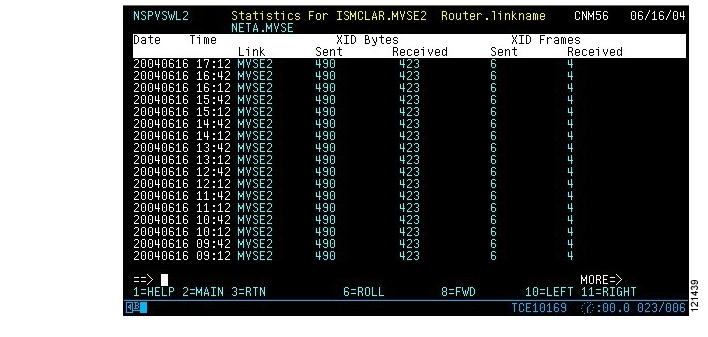
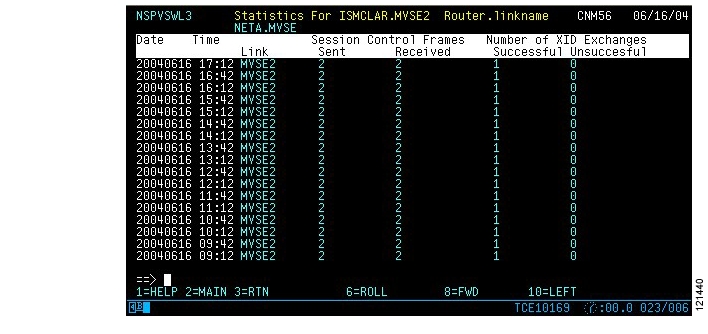
To display history data for this SNASw link, place the cursor on the History field on the ISM SNASW Link Options Menu Panel ( Figure 9-17) and press Enter. Figure 9-20 shows an example of the Statistics For Router.linkname panel that is displayed.
Figure 9-20 Statistics For Router.linkname Panel (1 of 3
There are more fields available than will fit on one display panel. You can press PF11 to display the fields to the right. Figure 9-21 and Figure 9-22 show the other 2 panels that are available. To display the columns to the left, press PF10. Use PF8 and PF7 to scroll the display down and up.
Figure 9-21 Statistics For Router.linkname Panel (2 of 3)
Figure 9-22 Statistics For Router.linkname Panel (3 of 3)
The Statistics for Router.linkname panels display the following fields:
Displaying the Physical Units
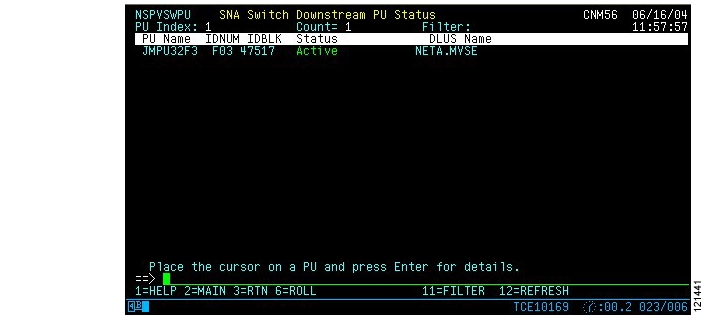
To display the Physical Units, PUs, connected though the DLUR function of SNA Switch, place the cursor on the List PUs selection on the ISM SNASW Operation Options Panel ( Figure 9-7) and press Enter. Figure 9-23 shows an example of the SNA Switch Downstream PU Status panel.
Figure 9-23 SNA Switch Downstream PU Status Panel
The SNA Switch Downstream PU Status panel displays the following fields:
Displaying Details for a PU
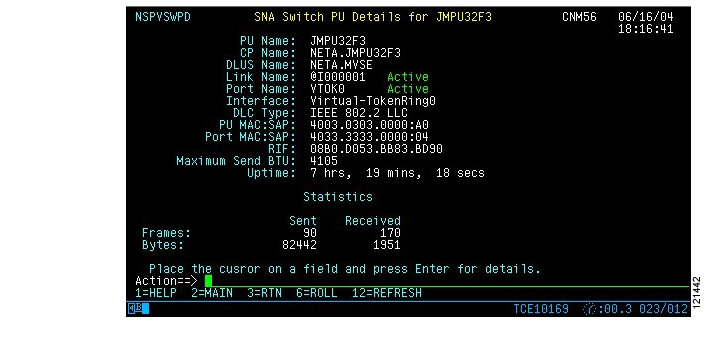
To display details for a PU, place the cursor on the line containing the PU and press Enter. Figure 9-24 shows an example of the SNA Switch PU Details for PUname panel that is displayed.
Figure 9-24 SNA Switch PU Details for PUname Panel
The SNA Switch PU Details for PUname panel displays the following fields:
Collecting Statistics for a PU
To collect the latest status and statistics for the PU, press PF12.
To display details about the PU, place the cursor on the PU Name line on the SNA Switch PU Details for PUname Panel ( Figure 9-24) and press Enter. The Router Command Interface Panel is displayed with the results of the show snasw link detail command. Figure 9-25 Shows an example of the panel.
Figure 9-25 Router Command Interface Panel with show snasw link detail
Displaying VTAM Status for a PU
To display the VTAM status of the CPNAME, place the cursor on the CP Name field on the SNA Switch PU Details for PUname Panel Figure 9-24) and press Enter. Figure 9-26 shows an example of the panel that is displayed.
Figure 9-26 VTAM Display of CP Name
To display the VTAM status of the DLUS, place the cursor on the DLUS Name field on the SNA Switch PU Details for PUname Panel ( Figure 9-24) and press Enter. Figure 9-27 shows an example of the panel that is displayed.
Figure 9-27 VTAM Display of DLUS Status
Displaying Details about the SNASw Link
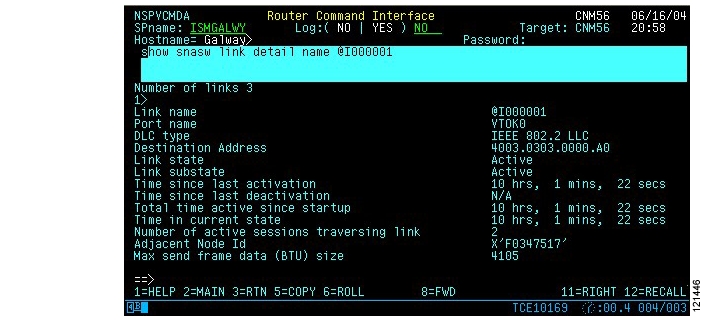
To display details about the SNASw link, place the cursor on the Link Name line on the SNA Switch PU Details for PUname Panel ( Figure 9-24) and press Enter. The Router Command Interface Panel is displayed with the results of the show snasw link detail command. Figure 9-28 shows an example of the panel.
Figure 9-28 Router Command Interface Panel with show snasw link detail
Displaying Details about the SNASw Port
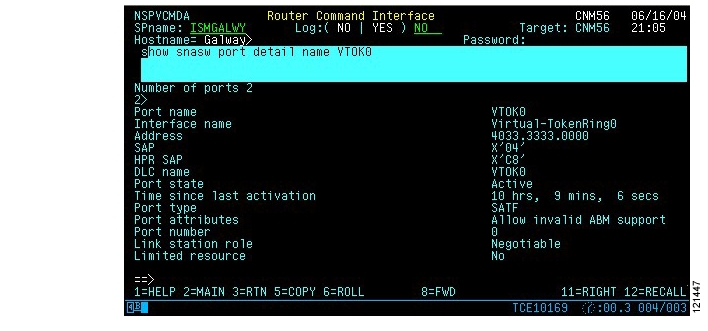
To display details about the SNASw port, place the cursor on the Port Name line on the SNA Switch PU Details for PUname Panel ( Figure 9-24) and press Enter. The Router Command Interface Panel is displayed with the results of the show snasw port detail command. Figure 9-29 shows an example of the panel.
Figure 9-29 Router Command Interface Panel with show snasw port detail
Displaying Details about the Router Interface
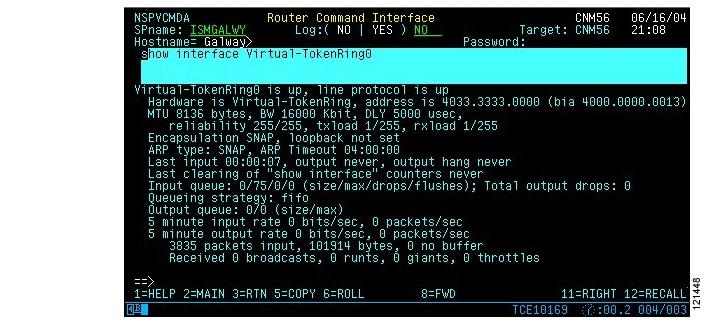
To display details about the router interface that supports the SNASw port, place the cursor on the Interface line on the SNA Switch PU Details for PUname Panel ( Figure 9-24) and press Enter. The Router Command Interface Panel is displayed with the results of the show interface command. Figure 9-30 shows an example of the panel.
Figure 9-30 Router Command Interface Panel with show interface
Monitoring SNA Switching Operations Using the Standard Interface
You can monitor SNA Switch server operations from the ISM main menu ( Figure 9-1). This section describes the following tasks:
•
•
•
To begin a monitoring session, use the following procedure:
Step 1
Figure 9-31 SNA Switch Monitoring Operations Panel
The SNA Switch Monitoring Operations panel provides the following options:
Displaying Information about a Node
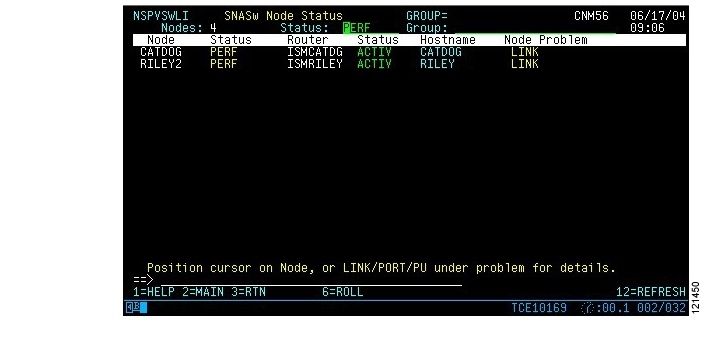
Figure 9-32 shows sample output for the List by Status option.
Figure 9-32 SNASw Node Status
Position the cursor on the Node or Router to display the ISM SNASW Operation Options panel ( Figure 9-7) to display details about the SNA Switch server.
Position the cursor on one of the fields under Node Problem and press Enter to display the Router Command Interface panel with details about the problem ( Figure 9-28 or Figure 9-29).
Displaying Information about SNA Switch Links
To display SNA Switch links, use the Links By Router, Links By adjacent CP name, or Links By Network Name options on the SNA Switch Monitoring Operations Panel ( Figure 9-31). Figure 9-33 shows an example of the Link / CPnode Status panel that is displayed.
Figure 9-33 Link / CPnode Status Panel
The Link / CPnode Status panel contains the following fields:
To display details about a link, place the cursor on the line and press Enter. The ISM SNASW Link Options Menu Panel ( Figure 9-17) is displayed.
Displaying Physical Units Served by SNA Switch
To display Physical Units, PUs, served by SNA Switch, use the PUS By Router or PUS by adjacent CP name options on the SNA Switch Monitoring Operations Panel (Figure 9-32). Either the SNA Switch PU List Filtering panel (Figure 9-35) or the SNA Switch Downstream PU Status panel () is displayed. The SNA Switch PU List Filtering panel is displayed if there are more PUs than will display on one panel, ( Figure 9-17).
Figure 9-34 SNA Switch PU List Filtering Panel
If you specify a filter, only those PUs whose names contain the character string are displayed. For example, if you enter ABC, PUs name ABC, QABC, and ZABC9 would be displayed. If you do not enter a filter, all PUs are displayed. Figure 9-35 shows an example of the SNA Switch Downstream PU Status panel that is displayed.
Figure 9-35 SNA Switch Downstream PU Status Panel
To display details about a PU, place the cursor on the line containing the PU and press Enter. The SNA Switch PU Details for PUname Panel ( Figure 9-24) is displayed. To filter the list of PUs, press PF11 and the SNA Switch PU List Filtering Panel ( Figure 9-34) is displayed. To update the list of PUs and their status, press PF12
![]()
![]()
![]()
![]()
![]()
![]()
![]()
![]()
Posted: Wed Oct 13 00:55:41 PDT 2004
All contents are Copyright © 1992--2004 Cisco Systems, Inc. All rights reserved.
Important Notices and Privacy Statement.