cc/td/doc/product/ong/15327/r34userd
hometocprevnextglossaryfeedbacksearchhelp
PDF

Table Of Contents

Monitor Performance

Before You Begin

NTP-B73 Enable Performance Monitoring

DLP-B121 Enable Pointer Justification Count Performance Monitoring

DLP-B122 Enable Intermediate-Path Performance Monitoring

NTP-B195 Monitor Electrical or Optical Performance

DLP-B123 View Electrical PM Parameters

DLP-B261 Refresh PM Counts for a Different Port

DLP-B124 Refresh Electrical or Optical PM Counts at Fifteen-Minute Intervals

DLP-B318 Refresh Electrical or Optical PM Counts at One-Day Intervals

DLP-B126 Monitor Near-End PM Counts

DLP-B127 Monitor Far-End PM Counts

DLP-B129 Reset Current PM Counts

DLP-B130 Clear Selected PM Counts

DLP-B260 Set Auto-Refresh Interval for Displayed PM Counts

DLP-B317 View Optical OC-N PM Parameters

DLP-B319 Monitor PM Counts for Selected Signal Types

NTP-B198 Monitor Ethernet Performance

DLP-B256 View Ethernet Statistics PM Parameters

DLP-B257 View Ethernet Utilization PM Parameters

DLP-B259 Refresh Ethernet PM Counts at a Different Time Interval

DLP-B258 View Ethernet History PM Parameters


Monitor Performance


Performance monitoring (PM) parameters are used by service providers to gather, store, threshold, and report performance data for early detection of problems. For more PM information, details, and definitions refer to the Cisco ONS 15327 Reference Manual. This chapter explains how to enable and view performance monitoring statistics for the Cisco ONS 15327.

Before You Begin

Before performing any of the following procedures, investigate all alarms and clear any trouble conditions. Refer to the Cisco ONS 15327 Troubleshooting Guide as necessary.

This section lists the chapter procedures (NTPs). Turn to a procedure for applicable tasks (DLPs).

1. 73 Enable Performance Monitoring—Complete as needed.

2. 195 Monitor Electrical or Optical Performance—Complete as needed.

3. 198 Monitor Ethernet Performance—Complete as needed.


Note For additional information regarding PM parameters, refer to the Digital transmission surveillance section in Telcordia's GR-1230-CORE, GR-820-CORE, GR-499-CORE, and GR-253-CORE documents, and in the ANSI document entitled Digital Hierarchy - Layer 1 In-Service Digital Transmission Performance Monitoring.


NTP-B73 Enable Performance Monitoring

Purpose

This procedure describes how to enable performance monitoring.

Tools/Equipment

None

Prerequisite Procedures

None

Required/As Needed

As Needed

Onsite/Remote

Onsite or remote

Security Level

Provisioning or higher


Step 1 Complete the "DLP-B60 Log into CTC" task at the node you want to monitor. If you are already logged in, continue with Step 2.

Step 2 Complete the "DLP-B121 Enable Pointer Justification Count Performance Monitoring" task if you need to monitor clock synchronization.

Step 3 Complete the "DLP-B122 Enable Intermediate-Path Performance Monitoring" task if you need to monitor large amounts of STS traffic through intermediate nodes.

Stop. You have completed this procedure.


DLP-B121 Enable Pointer Justification Count Performance Monitoring

Purpose

This task enables pointer justification counts, which provide a way to align the phase variations in STS and VT payloads and to monitor the clock synchronization between nodes. A consistent, large pointer justification count indicates clock synchronization problems between nodes.

Tools/Equipment

None

Prerequisite Procedures

60 Log into CTC

Required/As Needed

As needed

Onsite/Remote

Onsite or remote

Security Level

Provisioning or higher


Step 1 In node view, double-click the card where the line terminates (drops), called a line-terminating equipment (LTE) card. The card view appears.

Table 7-1 lists the Cisco ONS 15327 LTE cards.

Table 7-1 Traffic Cards that Terminate the Line (LTEs) 

Line Terminating Equipment

XTC-14

XTC-28-3

OC3 IR 1310

OC12 IR 1310

OC12 LR 1550

OC48 IR 1310

OC48 LR 1550


Step 2 Click the Provisioning > Line tabs.

Step 3 Click the PJStsMon# menu and make a selection based on the following rules.

The default value Off means pointer justification monitoring is disabled.

The values 1 to N are the number of STSs on the port. One STS per port can be enabled from the PJStsMon# card menu.

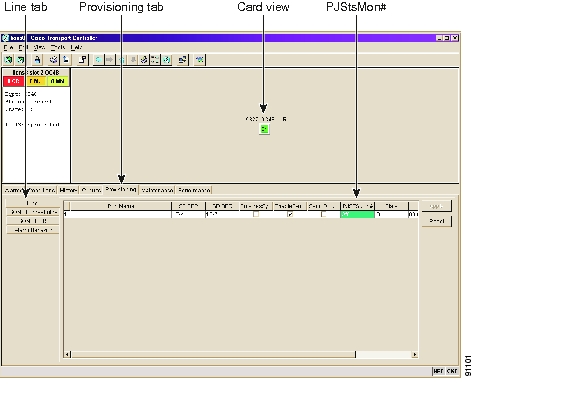
Figure 7-1 shows the PJStsMon# menu on the Provisioning window.

Figure 7-1 Line Tab for Enabling Pointer Justification Count Parameters

Step 4 In the State field, confirm that the port is in service (IS).

Step 5 If the port is IS, click Apply and go to Step 7.

Step 6 If the port is out of service (OOS, OOS_MT, OOS_AINS), select IS in the State field and click Apply.

Step 7 Click the Performance tab to view PM parameters. Figure 7-2 shows pointer justification counts. Refer to the Cisco ONS 15327 Reference Manual for more PM information, details, and definitions.


Note On CTC, the count fields for PPJC and NPJC PM parameters appear white and blank unless they are enabled on the Provisioning > Line tabs.


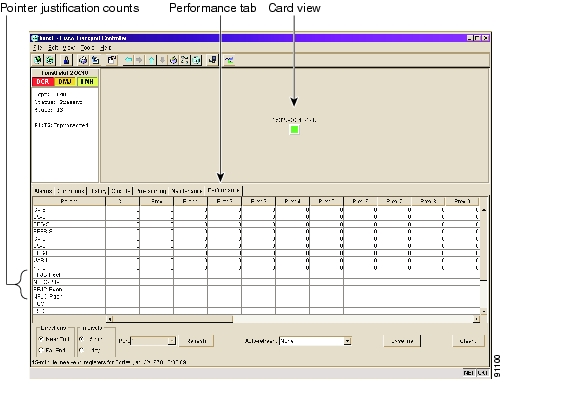
Figure 7-2 Viewing Pointer Justification Counts

Step 8 Return to your originating procedure (NTP).


DLP-B122 Enable Intermediate-Path Performance Monitoring

Purpose

This task enables intermediate-path performance monitoring, which allows you to monitor large amounts of STS traffic through intermediate nodes.

Tools/Equipment

None

Prerequisite Procedures

60 Log into CTC

Required/As Needed

As needed

Onsite/Remote

Onsite or remote

Security Level

Provisioning or higher


Note The monitored IPPM parameters are STS CV-P, STS ES-P, STS SES-P, STS UAS-P, and STS FC-P. For more information about IPPM parameters, refer to the Cisco ONS 15327 Reference Manual.


Step 1 In node view, double-click the LTE card you want to monitor. The card view appears.

See Table 7-1 for a list of Cisco ONS 15327 LTE cards.

Step 2 Click the Provisioning tab.

Step 3 Click the SONET STS tab. Figure 7-3 shows the SONET STS tab on the Provisioning window.

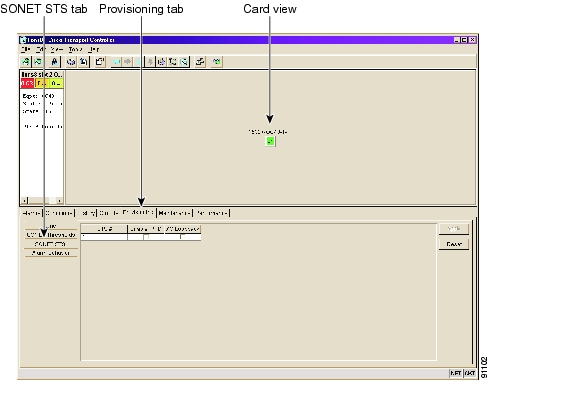
Figure 7-3 SONET STS Tab for Enabling IPPM

Step 4 Check the check box in the Enable IPPM column for the STS you want to monitor.

Step 5 Click Apply button.

Step 6 Click the Performance tab to view PM parameters. For IPPM parameter definitions, refer to the Cisco ONS 15327 Reference Manual.

Step 7 Return to your originating procedure (NTP).


NTP-B195 Monitor Electrical or Optical Performance

Purpose

The Performance Monitoring window allows you to view node near-end or far-end performance on a selected card and port at specified time intervals to detect possible performance problems.

Tools/Equipment

None

Prerequisite Procedures

Before you monitor performance, be sure you have created the appropriate circuits and provisioned the card according to your specifications. For more information, see "Create Circuits and VT Tunnels" and "Change Port Settings."

Required/As Needed

As needed

Onsite/Remote

Onsite

Security Level

Retrieve or higher


Step 1 Complete the "DLP-B60 Log into CTC" task at the node you want to monitor. If you are already logged in, continue to Step 2.

Step 2 Complete the "DLP-B123 View Electrical PM Parameters" task as needed.

Step 3 As needed, use the following tasks to change the display of electrical PM counts:

261 Refresh PM Counts for a Different Port

124 Refresh Electrical or Optical PM Counts at Fifteen-Minute Intervals

318 Refresh Electrical or Optical PM Counts at One-Day Intervals

126 Monitor Near-End PM Counts

127 Monitor Far-End PM Counts

129 Reset Current PM Counts

130 Clear Selected PM Counts

260 Set Auto-Refresh Interval for Displayed PM Counts

Step 4 Complete the "DLP-B317 View Optical OC-N PM Parameters" task as needed.

Step 5 As needed, use the following tasks to change the display of optical PM counts:

261 Refresh PM Counts for a Different Port

124 Refresh Electrical or Optical PM Counts at Fifteen-Minute Intervals

318 Refresh Electrical or Optical PM Counts at One-Day Intervals

126 Monitor Near-End PM Counts

127 Monitor Far-End PM Counts

319 Monitor PM Counts for Selected Signal Types

129 Reset Current PM Counts

130 Clear Selected PM Counts

260 Set Auto-Refresh Interval for Displayed PM Counts

Stop. You have completed this procedure.


DLP-B123 View Electrical PM Parameters

Purpose

This task enables you to view DS-1 or DS-3 PM counts on a selected XTC card to detect possible performance problems.

Tools/Equipment

None

Prerequisite Procedures

60 Log into CTC

Required/As Needed

As needed

Onsite/Remote

Onsite or remote

Security Level

Retrieve or higher


Step 1 In node view, double-click an XTC card. The card view appears.

Step 2 Click the Performance tab ( Figure 7-4).

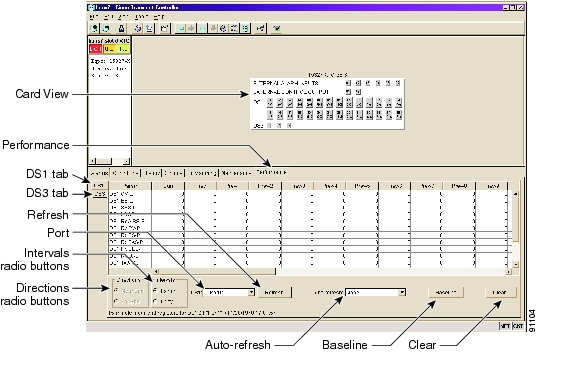
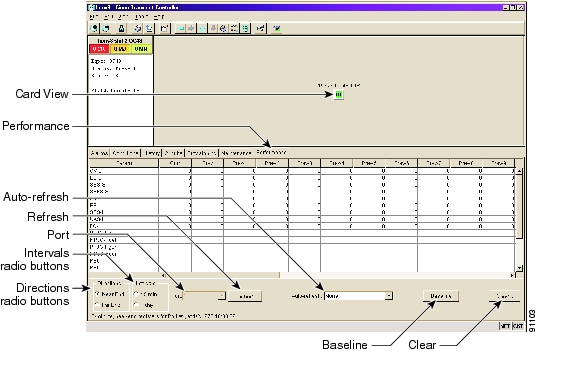
Figure 7-4 Viewing Electrical Performance Monitoring Information

Step 3 Click the DS1 or DS3 tab to view the desired PM parameters.

The PM parameter names appear on the left portion of the window in the Param column. The PM values appear on the right portion of the window in the Curr (current), and Prev-n (previous) columns. For PM parameter definitions, refer to the Cisco ONS 15327 Reference Manual.

Step 4 Return to your originating procedure (NTP).


DLP-B261 Refresh PM Counts for a Different Port

Purpose

This task changes the window view to display PM counts for another port on a multiport card.

Tools/Equipment

None

Prerequisite Procedures

60 Log into CTC

Required/As Needed

As needed

Onsite/Remote

Onsite or remote

Security Level

Retrieve or higher


Step 1 In node view, double-click an XTC card (for electrical PM counts) or OC-N card. The card view appears.

Step 2 Click the Performance tab.

Step 3 From the Port drop-down menu choose the desired port to highlight your selection.

Step 4 Click the Refresh button. The PM counts for the newly selected port appear.

Step 5 Return to your originating procedure (NTP).


DLP-B124 Refresh Electrical or Optical PM Counts at Fifteen-Minute Intervals

Purpose

This task changes the window view to display PM counts in 15-minute intervals.

Tools/Equipment

None

Prerequisite Procedures

60 Log into CTC

Required/As Needed

As needed

Onsite/Remote

Onsite or remote

Security Level

Retrieve or higher


Step 1 In node view, double-click an XTC card (for electrical PM counts) or OC-N card. The card view appears.

Step 2 Click the Performance tab.

Step 3 Click the 15 min radio button.

Step 4 Click the Refresh button. Performance monitoring parameters appear in 15-minute intervals synchronized with the time of day.

Step 5 View the Curr column to find PM counts for the current 15-minute interval.

Each monitored performance parameter has corresponding threshold values for the current time period. If the value of the counter exceeds the threshold value for a particular 15-minute interval, a threshold crossing alert (TCA) is raised. The PM number represents the counter value for each specific performance monitoring parameter.

Step 6 View the Prev-n columns to find PM counts for the previous 15-minute intervals.


Note If a complete 15-minute interval count is not possible, the value appears with a yellow background. An incomplete or incorrect count can be caused by monitoring for less than 15 minutes after the counter started, changing node timing settings, changing the time zone settings, replacing a card, resetting a card, or by changing port states. When the problem is corrected, the subsequent 15-minute interval appears with a white background.


Step 7 Return to your originating procedure (NTP).


DLP-B318 Refresh Electrical or Optical PM Counts at One-Day Intervals

Purpose

This task changes the window to display PM parameters in 1-day intervals.

Tools/Equipment

None

Prerequisite Procedures

60 Log into CTC

Required/As Needed

As needed

Onsite/Remote

Onsite or remote

Security Level

Retrieve or higher


Step 1 In node view, double-click an XTC card (for electrical PM counts) or OC-N card. The card view appears.

Step 2 Click the Performance tab.

Step 3 Click the 1 day radio button.

Step 4 Click Refresh. Performance monitoring appears in 1-day intervals synchronized with the time of day.

Step 5 View the Curr column to find PM counts for the current 1-day interval.

Each monitored performance parameter has corresponding threshold values for the current time period. If the value of the counter exceeds the threshold value for a particular 1-day interval, a threshold crossing alert (TCA) is raised. The PM number represents the counter value for each performance monitoring parameter.

Step 6 View the Prev-n columns to find PM counts for the previous 1-day intervals.


Note If a complete count over a 1-day interval is not possible, the value appears with a yellow background. An incomplete or incorrect count can be caused by monitoring for less than 24 hours after the counter started, changing node timing settings, changing the time zone settings, replacing a card, resetting a card, or by changing port states. When the problem is corrected, the subsequent 1-day interval appears with a white background.


Step 7 Return to your originating procedure (NTP).


DLP-B126 Monitor Near-End PM Counts

Purpose

Use this task to view near-end PM counts for the selected card and port.

Tools/Equipment

None

Prerequisite Procedures

60 Log into CTC

Required/As Needed

As needed

Onsite/Remote

Onsite or remote

Security Level

Retrieve or higher


Step 1 In node view, double-click an XTC card (for electrical PM counts) or OC-N card. The card view appears.

Step 2 Click the Performance tab.

Step 3 Click the Near End radio button.

Step 4 Click the Refresh button. All PM parameters for the selected card on the incoming signal appear. For PM parameter definitions refer to the Cisco ONS 15327 Reference Manual.

Step 5 View the Curr column to find PM counts for the current time interval.

Step 6 View the Prev-n columns to find PM counts for the previous time intervals.

Step 7 Return to your originating procedure (NTP).


DLP-B127 Monitor Far-End PM Counts

Purpose

Use this task to view far-end PM parameters for the selected card and port.

Tools/Equipment

None

Prerequisite Procedures

60 Log into CTC

Required/As Needed

As needed

Onsite/Remote

Onsite or remote

Security Level

Retrieve or higher


Step 1 In node view, double-click an XTC card (for electrical PM counts) or OC-N card. The card view appears.

Step 2 Click the Performance tab.

Step 3 Click the Far End radio button.


Note Only cards that allow far-end performance monitoring have this button as an option.


Step 4 Click the Refresh button. All PM parameters recorded by the far-end node for the selected card on the outgoing signal appear. For PM parameter definitions refer to the Cisco ONS 15327 Reference Manual.

Step 5 View the Curr column to find PM counts for the current time interval.

Step 6 View the Prev-n columns to find PM counts for the previous time intervals.

Step 7 Return to your originating procedure (NTP).


DLP-B129 Reset Current PM Counts

Purpose

This task uses the Baseline button to clear the PM count displayed in the current time interval, but it does not clear the cumulative PM count. This task allows you to see how quickly PM counts rise.

Tools/Equipment

None

Prerequisite Procedures

60 Log into CTC

Required/As Needed

As needed

Onsite/Remote

Onsite or remote

Security Level

Retrieve or higher


Step 1 In node view, double-click an XTC card (for electrical PM counts), Ethernet card, or OC-N card. The card view appears.

Step 2 Click the Performance tab.

Step 3 Click Baseline.


Note The Baseline button clears the PM counts displayed in the current time interval, but does not clear the PM counts on the card. When the current time interval expires or the window view changes, the total number of PM counts on the card and in the window appear in the appropriate column. The baseline values are discarded if you change views to a different window and then return to the Performance Monitoring window.


Step 4 View the current statistics column(s) to observe changes to PM counts for the current time interval.

Step 5 Return to your originating procedure (NTP).


DLP-B130 Clear Selected PM Counts

Purpose

This task uses the Clear button to clear specified PM counts depending on the option selected.

Tools/Equipment

None

Prerequisite Procedures

60 Log into CTC

Required/As Needed

As needed

Onsite/Remote

Onsite or remote

Security Level

Retrieve or higher


Caution Pressing the Clear button can mask problems if used incorrectly. This button is commonly used for testing purposes.


Step 1 In node view, double-click an Ethernet card, XTC card (for electrical PM counts), or OC-N card. The card view appears.

Step 2 Click the Performance tab.

Step 3 Click Clear.

Step 4 From the Clear Statistics menu, choose one of three options:

Selected statistics: Clearing selected statistics erases from the card and the window display all PM counts associated with the current combination of statistics on the selected port. This means the selected time interval, direction, and signal type counts are erased from the card and the window display.

All statistics on port x: Clearing all statistics on port x erases from the card and the window display all PM counts associated with all combinations of the statistics on the selected port. This means all time intervals, directions, and signal type counts are erased from the card and the window display.

All statistics in current view: Clearing all statistics in the current view erases from the card and the window display all PM counts for all ports.

Step 5 From the Clear Statistics menu, click Yes to clear the selected statistics.

Step 6 View the displayed columns to verify that the selected PM counts have been cleared.

Step 7 Return to your originating procedure (NTP).


DLP-B260 Set Auto-Refresh Interval for Displayed PM Counts

Purpose

This task changes the window auto-refresh intervals for updating the displayed PM counts.

Tools/Equipment

None

Prerequisite Procedures

60 Log into CTC

Required/As Needed

As needed

Onsite/Remote

Onsite or remote

Security Level

Retrieve or higher


Step 1 In node view, double-click an Ethernet card, XTC card (for electrical PM counts), or OC-N card. The card view appears.

Step 2 Click the Performance tab.

Step 3 Click the Auto-refresh drop-down menu button.

Step 4 Choose one of six options:

None: This option disables the auto-refresh feature.

15 Seconds: This option sets the window auto-refresh to 15-second time intervals.

30 Seconds: This option sets the window auto-refresh to 30-second time intervals.

1 Minute: This option sets the window auto-refresh to 1-minute time intervals.

3 Minutes: This option sets the window auto-refresh to 3-minute time intervals.

5 Minutes: This option sets the window auto-refresh to 5-minute time intervals.

Step 5 Click the Refresh button. The PM counts for the newly-selected auto-refresh time interval appear.

Depending on the selected auto-refresh interval, the displayed PM counts automatically update when each refresh interval completes. If the auto-refresh interval is set to None, the displayed PM counts are not updated unless you click the Refresh button.

Step 6 Return to your originating procedure (NTP).


DLP-B317 View Optical OC-N PM Parameters

Purpose

This task enables you to view PM counts on a selected optical (OC-N) card and port to detect possible performance problems.

Tools/Equipment

None

Prerequisite Procedures

60 Log into CTC

Required/As Needed

As needed

Onsite/Remote

Onsite or remote

Security Level

Retrieve or higher


Step 1 In node view, double-click an OC-N card. The card view appears.

Step 2 Click the Performance tab ( Figure 7-4).

Figure 7-5 Viewing Optical Performance Monitoring Information

The PM parameter names appear on the left portion of the window in the Param column. The PM values appear on the right portion of the window in the Curr (current), and Prev-n (previous) columns. For PM parameter definitions, refer to the Cisco ONS 15327 Reference Manual.

Step 3 Return to your originating procedure (NTP).


DLP-B319 Monitor PM Counts for Selected Signal Types

Purpose

Use the signal-type menus to monitor near-end or far-end PM counts for specific signals on a selected card and port.

Tools/Equipment

None

Prerequisite Procedures

60 Log into CTC

Required/As Needed

As needed

Onsite/Remote

Onsite or remote

Security Level

Retrieve or higher


Step 1 In node view, double-click an XTC card (for electrical PM counts) or OC-N card. The card view appears.

Step 2 Click the Performance tab.


Note Different port and signal-type menus appear depending on the card type and the circuit type. The appropriate types (DS1, DS3, VT path, STS path, OC-N section and line) appear based on the card. For example, the OC-48 card lists the OC-48 port and STS path PM parameters as signal-types. You can select both the OC-48 port and the STS within the specified OC-48.


Step 3 Click the Port/Line drop-down menu button and highlight the desired port/line. (Options vary depending on the card.)

Step 4 Click the signal type drop-down menu button and highlight the desired signal. (Options vary depending on the card.)

Step 5 Click the Refresh button. All PM counts recorded by the near-end or far-end node appear for the specified outgoing signal type on the selected card and port. For PM parameter definitions, refer to the Cisco ONS 15327 Reference Manual.

Step 6 View the Curr column to find PM counts for the current time interval.

Step 7 View the Prev-n columns to find PM counts for the previous time intervals.

Step 8 Return to your originating procedure (NTP).


NTP-B198 Monitor Ethernet Performance

Purpose

This procedure allows you to view node transmit and receive performance on an Ethernet card and port at specified time intervals to detect possible performance problems.

Tools/Equipment

None

Prerequisite Procedures

Before you monitor performance, be sure you have created the appropriate circuits and provisioned the card according to your specifications. For more information, see "Create Circuits and VT Tunnels" and "Change Port Settings."

Required/As Needed

As needed

Onsite/Remote

Onsite

Security Level

Retrieve or higher


Step 1 Complete the "DLP-B60 Log into CTC" task at the node you want to monitor. If you are already logged in, continue with Step 2.

Step 2 Complete the "DLP-B256 View Ethernet Statistics PM Parameters" task as needed.

Step 3 As needed, use the following tasks to change the display of Ethernet statistical PM counts:

260 Set Auto-Refresh Interval for Displayed PM Counts

129 Reset Current PM Counts

130 Clear Selected PM Counts

Step 4 Complete the "DLP-B257 View Ethernet Utilization PM Parameters" task as needed.

Step 5 As needed, use the "DLP-B259 Refresh Ethernet PM Counts at a Different Time Interval" task to change the display of Ethernet utilization PM counts:

Step 6 Complete the "DLP-B258 View Ethernet History PM Parameters" task as needed.

Step 7 As needed, use the following tasks to change the display of Ethernet history PM counts:

261 Refresh PM Counts for a Different Port

259 Refresh Ethernet PM Counts at a Different Time Interval

Stop. You have completed this procedure.


DLP-B256 View Ethernet Statistics PM Parameters

Purpose

This task enables you to view current statistical PM counts on a selected E-Series or G-Series Ethernet card and port to detect possible performance problems.

Tools/Equipment

None

Prerequisite Procedures

60 Log into CTC

Required/As Needed

As needed

Onsite/Remote

Onsite or remote

Security Level

Retrieve or higher


Step 1 In node view, double-click an E-Series or G-Series Ethernet card. The card view appears.

Step 2 Click the Performance tab.

Step 3 Click the Statistics subtab ( Figure 7-6).

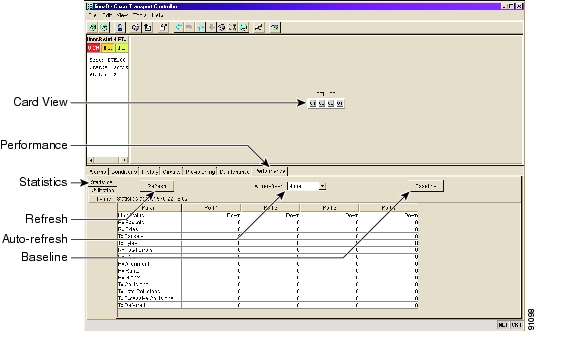
Figure 7-6 Statistics Window on the Card View Performance Tab

Step 4 Click the Refresh button. Performance monitoring statistics for each port on the card appear.

The PM parameter names appear on the left portion of the window in the Param column. The parameter numbers appear on the right portion of the window in the Port # columns. For PM parameter definitions refer to the Cisco ONS 15327 Reference Manual.

Step 5 View the Port # columns to see the current PM statistics for each port.

Step 6 Return to your originating procedure (NTP).


DLP-B257 View Ethernet Utilization PM Parameters

Purpose

This task enables you to view line utilization PM counts on a selected E-Series or G-Series Ethernet card and port to detect possible performance problems.

Tools/Equipment

None

Prerequisite Procedures

60 Log into CTC

Required/As Needed

As needed

Onsite/Remote

Onsite or remote

Security Level

Retrieve or higher


Step 1 In node view, double-click an E-Series or G-Series Ethernet card. The card view appears.

Step 2 Click the Performance tab.

Step 3 Click the Utilization subtab ( Figure 7-7).

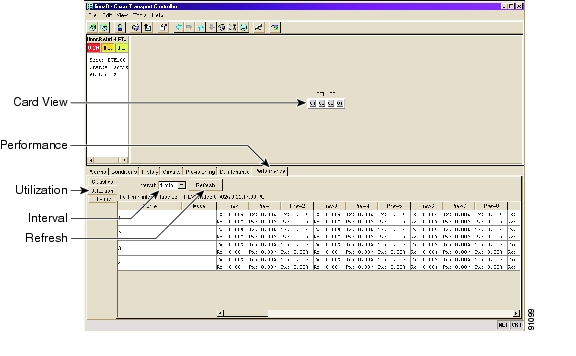
Figure 7-7 Utilization Window on the Card View Performance Tab

Step 4 Click the Refresh button. Performance monitoring utilization values for each port on the card appear.

Step 5 View the Port # column to find the port you want to monitor.

Step 6 View the Prev-n columns to find Tx and Rx bandwidth utilization values for the previous time intervals.

Step 7 Return to your originating procedure (NTP).


DLP-B259 Refresh Ethernet PM Counts at a Different Time Interval

Purpose

This task changes the window view to display specified PM counts in time intervals depending on the interval option selected.

Tools/Equipment

None

Prerequisite Procedures

60 Log into CTC

Required/As Needed

As needed

Onsite/Remote

Onsite or remote

Security Level

Retrieve or higher


Step 1 In node view, double-click an E-Series or G-Series Ethernet card. The card view appears.

Step 2 Click the Performance tab.

Step 3 Click the Utilization tab or the History tab.

Step 4 Click the Interval drop-down menu button.

Step 5 Choose one of four options:

1 min: This option displays the specified PM counts in one-minute time intervals.

15 min: This option displays the specified PM counts in fifteen-minute time intervals.

1 hour: This option displays the specified PM counts in one-hour time intervals.

1 day: This option displays the specified PM counts in one-day (24 hours) time intervals.

Step 6 Click the Refresh button. The PM counts refresh with values based on the chosen time interval.

Step 7 Return to your originating procedure (NTP).


DLP-B258 View Ethernet History PM Parameters

Purpose

This task enables you to view historical PM counts at selected time intervals on an E-Series or G-Series Ethernet card and port to detect possible performance problems.

Tools/Equipment

None

Prerequisite Procedures

60 Log into CTC

Required/As Needed

As needed

Onsite/Remote

Onsite or remote

Security Level

Retrieve or higher


Step 1 In node view, double-click an E-Series or G-Series Ethernet card. The card view appears.

Step 2 Click the Performance tab.

Step 3 Click the History subtab ( Figure 7-8).

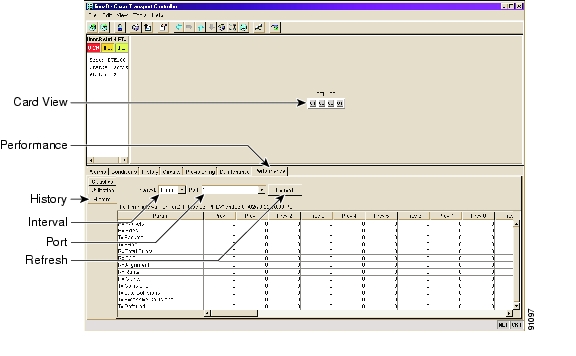
Figure 7-8 History Window on the Card View Performance Tab

Step 4 Click the Refresh button. Performance monitoring statistics for each port on the card appear.

The PM parameter names appear on the left portion of the window in the Param column. The parameter numbers appear on the right portion of the window in the Port # columns. For PM parameter definitions refer to the Cisco ONS 15327 Reference Manual.

Step 5 View the Port # columns to see the current PM statistics for each port.

Step 6 Return to your originating procedure (NTP).


hometocprevnextglossaryfeedbacksearchhelp

Posted: Mon Feb 25 06:29:03 PST 2008
All contents are Copyright © 1992--2008 Cisco Systems, Inc. All rights reserved.
Important Notices and Privacy Statement.