|
|

Table Of Contents
8.1.4 Criteria for Counting Valid-data
8.2.1 AboUt Rmon Measurements In Cisco Network Elements
8.2.3 Create RMON Event Monitor
8.2.4 Configure an RMON Event Monitor
8.2.5 Create RMON History Monitor(s)
Performance Management
8.1 Introduction
This chapter describes the presentation of Performance Management (PM) data as they occur on the network element. The PM data available on the network element:
•
G.826 performance data for the SDH paths and section termination points.
–
–
•
•
PM data can be monitored from the Management Tree. You can read the registered PM data on the network element, get it presented in performance management data tables. The file can be read, copied and/or edited in any tool, for instance MS Excel. It is possible to clear all PM data on the network element, see "Logs (Alarm Logs, Performance Data Logs)" on page -32.
8.1.1 Definitions
According to G.826 PM data, the following definitions are used:
•
–
•
–
•
–
•
–
This section describes:
8.1.2 Present G.826 PM data
G.826 PM data is available in the network elements under management.
8.1.2.1 Background
The network elements have limited memory for historical data storage, and the oldest data will be removed in favour of new, current data registered to the network element1 .
G.826 specifies the accumulated performance data for 15 minutes and 24 hours periods. The incomplete data for the current 15 minutes period is also available. This is updated continuously on the network element. PM data is stored in time series measurement periods (for instance such as the last 15 minutes and the last 24 hours period) on the network element.
From Management Tree, you can select G.826 PM data for the following managed objects:
•
Near End and Far End data apply to all managed object, except for the RS.
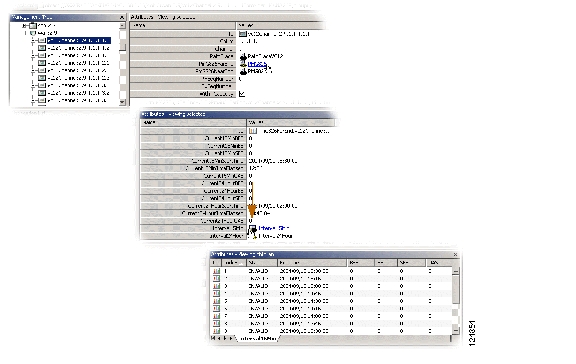
Figure 8-1 View PM - Example
With near end and far end data for all managed object except the RS. The managed objects have PM attributes as defined in the information model, Figure 8-1.
Available time periods are:
•
•
The system presents current data and historical data. The number of historical stored periods are:
•
•
See also "5.4.7 Monitoring PDH Port VC-n Performance" section on page 5-12 and "5.15.10 Monitoring WAN Port Performance" section on page 5-66.
8.1.3 View Counters
From the Management Tree you can view all managed objects that are monitored objects, for instance:
•
•
•
•
•
•
8.1.4 Criteria for Counting Valid-data
Criteria for PM counters: for disabled ports, there is no PM-counting (all BBE, ES, SES, UAS have value 0), valid-data flag not affected (data is set as valid if conditions mentioned below are fulfilled).
For Valid-data flag (used for previous 15-min/24-hour intervals) the following rules apply:
The flag will not be set for any 15-min period (for any levels) if 600 seconds (10 minutes) or less are counted (since counter-reset or device-reset).
•
•
•
•
•
In all other cases the valid-data flags are set to
•
•
•
•
•
•
8.2 Manage RMON
This section describes management of RMON (Remote Network Monitoring) within a network of Cisco network elements.
RMON is an IETF standard (RFC 2819) for monitoring the status of a network by activating probes/monitors at targeted ports in the network, and using RMON clients to collect and present the status information.
8.2.1 AboUt Rmon Measurements In Cisco Network Elements
With Cisco RMON Management, the user can set up local monitoring devices (probes) at selected locations in the managed network. The RMON monitors perform data acquisition and local storage.
An RMON monitor can be set up to accumulate information (perform diagnostics and collect statistics) in local PM buffer, and to log PM associated events or to generate RMON traps to the management system. To collect information, the management system can either poll the monitors regularly or be notified by monitor notifications (SNMP traps), triggered by exception conditions.
8.2.2 RMON Overview
Manage time series measurements on local area networks (LANs) and interconnecting E1/E3 lines from a central site with RMON. RMON uses monitoring probes to acquire and store measurements. Remote monitoring according to RMON needs management, and has to be set up specifically.
With RMON management you create RMON monitors, configuring measurement sessions, alarm conditions, logging and alarm generation, and acquire RMON data views.
•
•
•
•
•
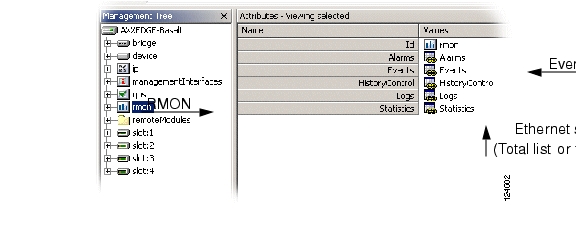
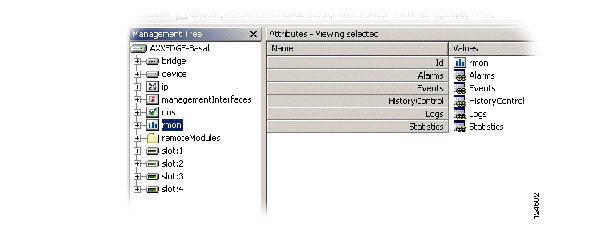
Figure 8-2 RMON - GUI overview
The following sub- sections explain how to create, configure and inspect RMON monitor(s):
•
•
8.2.3 Create RMON Event Monitor
This section describes how to create an RMON Event Monitor as follows:
•
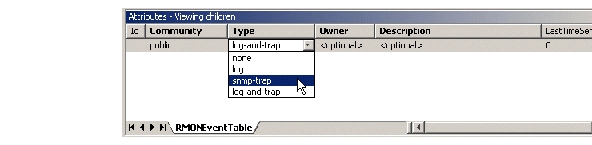
8.2.3.1 Define RMON Event Types
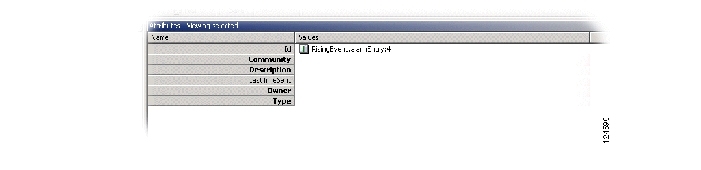
Set RMON event types prior to configuring RMON Event Monitors. Events are defined as entries in the RMON Event Table. You can choose between the following alternatives:
•
•
•
(as illustrated in the following sections)
Step 1
Step 2
Step 3
Figure 8-3
RMON Events-GUI example
Step 4
Step 5
Step 6
Step 7
Note
8.2.4 Configure an RMON Event Monitor
You configure RMON Event Monitor by defining the conditions for event generation from RMON Alarms. If editing an existing monitor, you select the desired table entry.
8.2.4.1 Define A Monitor Source
Step 1
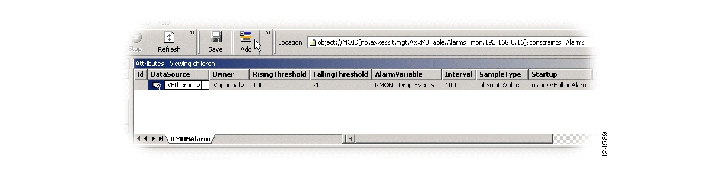
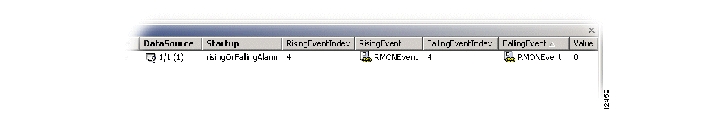
Figure 8-4 Select RMON Alarms
Step 2
Figure 8-5 Add Monitor Entry
Step 3
Step 4
Step 5
Define detection criteria
Step 6
Step 7
Step 8
This attribute defines the initial behavior of the monitor:
Alarms are generated if the monitor is in an alarm situation (below falling threshold or above rising threshold) at startup.Alarm Rising Threshold (integer - number of occurrences).
The monitor triggers an event when the counter value rises above this level.Alarm Falling Threshold (integer - number of occurrences).
The monitor triggers an event when the counter value sinks below this level.Rising Event cross-reference.
A cross reference to the Event Table that identifies the event that is triggered when the monitor registers a rising threshold violation.Falling Event cross-reference.
A cross reference to the Event Table that identifies the event that is triggered when the monitor registers a falling threshold violation.Step 9
The network elements RMON monitor can start generating alarm events for selected ethernet interface.
8.2.5 Create RMON History Monitor(s)
Sampling interval is as defined by the user. Sampling duration is as granted by the network element. Each sample contains the full set of RMON counter data associated with the data source.
An RMON historical monitor maintains both a 'current' and a 'historical' list of statistical data. History Statistics contains the periodical samples from one specific Ethernet interface instance.
Step 1
Figure 8-6
RMON History Monitor- example
Step 2
Step 3
Step 4
Poll interval in seconds, or poll duration as number of polls in BucketRequestedCount.Step 5
The network element starts monitoring historical data.Step 6
Note
8.3 View RMON Data
RMON data is available for inspection in several RMON tables within the network element:
•
•
•
See "View logged events" on page -10.•
You can manage several RMON Monitors in the network element at any time.
8.3.1 View Statistical Data
This section describes the following:
•
•
Presented RMON data can be printed to file.
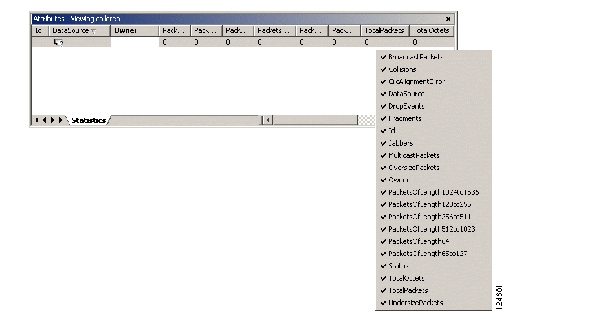
8.3.1.1 Inspection Of Current Statistical Data
Step 1
Step 2
Figure 8-7
RMON Statistics- GUI overview
The current statistical information of all monitored interfaces for all monitored ports will be presented.
Step 3
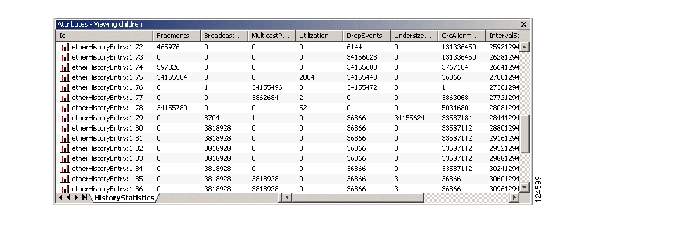
8.3.1.2 Inspection of History Statistics Per Port
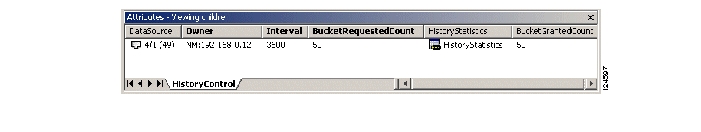
Step 1
Figure 8-8
Select History Control
Step 2
Step 3
Figure 8-9
RMON History statistics - example
8.3.2 View logged events
How to view logged events:
8.3.2.1 Inspection of the Event Log
If the event monitor is configured to log events locally, you can inspect this in the RMON Logs.
Step 1
All events logged by all monitors within the selected network node will be presented.
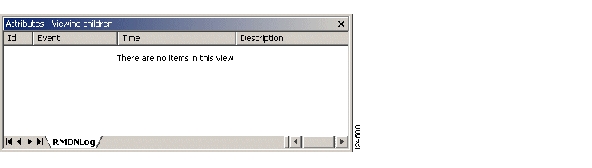
Figure 8-10
RMON Logs-view
8.3.2.2 Inspection of the Event Log
Inspect events filtered for a specific LAN/ WAN port.
Step 1
Step 2
Figure 8-11
Alarm monitor- example
A filtered table view of the Event Log will be presented, containing all events associated by the selected monitor. All logged events are presented with timestamp and description fields.
Figure 8-12
RMON Event log to alarm monitor-view
8.3.2.3 Delete RMON Monitor
Step 1
Step 2
RMON monitor (and any RMON event definitions) is removed in from the network element.
RMON data presentation is closed on your desktop. When deleting RMON monitors, the associated log table entries (History Statistics, Event Log entries) are removed automatically.
1 Time periods and interval may vary between the different network element types.
![]()
![]()
![]()
![]()
![]()
![]()
![]()
![]()
Posted: Fri Sep 14 12:40:25 PDT 2007
All contents are Copyright © 1992--2007 Cisco Systems, Inc. All rights reserved.
Important Notices and Privacy Statement.