|
|

Table Of Contents
3.1.5 Navigate in Tables Using the Keyboard
3.3.1 Subscribe Cisco Edge Craft to Alarms
3.3.3 View the Events Reported from the Network Element
3.3.4 Alarm and Event Notification
Using Cisco Edge Craft
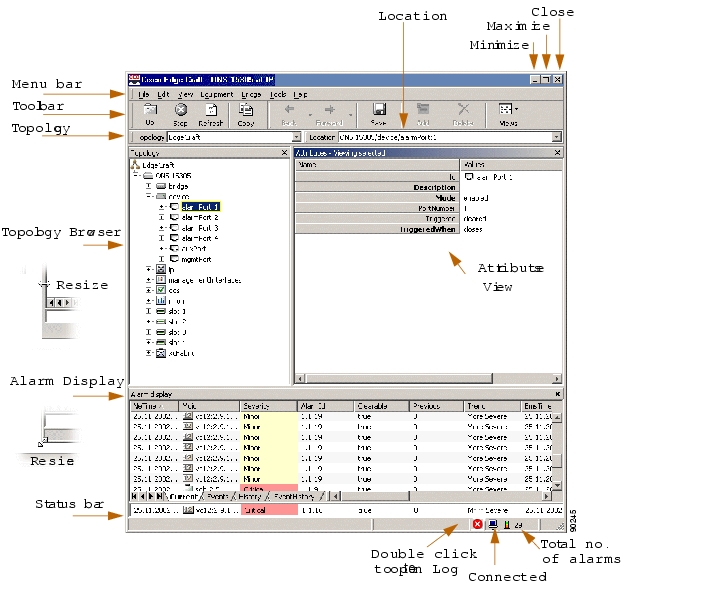
The graphical user interface of Cisco Edge Craft is built on the Cisco GUI framework and is delivered pre-customized to show a network element topology browser, attributes, and an alarm list.
The alarm list displays all alarms, events and notifications that occur while Cisco Edge Craft is connected to the network element.
3.1 Cisco Edge Craft Desktop
Figure 3-1 givens an overview of the Cisco Edge Craft desktop with explanation of the functionality.
The status bar will display a description of selected toolbar buttons or menu items.
Figure 3-1 Cisco Edge Craft Desktop
3.1.1 Toolbar Buttons
Figure 3-2 to Figure 3-11 show the functionality of the toolbar icons available in the Cisco Edge Craft.
Figure 3-2 Up Icon
This icon moves the topology up one level.
Figure 3-3 Stop Icon
This icon stops the current operation.
Figure 3-4 Refresh Icon
This icon refreshs the active view.
Figure 3-5 Copy I con
This icon copies selected rows to the system clipboard.
Figure 3-6 Forward Icon
This icon moves the view forward in the Attributes Viewer.
Figure 3-7 Backward Icon
This icon moves the view backward in Attributes Viewer.
Figure 3-8 Save Icon
This icon saves the content of the Attributes View on the equipment.
Figure 3-9 Add Icon
This icon adds a new row to the Attributes Viewer.
Figure 3-10 Delete Icon
This icon deletes selected items.
Figure 3-11 Cell Mode Icon
By default, entire rows are selected in the table, but single cells can easily be selected using the cell-mode toggle button.
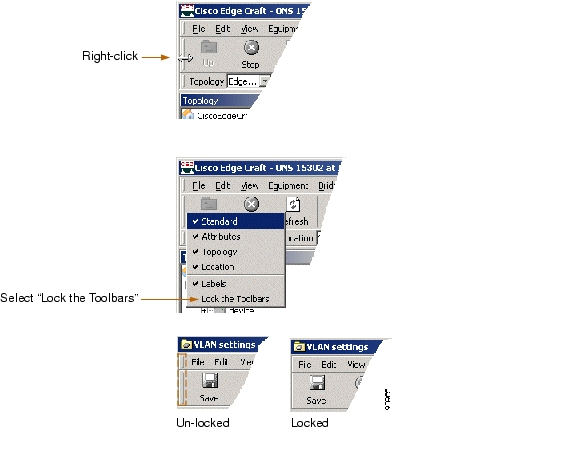
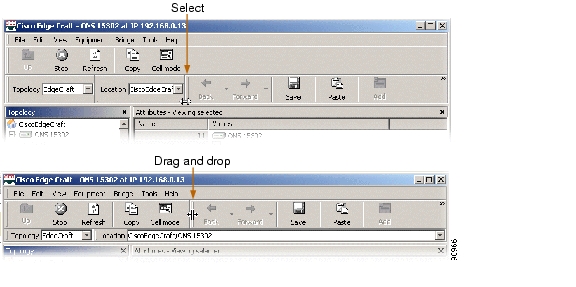
Figure 3-12 and Figure 3-13 show how to lock and move toolbars.
Figure 3-12 Lock Toolbars
Figure 3-13 Move Toolbars
3.1.2 Menu Items
3.1.2.1 File
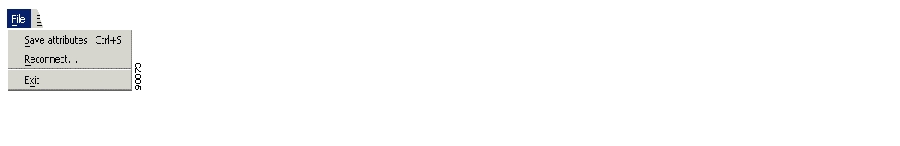
Figure 3-14 and Table 3-1 show and describe the File menu.
Figure 3-14 File Pull-Down Menu
Table 3-1 File Menu
Save
Save contents.
Reconnect
Reconnect to equipment.
Exit
Exit Cisco Edge Craft.
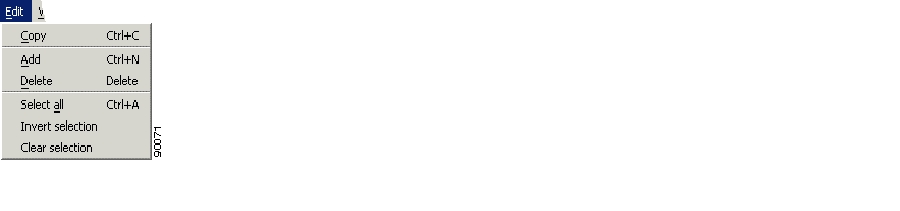
3.1.2.2 Edit
Figure 3-15 and Table 3-2 show and describe the Edit menu.
Figure 3-15 Edit Pull-Down Menu
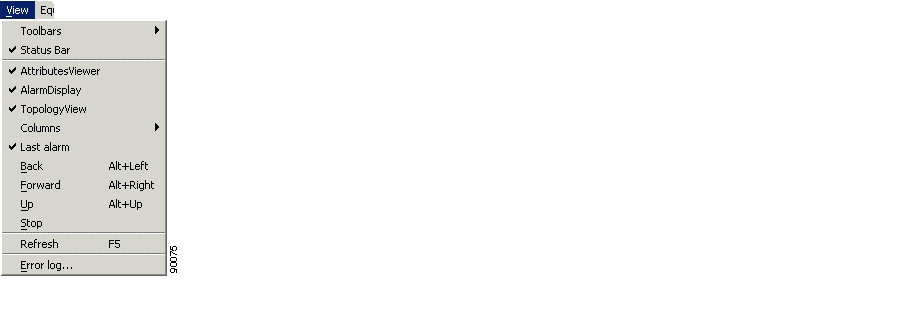
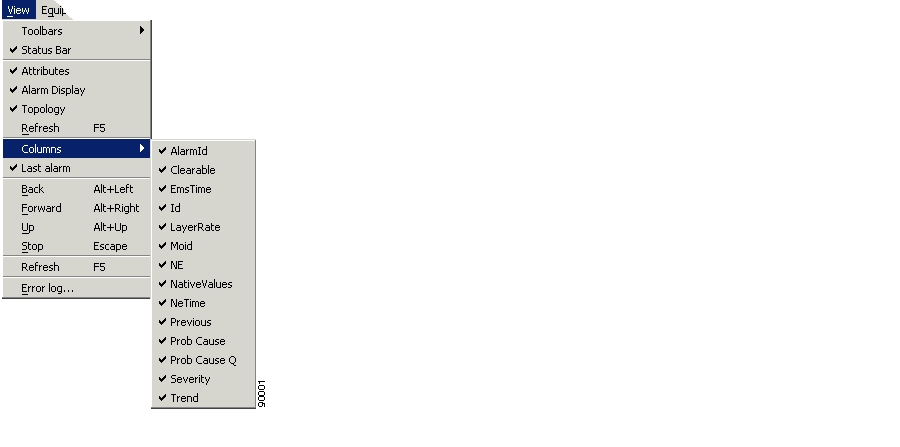
3.1.2.3 View
Figure 3-16 and Table 3-3 show and describe the View menu.
Figure 3-16 View Pull-Down Menu
Table 3-3 ViewMenu
Toolbars
Standard: Check to make standard toolbar active.
Attributes: Check to make attributes toolbar active.
Labels: Check to make labels visible on tool buttons.
Status bar
Check to make status bar visible in the bottom of Cisco Edge Craft desktop.
Alarm Display
Check to make alarm display an active application on the desktop.
Topology View
This option makes the topology view an active application on the desktop.
Attributes
This option makes the attributes viewer an active application on the desktop.
Columns
This option toggles visible columns in the alarm display.See the "Visible Columns" section.
Last Alarm
This option allows the user to view the last alarm in a separate window in the alarm display.
Back
This option moves CEC back.
Forward
This option moves CEC forward.
Up
This option moves CEC up one level.
Stop
This option stops current operation.
Refresh
This option refreshes the active view.
Error Log
This option opens an error log.
The log is also available from the status bar.
These symbols indicates severity in the staus bar; if the log contains messages see Figure 3-22 to Figure 3-25.
Double-click the current symbol to view the log.
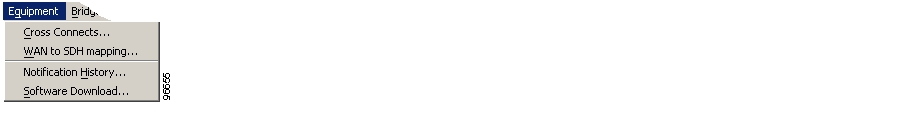
3.1.2.4 Equipment
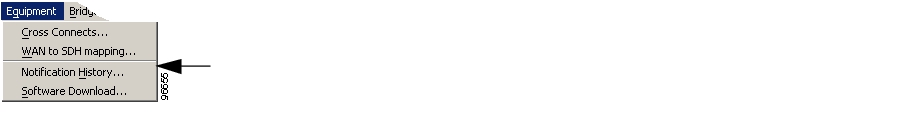
Figure 3-17 and Table 3-4 show and describe the Equipment menu.
Figure 3-17 Equipment Pull-Down Menu
Table 3-4 Equipment Menu
Cross Connect
This option opens the cross-connect.
See the "5.7 ONS 15305 SDH Layer Network and Cross-Connections" section on page 5-33 for details.
WAN to SDH mapping
This option opens the WAN to SDH mapping.
See the "5.5.2 Add Initial WAN Port Capacity" section on page 5-16 for details.
Notification History
This option opens the Notification History.
See the "History" section.
3.1.2.5 Bridge
Figure 3-18 and Table 3-5 show and describe the Bridge menu.
Figure 3-18 Bridge Pull-Down menu
Table 3-5 Bridge Menu
VLAN Settings
This option opens the VLAN Settings.
See the "7.7 VLAN Provisioning" section on page 7-11 for details on VLAN Settings.
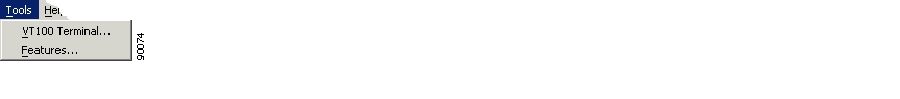
3.1.2.6 Tools
Figure 3-19 and Table 3-6 show and describe the Tools menu.
Figure 3-19 Tools Pull-Down Menu
Table 3-6 Tools Menu
VT 100 Terminal
This option launches the VT100 terminal (if configured).
See the "1.5 Configure the VT100 Terminal" section on page 1-9 for details.Text Editor
This option opens the Text Editor.
3.1.2.7 Help
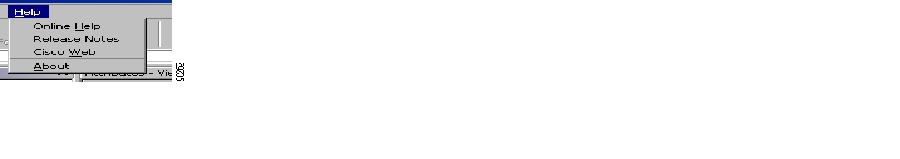
Figure 3-20 and Table 3-7 show and describe the Help menu.
Figure 3-20 Help Pull-Down Menu
Table 3-7 Help Menu
Online Help
This option launches the Cisco Edge Craft User Guide online.
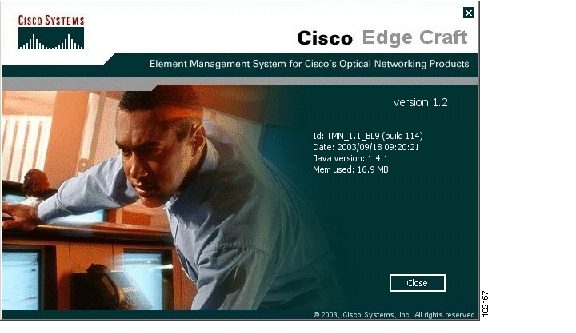
About
This option launches information about the Cisco Edge Craft software ( Figure 3-21).
Figure 3-21 The About Dialog Box
3.1.2.8 Log Viewer
Figure 3-22 and Figure 3-26 show the log viewer icons.
These symbols indicates severity in the status bar if the log contains messages:
Figure 3-22 Error Icon
This icon indicates that an error message is present.
Figure 3-23 Warning Icon
This icon indicates that a warning message is present.
Figure 3-24 Info Icon
This icon indicates that information is available.
Figure 3-25 Unmapped Severity Icon
This icon indicates that unmapped severity information is available.
Figure 3-26 Note Icon
If this icon occurs, additional information is available.
Step 1
Double-click the current symbol to view the log.
Messages marked with the note icon contain additional information.
Step 2
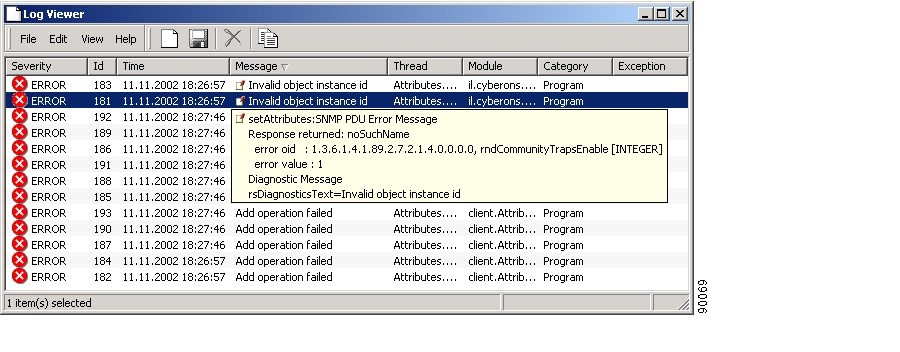
Figure 3-27 and Figure 3-28 show the log viewer function.
Figure 3-27 Log Viewer
The Tool tip shows the entire value if it does not fit inside the cell.
Figure 3-28 Log Viewer Tool tip
:
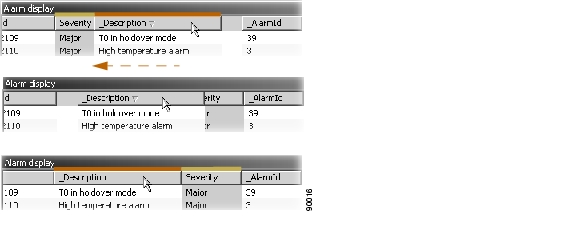
3.1.3 Copy and Paste
All Cisco Edge Craft applications supporting table entry editing have a copy and paste feature. When pasting, Cisco Edge Craft will verify that selected columns have the same data type as the copied cells. If not, you can copy the data based on the column names. Only editable columns with the same name and datatype will be pasted. This enables copying and pasting between tables with the same data but with a different column order ( Figure 3-29).
Figure 3-29 Example Copy and Paste
:
3.1.4 Cell Selection Mode
By default, entire rows are selected in a table, but single cells can easily be selected using the cell-mode toggle button ( Figure 3-11).
The feature enables you to copy one table cell, select the entire column, press Paste, and thus copy the value into all selected cells. Copy and paste of ranges is also supported, meaning you can copy values A and B and paste them into a large range to get the A and B values repeated throughout the range.
Copy and paste to external applications, for example Microsoft Excel, is also supported.
3.1.5 Navigate in Tables Using the Keyboard
Use the Arrow keys to move the cursor (applies for editable tables only). Use the Enter key or the F2 keyto edit a selected cell. Use the Tab key to move the cursor to the next editable cell (from left to right and top to bottom). The selection is circular, meaning when the last editable cell on the last row is reached, the cursor moves to the first editable cell in the first row.
To move to the first editable cell in a table, activate the window and press the Tab key twice.
3.1.6 Auto Fit Column Width
Double-clicking the resize-area in the column header will resize the column so that it is wide enough to show all values in the column. By default, the column name is not taken into consideration, but to do so hold down the Shift key while double-clicking.
3.2 Topology Browser
The topology browser shows the hierarchy of managed entities, for example, LAN ports, VLANs, adnd bridges on the current network element. You can view the entire hierarchy, or use any of the pre-defined views to view only managed entities of a certain type, for example only view the LAN ports. Whenever an item in the topology is selected, the attributes view will list the child objects under it.
Clicking the device folder in the topology browser ( Figure 3-1) will display all alarm-, aux- and management ports. Clicking alarmport:1 will show that specific port's attributes. Attributes that are editable (shown as bold), can be edited directly in the table or through custom user interfaces.
The combination of topology and attribute panes works similar to Windows Explorer, only it shows the contents of a network element instead of files in the file system.
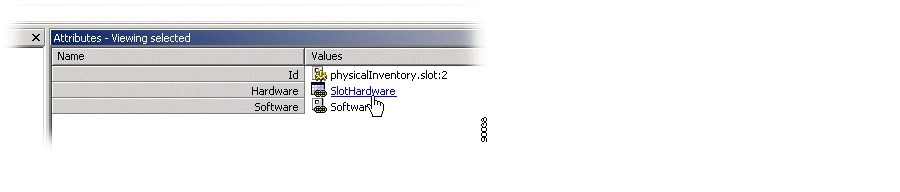
Figure 3-30 Editable Types and Tables - Hyperlinks
.
All links to editable complex types and tables appear as hyperlinks ( Figure 3-30).
Although changing attribute values can carry all necessary configurations, more complex configurations are handled using wizards or custom user interfaces.
By selecting a managed object instance and right clicking it, you can choose Open in new window. A new Attributes Viewer displaying selected managed object opens. This enables you to easily compare values on different managed objects.
The different configuration tasks using the topology browser are shown in the following chapters.
3.3 Alarm Display
The purpose of the alarm display is to present the current alarm and event notifications.
The history of all alarms also appears. The history list in the network element can be cleared. Alarms report failures in the network element. They can be clearable or not clearable. Clearable alarms have a duration. Events report other situations in the network element that are not failures. Figure 3-1 shows an event with a status.
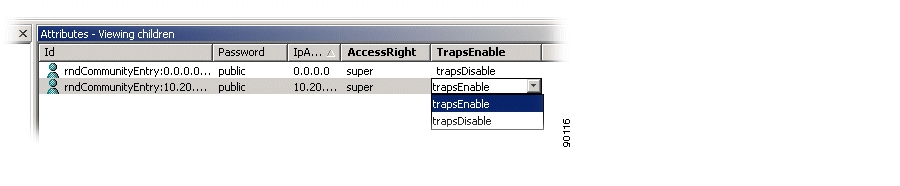
3.3.1 Subscribe Cisco Edge Craft to Alarms
You must manually register Cisco Edge Craft as a subscriber to alarms and events from the network element.
Step 1
Step 2
Figure 3-31 Setting the TrapsEnable Attribute
.
Step 3
When the registration is complete, Cisco Edge Craft polls the element for all current alarms and starts sending alarms and events to the Cisco Edge Craft IP address.
The SNMP traps are mapped to notifications in Cisco Edge Craft. The mapping philosophy is described in the "Alarm and Event Notification" section.
You can view the list of current alarm notifications by selecting current alarm in the notification list.
3.3.2 View Alarms
Click the Current tab to view current alarms ( Figure 3-32).
Figure 3-32 Current Tab - Alarm List
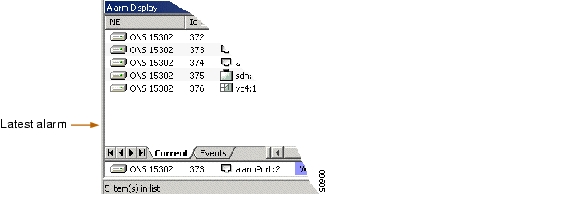
The latest alarm is visible in lower part of the Alarm List ( Figure 3-33).
Figure 3-33 Latest Alarm
3.3.2.1 Refresh
Click Refresh in the tool bar to update the Alarm List.
3.3.2.2 History
Use the following procedure to obtain a list of all alarm notifications reported on the network element since the last restart of the network element or the last clearing of the history list in the network element.
The history log on the network element can be cleared through an action on the log administration attribute of the device. See "4.3 Manage Common Parameters" section on page 4-11.
Step 1
This will provide a list of all alarm notifications reported on the network element since the last restart of the network element or the last clearing of the history list in the network element.
Step 2
You must explicitly do a refresh for Cisco Edge Craft to collect the alarm history from the network element. Before the refresh is selected the notification list might be empty because a load has not been performed yet.
Figure 3-34 Notification History
3.3.2.3 Select Alarm
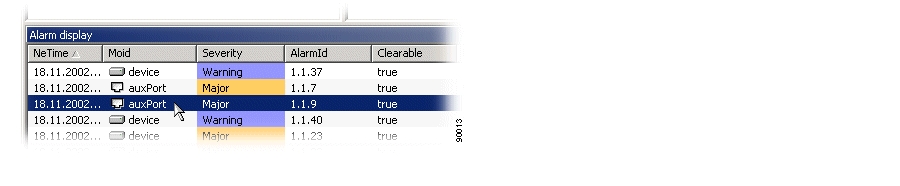
Click on desired single alarm ( Figure 3-35).
Figure 3-35 Select Single Alarm
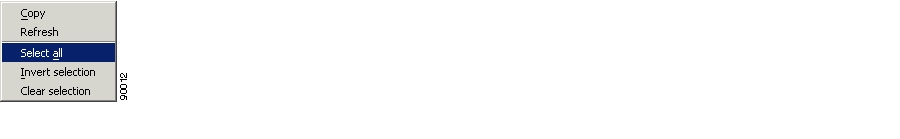
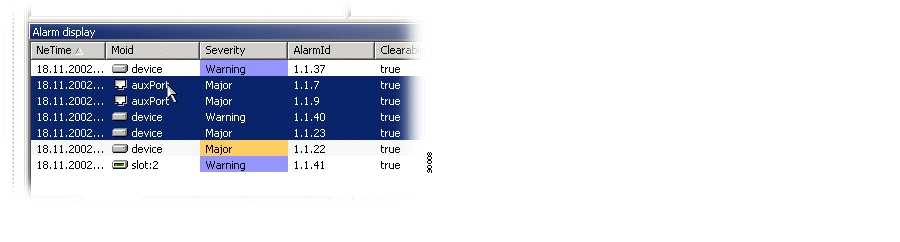
To select multiple alarms, complete the following procedure.
Step 1
Figure 3-36 Select All Alarms
or
Step 2
Figure 3-37 Select Alarms - Continuous Range
.
or
Step 3
Figure 3-38 Select Alarms - None Continuous Range
.
Step 4
3.3.2.4 Copy Alarms
Step 1
Step 2
The content of your selection is copied to the clipboard and can be pasted to other applications, for example Notepad.
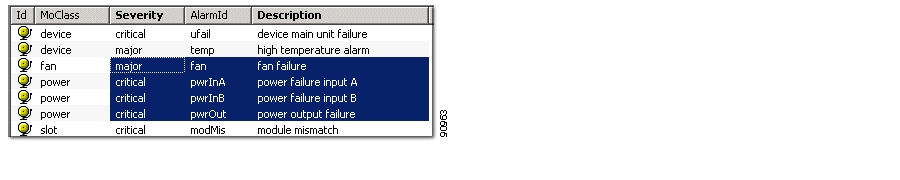
3.3.2.5 Alarm Lifecycle
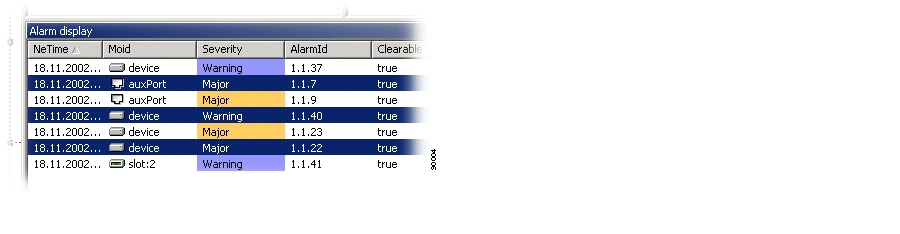
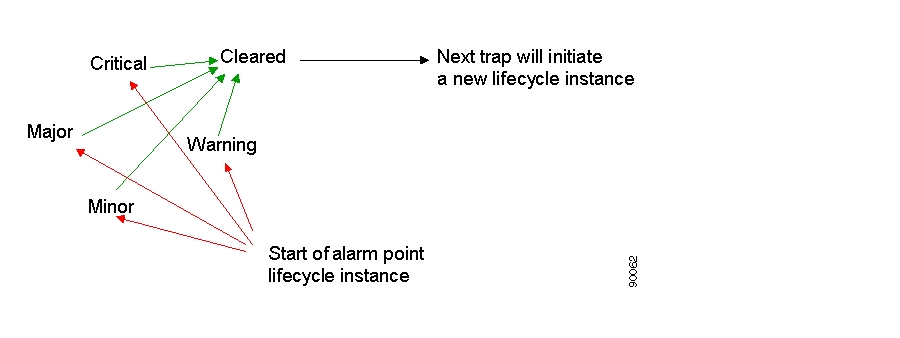
The notification list presents one row for each alarm point, that is, an alarm source and an alarm identification combination. When a new alarm notification for the same alarm point appears, the row is updated with the severity of the new alarm and new timestamps unless the alarm has been cleared. A new row is created if the alarm point starts a new lifecycle instance ( Figure 3-39). Each new alarm notification might cause a transition from one severity to another or to the cleared severity, which ends the lifecycle.
Figure 3-39 Lifecycle Instance of Alarm Point
No traps are sent to the Cisco Edge Craft IP address if you have de-registered as a trap receiver.
3.3.3 View the Events Reported from the Network Element
This section explains how to view current events and event history, and how to view, resize, and sort columns.
3.3.3.1 Current Events
To view current events reported from the network element, select Event in the notification list ( Figure 3-40 and Figure 3-41).
Figure 3-40 Select Events
.
Figure 3-41 Current Events
.
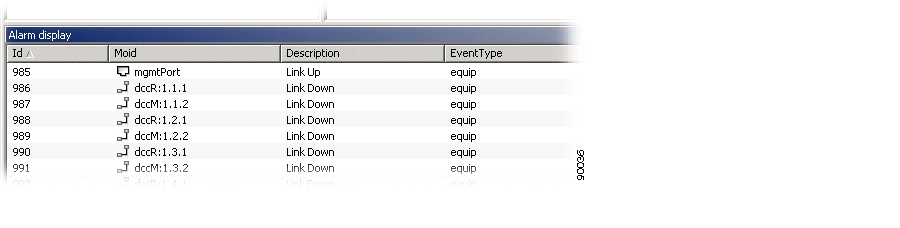
3.3.3.2 Event History
Step 1
Step 2
Figure 3-42 Event History
.
Details about the attributes of the event notifications are provided in Table 3-8.
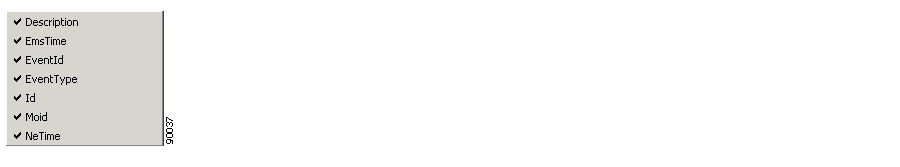
3.3.3.3 Visible Columns
You can decide which columns will be visible in the alarm display.
Step 1
Step 2
Current alarms and alarm history appear in Figure 3-43.
Events and event history appear in Figure 3-44.
Figure 3-43 Visible Columns 1
Figure 3-44 Visible Columns 2
3.3.3.4 Change Column Order
Use this procedure to change the order of columns ( Figure 3-45).
Step 1
Step 2
Figure 3-45 Column Order
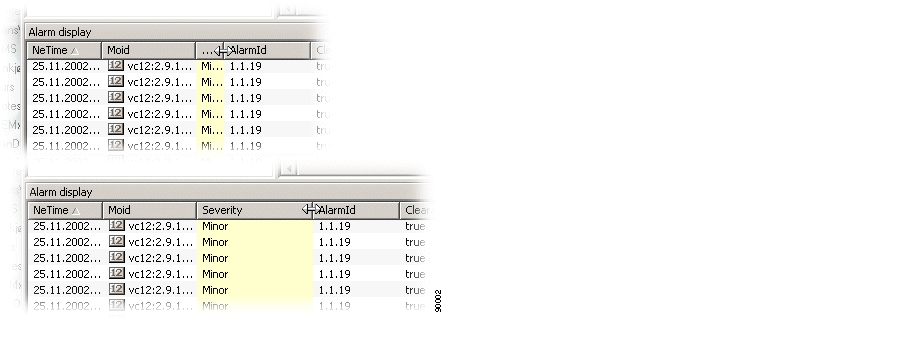
3.3.3.5 Resize Columns
Step 1
Step 2
Figure 3-46 Column Resize
.
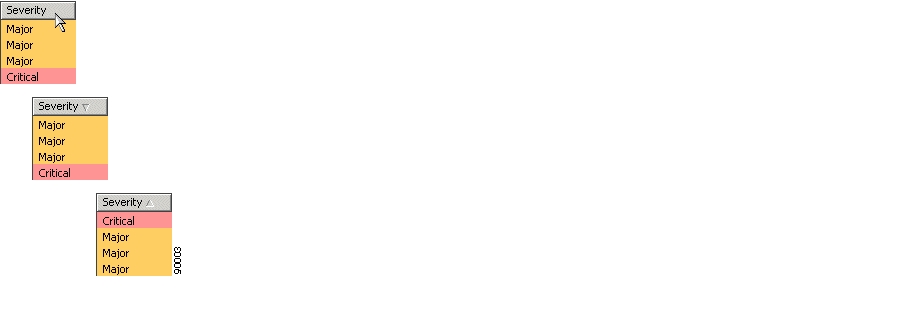
3.3.3.6 Sort Columns
Step 1
Step 2
Figure 3-47 Column Sorting
.
3.3.4 Alarm and Event Notification
The notification types with attributes supported by Cisco Edge Craft are:
•
•
3.3.4.1 Alarm Notification
The severity of an alarm notification can either be reported from the network element or must be defined in the notification mapping.
3.3.4.2 Event Notification
3.3.4.3 Trap-to-Notification Mapping
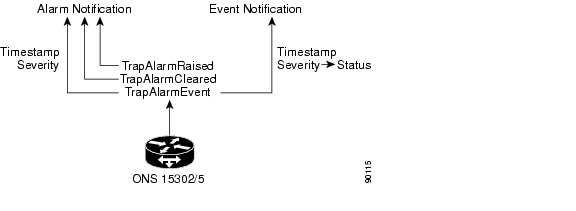
The interpretation of alarms and events is slightly different in the network element and Cisco Edge Craft. The mapping rules applied to the SNMP traps are in Figure 3-48.
Figure 3-48 Trap to Notification Mapping
The TrapAlarmRaised and TrapAlarmCleared traps are mapped to alarm notification. The timestamp in the trap is used with the severity. ONS 15305 and ONS 15302 network elements have a severity in the trap. This severity is used in notification.
One attribute in an alarm notification is called clearable. If this attribute is set to true, it indicates that the management system should expect a TrapAlarmCleared for this alarm.
Those TrapAlarmEvent traps that indicate an error failure in the network element will be mapped to an alarm notification with the clearable attribute set to false. The severity and timestamp from the trap are used in the alarm notification.
Other TrapAlarmEvents will be mapped to event notifications. These have no severity, but a status defining the type of event, for example info and confirm. The severity in the trap might be used as the status in the event notification.
3.3.4.4 Unknown Traps
If Cisco Edge Craft receives a trap and no mapping to any type of notification is available, a notification is generated. The notification contains all the information as it was received in the trap.
![]()
![]()
![]()
![]()
![]()
![]()
![]()
![]()
Posted: Fri Sep 14 11:45:49 PDT 2007
All contents are Copyright © 1992--2007 Cisco Systems, Inc. All rights reserved.
Important Notices and Privacy Statement.