To aid in management, the Catalyst 2600 allows you to obtain a variety of status, statistic, and diagnostic information. This chapter provides information on the following:
For information about setting up a console session, refer to the section "Planning for Configuration and Management."
Note The Catalyst 2600 allows LAN Network Manager LLC frames to flow through the switch. Therefore, communication between LAN Network Manager and existing source-route bridges and controlled access units is maintained. However, some error reporting functions and ring map functions might be lost for the rings attached to the Catalyst 2600.
The Catalyst 2600 allows you to view status information and statistics for individual ports or for the Catalyst 2600 as a whole. This information is displayed on several panels that are accessible from the Status/Statistics Menu.
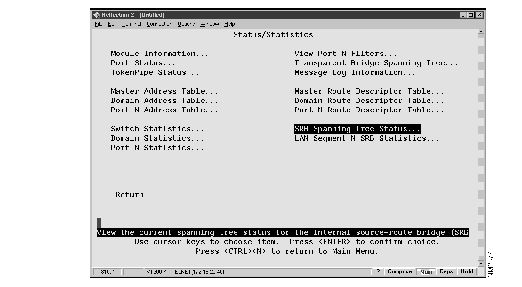
To access the Status/Statistics Menu, select Status/Statistics on the Main Menu. The Status/Statistics Menu (Figure 7-1) is displayed.
Figure 7-1: Status/Statistics Menu Panel

You can view status information for:
- The Catalyst 2600 and any installed Universal Feature Cards (UFCs)
- Each port
- Each defined TokenChannel
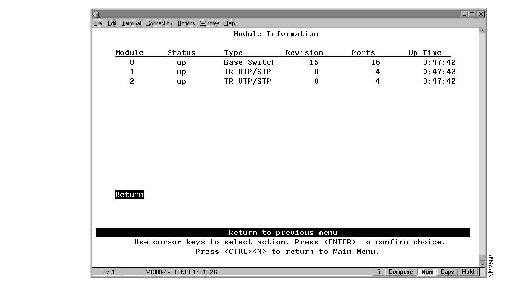
To view general information about the Catalyst 2600 and any UFCs installed, select Module Information on the Status/Statistics Menu. The Module Information panel (Figure 7-2) is displayed.
Figure 7-2: Module Information Panel

The following information is displayed on this panel:
- Module--The module number. The Catalyst 2600 is listed as Module 0. UFCs will be listed as Module 1 and Module 2.
- Status--Whether the module is up or down.
- Type--The type of module (Base Switch or UFC).
- Revision--The revision level of the module.
- Ports--The number of ports on the module.
- Up Time--The amount of time in hours, minutes, and seconds that the module has been up (since the last reset).
You cannot change the information that appears on this panel.
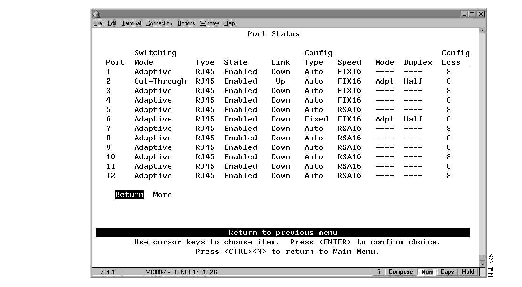
To view status information for each port of the Catalyst 2600, select Port Status on the Status/Statistics Menu. The Port Status panel (Figure 7-3) is displayed.
Figure 7-3: Port Status Panel

The following information is displayed on this panel:
- Switching Mode--The operating mode of the port (Cut-Through, Store-and-Forward, or Adaptive). To change the operating mode of the port, refer to "Configuring Switching Mode Thresholds."
- Type--The port type. Ports 1 through 16 are RJ45. If a UFC is installed, each of its ports and port types will be listed here.
- State--The operational status of the port.
- Link--Indicates whether the port is Up (open) or Down (closed).
- Configuration Type--The type of configuration mechanism used for the port.
- Auto--Speed, Mode, and Duplex are automatically set by the Catalyst 2600
- Fixed--Allows you to manually set Speed, Mode, and Duplex.
- Speed--The speed of the port in Mbps. The prefix RSA means the speed was automatically sensed and set by the Catalyst 2600. The prefix FIX means the speed was set to a fixed value via configuration.
- Mode--Indicates whether the port is used for shared or dedicated media.
- Port Mode--In port mode only a dedicated connection to a station is supported. The Tx/Rx pinouts are the same as a concentrator's.
- Adapter Mode--In adapter mode, the port operates like a station. The connection may be dedicated or shared. The Tx/Rx pinouts are the same as an adapter's.
- Duplex--Whether the port is operating in full or half duplex mode. Changes to the duplex settings are made immediately by the Catalyst 2600.
- Configuration Loss--The configuration loss threshold. Configuration loss occurs when a port completes a connection, allows data traffic to flow, and subsequently closes. This threshold is used to control the number of configuration losses that can occur within a specified time. When the threshold is exceeded, the port is disabled and must be enabled via this panel or an SNMP manager.
You cannot change any information on this panel. To change any of the port parameters, refer to the section "Configuring Port Parameters."
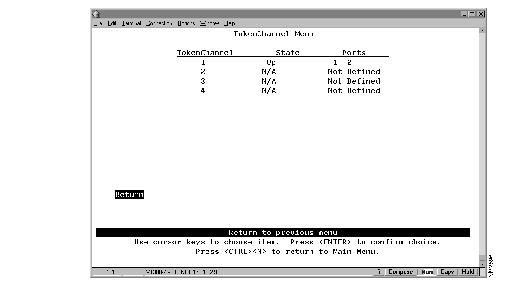
To view status information for any TokenChannels configured in the Catalyst 2600, select TokenChannel Status on the Status/Statistics Menu. The TokenChannel Status panel (Figure 7-4) is displayed.
Figure 7-4: TokenChannel Status Panel

The following information is displayed on this panel:
- TokenChannel--The identifier of the TokenChannel (1 through 4).
- State--Indicates whether the TokenChannel is up, down, or not defined.
- Ports--Indicates which ports are assigned to this TokenChannel.
You cannot change any information on this panel. To change any of the TokenChannel parameters, refer to the section "Configuring TokenChannels."
You can view the address tables, which are used in forwarding frames, for:
- The Catalyst 2600 as a whole
- Individual domains
- Individual ports
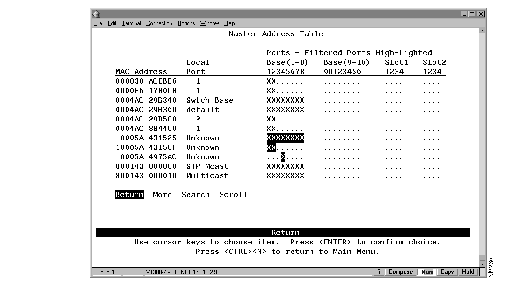
To view all entries in the master address table, select Master Address Tables on the Status/Statistics Menu. The Master Address Table panel (Figure 7-5) is displayed. The master address table can contain up to 10,000 entries.
Figure 7-5: Master Address Table Panel

The following information is displayed on this panel:
- Mac Address--The MAC address.
- Local Port--The type of address or association of the address with the listed port, such as:
- Multicast for a multicast address.
- Broadcast for a broadcast address.
- Filtered for a filtered packet address.
- STP Mcast for a BPDU multicast address reserved for the port (hello packet).
- STP Port xx for an address reserved for a Spanning-Tree Protocol port.
- Swtch Base for the address assigned to the Catalyst 2600.
- Domain xx for a address assigned to a virtual LAN domain.
- Unknown for a MAC address with an unknown location.
Note Highlighted entries indicate filtered ports.
- Base and Slots--The ports of the switch (Base) or a UFC (Slot) whose address tables include this MAC address.
| To
| Select
| Then
|
|---|
| Search for a specific MAC address...
| Search
| Specify the address.
|
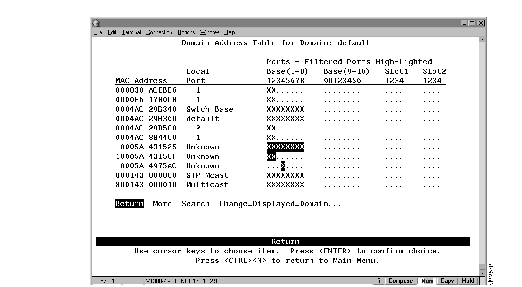
To view the entries in the address table for each domain, select Domain Address Table on the Status/Statistics Menu. The Domain Address Table panel (Figure 7-6) is displayed. The entries are listed in the order in which they were encountered.
Figure 7-6: Domain Address Table Panel

The following information is displayed on this panel:
- Mac Address--The MAC address.
- Local Port--The type of address or association of the address with the listed port, such as:
- Multicast for a multicast address.
- Broadcast for a broadcast address.
- Filtered for a filtered packet address.
- STP Mcast for a BPDU multicast address reserved for the port (hello packet).
- STP Port xx for an address reserved for a Spanning-Tree Protocol port.
- Swtch Base for the address assigned to the Catalyst 2600.
- Domain xx for a address assigned to a virtual LAN domain.
- Unknown for a MAC address with an unknown location.
- Highlighted entries indicate filtered ports.
- Base and Slots--The ports of the switch (Base) or a UFC (Slot) whose address tables include this MAC address.
| To
| Select
| Then
|
|---|
| View the address table for another domain...
| Change_Displayed_Domain
| Specify the domain.
|
| Search for a specific MAC address...
| Search
| Specify the address.
|
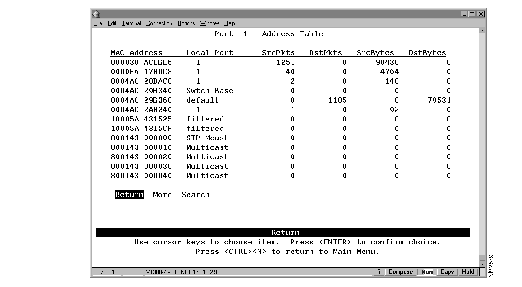
To view the entries in the address table of a specific port, select Port N Address Table on the Status/Statistics Menu and specify a port number. The Port N Address Table panel (Figure 7-7) is displayed. The port address table can contain up to 1790 entries. The entries are listed in the order in which they were encountered.
Figure 7-7: Port N Address Table Panel

The following information is displayed on this panel:
- Mac Address--The MAC address.
- Local Port--The type of address or association of the address with the listed port, such as:
- Multicast for a multicast address.
- Broadcast for a broadcast address.
- Filtered for a filtered packet address.
- STP Mcast for a BPDU multicast address reserved for the port (hello packet).
- STP Port xx for an address reserved for a Spanning-Tree Protocol port.
- Swtch Base for the address assigned to the Catalyst 2600.
- Domain xx for a address assigned to a virtual LAN domain.
- Unknown for a MAC address with an unknown location.
- Highlighted entries indicate filtered ports.
- Source Packets (SrcPkts)--The number of packets received from this address.
- Destination Packets (DstPkts)--The number of packets sent to this address.
- Source Bytes (SrcBytes)--The number of bytes received from this address.
- Destination Bytes (DstBytes)--The number of bytes sent to this address.
| To
| Select
| Then
|
|---|
| Search for a specific MAC address...
| Search
| Specify the address.
|
You can view operating statistics for:
- The Catalyst 2600 as a whole
- Individual domains
- Individual ports
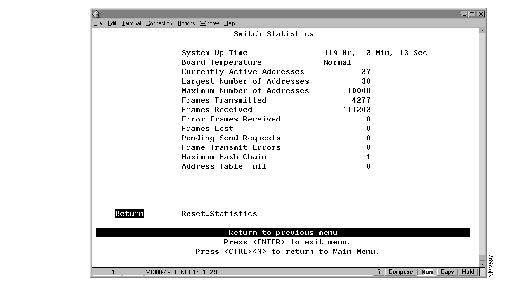
To view operating statistics for the Catalyst 2600, select Switch Statistics on the Status/Statistics Menu. The Switch Statistics panel (Figure 7-8) is displayed. This panel is automatically refreshed every 10 seconds.
Figure 7-8: Switch Statistics Panel

The following information is displayed on this panel:
- System Up Time--The length of time (in hours, minutes, and seconds) since the last reset or power cycle.
- Board Temperature--Whether the board temperature is Normal or Unacceptably high (over 122°F or 50°C).
- Currently Active Addresses--The number of entries in the address table, that represent currently active stations, or nodes, on all ports of the Catalyst 2600.
- Largest Number of Addresses--The largest number of addresses in the address table at any one time since the last reset or power cycle.
- Maximum Number of Addresses--The maximum number of addresses that the Catalyst 2600 can support simultaneously.
- Frames Transmitted--The number of frames transmitted from the Catalyst 2600 processor.
- Frames Received--The number of frames received by the Catalyst 2600 processor.
- Error Frames Received--The number of frames received that were too long or short.
- Frames Lost--The number of frames dropped because of errors.
- Pending Send Requests--The number of frames in the send queue.
- Frame Transmit Errors--The number of frames unable to be transmitted by the processor because of transmit errors.
- Maximum Hash Chain--The largest number of addresses that have hashed to the same location in look-up tables having the same index.
- Address Table Full--The number of times the address table has reached capacity.
| To
| Select
|
|---|
| Reset the counters...
| Reset_Statistics
|
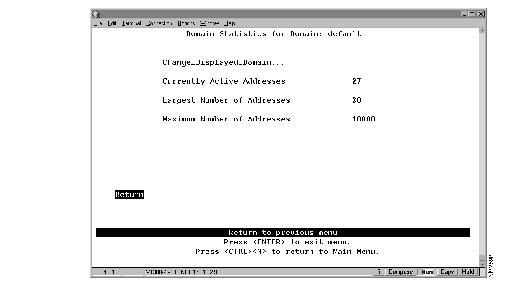
To view statistics for each domain, select Domain Statistics on the Status/Statistics Menu. The Domain Statistics panel (Figure 7-9) is displayed.
Figure 7-9: Domain Statistics Panel

The following information is displayed on this panel:
- Currently Active Addresses--The number of addresses currently in the master address table that are recognized by ports belonging to this domain.
- Largest Number of Addresses--The largest number of addresses in the master address table since the last reset or power cycle that are recognized by ports belonging to this domain.
- Maximum Number Of Addresses--The maximum number of addresses allowed in the domain.
| To
| Select
| Then
|
|---|
| View statistics for another domain...
| Change_Displayed_Domain
| Specify the domain.
|
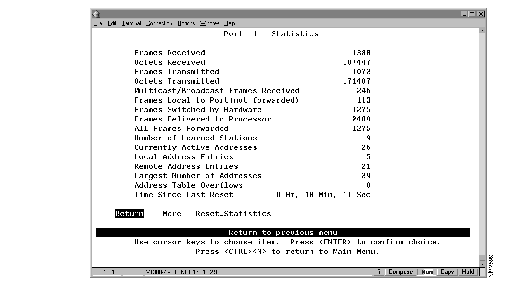
To view statistics for a specific port, select Port N Statistics on the Status/Statistics Menu and specify the port number. The Port N Statistics panel (Figure 7-10) is displayed. This panel is automatically refreshed every 10 seconds.
Figure 7-10: Port N Statistics Panel 1

The following information is displayed on this panel:
- Frames Received--The number of frames received by the port.
- Octets Received--The number of octets, or bytes, received.
- Frames Transmitted--The number of frames transmitted by the port.
- Octets Transmitted--The number of octets, or bytes, transmitted by the port.
- Multicast/Broadcast Frames Received--The number of frames received that have the multicast bit set or are broadcast frames.
- Frames Local to Port (not forwarded)--The number of frames that are confined to this segment and are not forwarded.
- Frames Switched by Hardware--The number of frames received on this port and forwarded by the Catalyst 2600 hardware to another port without learning.
- Frames Delivered to Processor--The number of frames received on this port and forwarded to the processor for learning.
- All Frames Forwarded--The number of frames received on this port and forwarded by the Catalyst 2600 hardware or processor.
- Number of Learned Stations--The number of addresses in the address table.
- Currently Active Addresses--The sum of local and remote addresses.
- Local Address Entries--The number of addresses on this port that belong to the local segment.
- Remote Address Entries--The number of addresses on this port that belong to another segment.
- Largest Number of Addresses--The largest number of addresses active since the last reset of the Catalyst 2600.
- Address Table Overflows--The number of times the address table has reached the maximum number of entries.
- Time Since Last Reset--Displays the time (in hours, minutes, and seconds) since the port traffic counters were last reset.
| To
| Select
|
|---|
| View additional statistics...
| More
|
| Reset the counters...
| Reset_Statistics
|
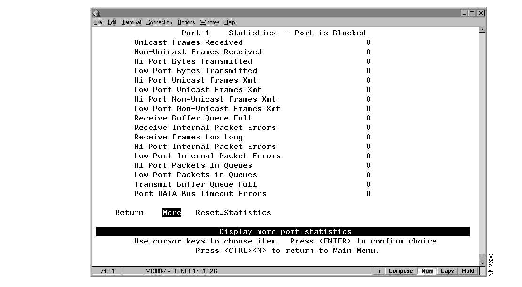
Figure 7-11: Port N Statistics Panel 2

The statistics shown on this panel provide additional granularity for analyzing traffic and switch performance statistics. Some error events are counted for possible fault analysis.
- Unicast Frames Received--The number of frames received by this port that are designated for a single destination address.
- Non-Unicast Frames Received--The number of frames received by this port that are designated for a general broadcast or multicast address.
- Hi Port Bytes Transmitted--The number of bytes transmitted from the high-priority transmit queue.
- Low Port Bytes Transmitted--The number of bytes transmitted from the low-priority transmit queue.
- Hi Port Unicast Frames Xmt--The number of unicast frames transmitted from the high-priority transmit queue.
- Low Port Unicast Frames Xmt--The number of unicast frames transmitted from the low-priority transmit queue.
- Hi Port Non-Unicast Frames Xmt--The number of general broadcast or multicast frames transmitted from the high-priority transmit queue.
- Low Port Non-Unicast Frames Xmt--The number of general broadcast or multicast frames transmitted from the low-priority transmit queue.
- Receive Buffer Queue Full--The number of instances in which a packet arrived on the port and there were no available receive buffers.
- Receive Internal Packet Errors--The number of times that a packet was received with an error (for example, CRC or incomplete frame) that resulted in an abnormal termination of a cut-through operation.
- Receive Frames Too Long--The number of frames received that exceed the maximum frame length limit of 4540 bytes.
- Hi Port Internal Packet Errors--The number of transmits from the high-priority transmit queue in which an abnormal frame termination occurred.
- Low Port Internal Packet Errors--The number of transmits from the low-priority transmit queue in which an abnormal frame termination occurred.
- Hi Port Packets in Queues--The current number of packets in the high-priority transmit queue awaiting transmission.
- Low Port Packets in Queues--The current number of packets in the low-priority transmit queue awaiting transmission.
- Transmit Buffer Queue Full--The number of packets lost because of the inability of the transmit queue to accept a packet from another port.
- Port DATA Bus Timeout Errors--The number of receive packets discarded because of failure of the target port to accept the packet.
| To
| Select
|
|---|
| Reset the counters...
| Reset_Statistics
|
| Return to the previous panel...
| More
|
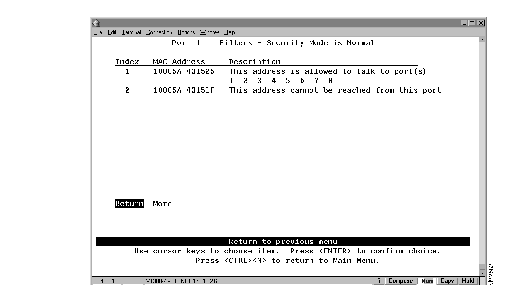
To display the defined filters and security mode for a specific port, select View Port N Filters on the Status/Statistics Menu. The Port N Filters panel (Figure 7-12) is displayed.
Figure 7-12: Port N Filters Panel

The following information is displayed on this panel:
- Index--The identifier of the filter entry.
- MAC Address--The MAC address contained in packets to be filtered.
- Description--The filter action taken on the packet with the specified MAC address.
You cannot change any information on this panel. To change the filters or security mode, refer to the section "Limiting Scope and Access."
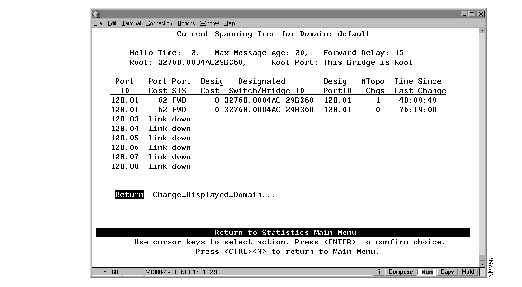
To display the spanning-tree parameters for each domain, select Current Spanning Tree on the Status/Statistics Menu. The Current Spanning Tree panel (Figure 7-13) is displayed.
Figure 7-13: Current Spanning Tree Panel

The following information is displayed on this panel:
- Hello Time--The time (in seconds) that the root waits between sending configuration messages. This time is advertised by the root and used by all devices and switches in the active topology of the spanning-tree network.
- Max Message Age--The time at which the configuration message used by the spanning-tree algorithm should be discarded. This time is advertised by the root and used by all devices and switches in the active topology of the spanning-tree network.
- Forward Delay--The time the root waits between transitions from listening to learning, and from learning to forwarding. This time is advertised by the root and used by all devices and switches in the active topology of the spanning-tree network.
- Root--The priority and MAC address of the device in the spanning tree that this Catalyst 2600 has accepted as the root device.
- Root Port--The number of the port on this Catalyst 2600 that is closest to the root. This Catalyst 2600 communicates with the root through this port. If there is no root port, this Catalyst 2600 has been accepted as the root of the spanning-tree network.
- Port ID--The port ID that is used to determine the role of the port in the spanning tree. The port ID is expressed in the form port priority.port number.
- Port Cost--The cost associated with each port. Lower numbers are generally assigned to ports attached to faster media (such as FDX or TokenChannel), and higher numbers are generally assigned to ports attached to slower media (such as 2400-baud modem links).
- Port Status--The current status of this port within the spanning tree. Possible values are:
- DSB (Disabled)
- BLK (Blocked)
- LSN (Listening)
- LRN (Learning)
- FWD (Forwarding)
- The rules that define the state of the port are as follows:
- A port on a network segment that contains no other switch or bridge is always forwarding.
- If two ports of the Catalyst 2600 are connected to the same network segment and there is no other bridge or switch, the port with the lower ID is forwarding and the other is blocked.
- When the switch is booted, all ports are blocked initially, and then some of them change to a different state: listening, learning, and forwarding, in that order. To see the change in states you must repeatedly exit from this menu, and then select it again. All ports that are going to change states from blocking to forwarding will have done so after two to three times the value of:
- Switch Maximum Message Age + (2 x Switch Forward Delay)
- Designated Cost--The cost for a packet to travel from this port to the root in the current spanning-tree configuration. The slower the media, the higher the cost.
- Designated Switch/Bridge ID--The priority and MAC address of the device through which this port has determined it must communicate with the root of the spanning tree.
- Designated Port ID--The port on the designated bridge through which this Catalyst 2600 will communicate with the root of the spanning tree. This information is useful if the Catalyst 2600 is the designated bridge on one or more network segments.
- # Topo Changes--The number of topology changes, that is, the number of times the port has entered the forwarding state plus the number of times the port has made the transition from forwarding to blocking. The counter is reset when the switch is reset or the spanning tree is turned on.
- Time Since Last Change--The time since the port last entered the forwarding state or made the transition from forwarding to blocking.
You cannot change any information on this panel. To change the spanning tree parameters, refer to the section "Configuring Spanning-Tree Parameters."
| To
| Select
| Then
|
|---|
| View Spanning Tree parameters for another domain...
| Change_Displayed_Domain
| Specify the domain.
|
To view the message log, select Message Log on the Status/Statistics Menu. The Message Log Information panel is displayed. The data on this panel is useful to technical experts in solving complex problems.
The following information is displayed on this panel:
- Log--Index number identifying the log file.
- Type--The message type. Possible values are:
- W--Warning
- I--Informational
- Message Content--The full text of the message.
| To
| Select
|
|---|
| Delete the contents of the message log...
| Clear_Logs
|
You can view route descriptors, which are used in forwarding source-routed frames, for:
- The Catalyst 2600 as a whole
- Individual domains
- Individual ports
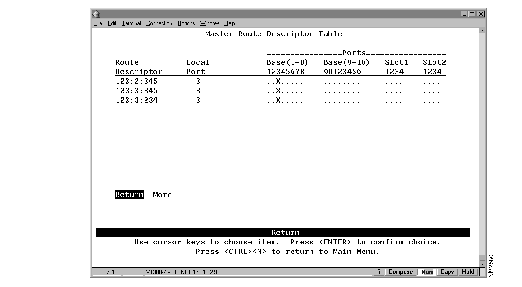
To view all the route descriptors (and their associated ports) that have been learned by the Catalyst 2600, select Master Route Descriptor Tables on the Status/Statistics Menu. The Master Route Descriptor Table panel (Figure 7-14) is displayed. These descriptors are contained within the 10,000 entries allowed for the master address table.
Figure 7-14: Master Route Descriptor Table Panel

The following information is displayed on this panel:
- Route Descriptor--The route descriptor associated with a port in the format:
local_segment_number:bridge_number:remote_segment_number
- The local segment number is displayed in hexadecimal and is the same for all ports within a single domain.
- Local Port--The number of the port with which this route descriptor is associated.
- Ports: Base and Slots--The ports of the switch (Base) or a UFC (Slot) whose address tables include this route descriptor.
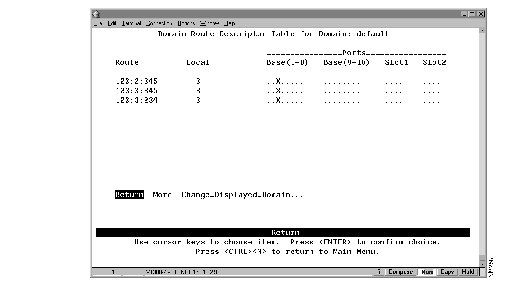
To view the entries in the route descriptor table for each domain, select Domain Route Descriptor Tables on the Status/Statistics Menu. The Domain Route Descriptor Table panel (Figure 7-15) is displayed.
Figure 7-15: Domain Route Descriptor Table Panel

The following information is displayed on this panel:
- Route Descriptor--The route descriptor associated with a port in the format:
local_segment_number:bridge_number:remote_segment_number
- The local segment number is displayed in hexadecimal and is the same for all ports within a single domain.
- Local Port--The number of the port with which this route descriptor is associated.
- Ports: Base and Slots--The ports of the switch (Base) or a UFC (Slot) whose address tables include this route descriptor.
| To
| Select
| Then
|
|---|
| View the route descriptor tables for another domain...
| Change_Displayed_Domain
| Specify the domain.
|
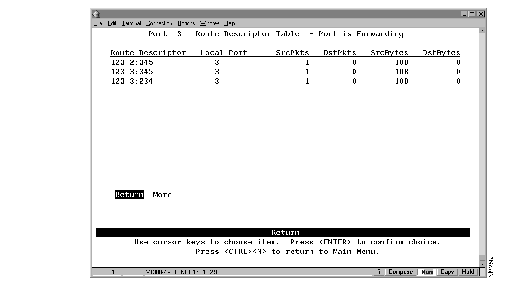
To view the entries in the route descriptor table for a specific port, select Port N Route Descriptor Tables on the Status/Statistics Menu and specify a port number. The Port N Route Descriptor Table panel (Figure 7-16) is displayed. These descriptors are contained within the 1790 entries allowed for each port address table.
Figure 7-16: Port N Route Descriptor Table Panel

The following information is displayed on this panel:
- Route Descriptor--The route descriptor associated with a port in the format:
local_segment_number:bridge_number:remote_segment_number
- The local segment number is displayed in hexadecimal and is the same for all ports within a single domain.
- Local Port--The number of the port with which this route descriptor is associated.
- Source Packets (SrcPkts)--The number of packets received from this address.
- Destination Packets (DstPkts)--The number of packets sent to this address.
- Source Bytes (SrcBytes)--The number of bytes received from this address.
- Destination Bytes (DstBytes)--The number of bytes sent to this address.
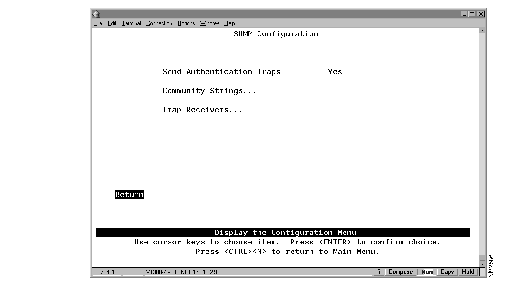
To allow the Catalyst 2600 to be managed by an SNMP manager, you must first configure the SNMP parameters. To view or set SNMP parameters, such as the community names, where traps are to be sent, and whether authentication failure traps should be sent, select SNMP Configuration on the Configuration Menu. The SNMP Configuration panel (Figure 7-17) is displayed.
Figure 7-17: SNMP Configuration Panel

The following information is displayed on this panel:
- Send Authentication Failure Traps--Indicates whether an authentication trap should be issued to Trap Receivers whenever authentication of an SNMP request fails. Traps indicating cold and warm boots are always sent.
|
To
| Select
| Then
|
|---|
| Change the current settings...
| The appropriate parameter...
| Specify the value.
|
| View or change SNMP community names and privileges...
| Community Strings
| Refer to "Specifying Community Names".
|
| View or change which SNMP managers are to receive traps for which domains...
| Trap Receivers
| Refer to "Specifying Trap Receivers".
|
| Save your changes...
| Return
|
|
To view or change the community names for the domains of the Catalyst 2600, select Community Strings on the SNMP Configuration panel. The Community Strings panel (Figure 7-18) is displayed. A community name is a name associated with the Catalyst 2600 and a set of SNMP managers that are allowed to manage it with the specified privilege level.
Figure 7-18: Community Strings Panel

The following information is displayed on this panel:
- Index--The identifier of the community name entry.
- Community Name--The name, or password, used to identify the SNMP managers.
- Mode--The privilege level assigned to this name. Read specifies that SNMP managers can only view SNMP information. Read/Write specifies that SNMP managers can both view and change SNMP information.
Entries are displayed in the order in which they are entered. There is a limit of 10 community names.
| To
| Select
| Then
|
|---|
| Add a community name...
| Add
| Specify the community name and privilege.
|
| Change a community name or privilege...
| Change
| Specify the index number of the entry to be changed and enter the new information.
|
| Delete a community name...
| Delete
| Specify the name to be deleted.
|
| Delete all community names...
| Clear_Table
|
|
| Save your changes...
| Return
|
|
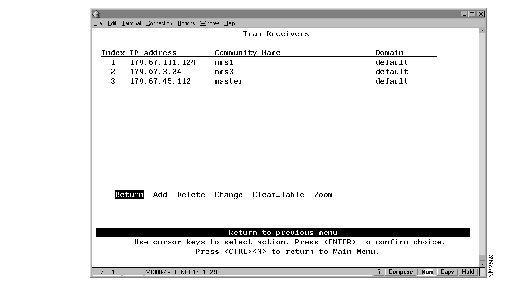
To view or change the list of SNMP managers to which traps are sent, select Trap Receivers on the SNMP Configuration panel. The Trap Receivers panel (Figure 7-19) is displayed.
Figure 7-19: Trap Receivers Panel

The following information is displayed on this panel:
- Index--The identifier of the trap receivers entry.
- IP Address--The IP address of the SNMP manager.
- Community Name--The name used to identify the SNMP managers.
- Domain--The domain for which traps are sent to the specified SNMP manager.
The trap receivers list can contain a maximum of six entries.
| To
| Select
| Then
|
|---|
| Add an entry to the list...
| Add
| Specify the IP address, community name, and domain.
|
| Change an entry in the list...
| Change
| Specify the index number of the entry to be changed and enter the new information.
|
| Delete an entry...
| Delete
| Specify the index number of the entry to be deleted.
|
| Delete all entries...
| Clear_Table
|
|
| Save your changes...
| Return
|
|
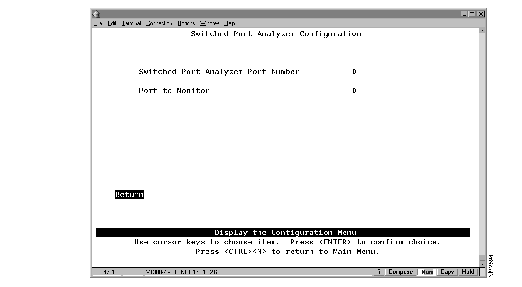
The Catalyst 2600 allows you to configure a Switched Port Analyzer port for monitoring port traffic. This Switched Port Analyzer support allows you to monitor traffic on any of the Token Ring ports using a customer-supplied monitoring device or trace tool. To configure a Switched Port Analyzer port, select Switched Port Analyzer Configuration on the Configuration Menu. The Switched Port Analyzer Configuration panel (Figure 7-20) is displayed.
Note The trace tool will be able to monitor only traffic that is switched by the monitored port. MAC frames are not monitored.
Figure 7-20: Switched Port Analyzer Configuration Panel

The following information is displayed on this panel:
- Switched Port Analyzer Port Number--The port to which the network analyzer will be attached.
Note This port should be assigned to its own domain. For information about assigning ports to a domain, see "
Configuring Multiple Domains" in the chapter "
Configuring the Catalyst 2600".
- Port To Monitor--The port that will be monitored.
| To
| Select
| Then
|
|---|
| Change the current settings...
| The appropriate parameter...
| Specify the value.
|
| Disable the Switched Port Analyzer port...
| Port to Monitor
| Specify 0.
|
| Save your changes...
| Return
|
|
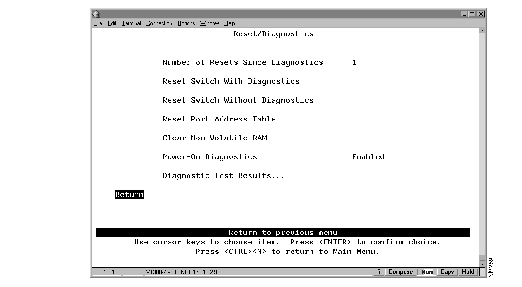
To reset the switch or to obtain diagnostic information, select Reset/Diagnostics on the Main Menu. The Reset/Diagnostics panel (Figure 7-21) is displayed.
Figure 7-21: Reset/Diagnostics Panel

The following information is displayed on this panel:
- Number Of Resets Since Diagnostics--The number of times the unit has been reset since the unit was powered on or ran power-on diagnostics. This number is not reset to 0 when you reset a port address table.
- Power-On Diagnostics--Whether the power-on diagnostics are run when the Catalyst 2600 is powered on.
| To
| Select
| Then
|
|---|
| Reset the Catalyst 2600, clear all counters including address tables, and run diagnostic tests...
| Reset Switch With Diagnostics
| You are prompted to confirm the reset and then to press any key to initiate the reset. This does not clear any user-configured parameters. When the Catalyst 2600 restarts, parameters from NVRAM are used to initiate the operational parameters.
|
| Reset the Catalyst 2600 and clear all counters including address tables without running diagnostic tests...
| Reset Switch Without Diagnostics
| You are prompted to confirm the reset and then to press any key to initiate the reset. This does not clear any user-configured parameters. When the Catalyst 2600 restarts, parameters from NVRAM are used to initiate the operational parameters.
|
| Clear all table entries for a selected port or all ports, set all port traffic counter to 0, and set Time since Last Reset to 0...
| Reset Port Address Table
|
|
| Delete all user-configured parameters, such as IP address and baud rate information, and reset the Catalyst 2600...
| Clear Non-volatile RAM
|
|
| View the results of the most recent running of power-on diagnostics...
| Diagnostic Test Results
| Refer to "Viewing Diagnostic Test Results".
|
Note Clearing NVRAM erases all configuration parameters. If you are using the TokenChannel feature, be sure to disconnect the affected ports or disable them on the corresponding switch
before clearing NVRAM. If you are using the spanning-tree option, it will be turned off and port costs and priorities will be lost, which can result in loops. Use the menus to reestablish port costs and priorities. If you are using an SNMP manager, you will need to reconfigure all IP and SNMP parameters.
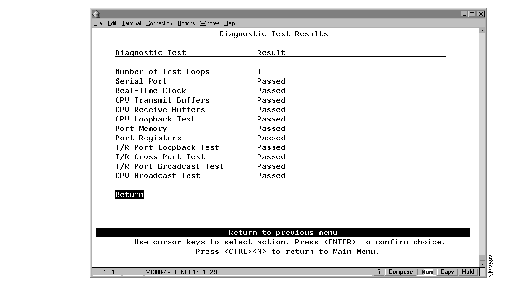
To view the results of the most recent power-on diagnostics, select Diagnostic Test Results on the Reset/Diagnostics panel. The Diagnostic Test Results panel (Figure 7-22) is displayed.
Figure 7-22: Diagnostic Test Results Panel

If the Catalyst 2600 is connected to a terminal via the EIA 232 port, the diagnostic messages (similar to those in Figure 7-23) should appear after you reset the Catalyst 2600 with diagnostics. An abbreviated version of these messages will appear if you reset the Catalyst 2600 without diagnostics.
Figure 7-23: Diagnostics Messages
Catalyst 2600 Boot Firmware P/N 11152-00 RevA, Copyright 1996
- Initiating bootstrapping sequence.
- Boot image integrity check...Passed.
- Control transferred to boot process.
- Relocating main image to DRAM........Done.
- Main image integrity...succeeded.
- Control transferred to main process.
Catalyst 2600 started on Fri. January 6, 2000 12:58:0
4 Megabytes System memory
2 Megabytes Network memory
- Initialization started
- File system initialized
- System temperature is within safe operating levels
- Warmboot initialization started
- LAN ports detected:
- Token Ring Ports: 1 2 3 4 5 6 7 8 9 10 11 12 13 14 15 16
- Initializing Ports: 1 2 3 4 5 6 7 8 9 10 11 12 13 14 15 16
- Initializing system address table
- No existing diagnostic information, forcing diagnostic mode
- Starting Power Up Diagnostics test
- UART loopback test on diagnostic port...Passed
- UART loopback test on console port...Passed
- RTC memory test...Passed
- Real Time Clock test...Passed
- CPU loopback test..............Passed
- Token Ring Port loopback test...........Passed
- Token Ring Port cross port loopback test...........Passed
- Token Ring Port broadcast test...........Passed
- CPU broadcast test...Passed
- Completing Power Up Diagnostic
- Activating Ports: 1 2 3 4 5 6 7 8 9 10 11 12 13 14 15 16
- Activating IP
- Catalyst 2600 initiating bootp requests on one or more domains
- System initialization complete
Press RETURN key to activate console...

