|
|

This section describes the concepts of network and service management associated with the Cisco 6400 UAC using CEMF. It describes the basic concepts of CEMF (for further information, refer to the CEMF User Guide). The CEMF commands, icons and menus that access services on the Cisco 6400 SCM are described, with examples of the containment trees and services.
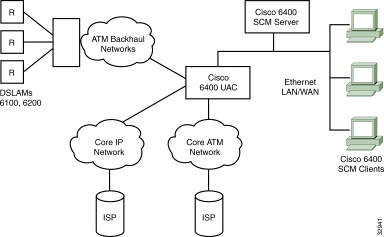
Figure 2-1 shows a typical installation of the Cisco 6400 UAC located within the service provider's infrastructure and acting as a central point of control.
The Cisco 6400 SCM software has two distinct components: Element Management and Service Connection Management.
An Element Manager is an application which is responsible for providing FCAPS management for a particular type of network element or family of network elements.
Element managers integrate seamlessly with generic CEMF applications such as maps and event browsers.
Element Management consists of FCAPS and Operations, Administration, Maintenance and Provisioning (OAM&P) features and presents you with a more detailed view of the underlying network elements.
Refer to the "Managing the Element Manager Windows" chapter for further details.
Service Connection Management can create and configure subscribers and services and manage resultant subscriber/services connections. Performing these functions does not require an understanding of the details of the underlying network elements.
Refer to the "Service/Subscriber Provisioning" chapter for further details.
You must start a CEMF user session before you can start the 6400 SCM application.
To start an CEMF user session, proceed as follows:
Step 1 From the command line on the terminal window type
<CEMFROOT>/bin/cemfsession
The Login window appears.
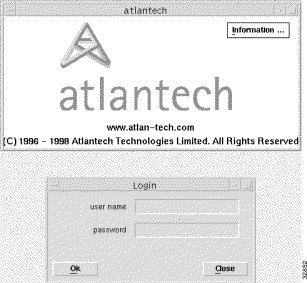
Step 2 Enter your user name and password. The default user name and password are admin.
Step 3 Click OK.
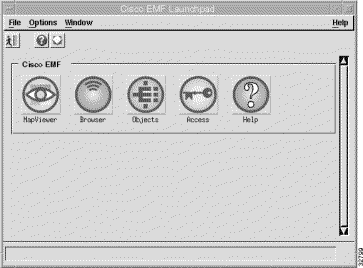
The CEMF Launchpad (shown in Figure 2-3) appears when a valid user name and password combination are entered.
The icons (shown in Figure 2-3) represent the standard CEMF tools. Click on the corresponding icon to launch an CEMF tool.
The Map Viewer displays a graphical representation of the selected Cisco 6400 chassis.
The 6400 SCM chassis map shows a graphical representation of the 6400 UAC.
To view the chassis map for a selected site, proceed as follows:
Step 1 Click Map Viewer s (shown in Figure 2-3) on the CEMF Launchpad.
Step 2 The Map Viewer Top window appears. Double-click on Top-Site in the right-hand frame.
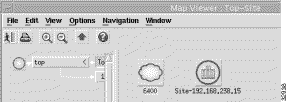
Step 3 Double-click on the selected site (Site-192.168.238.15, in the example shown below).
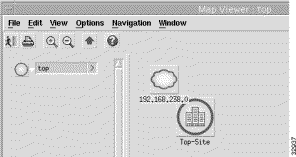
The Map Viewer window shows a graphical representation of the Cisco 6400 chassis for the selected site.
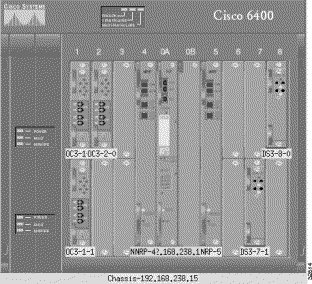
Each card in the rack has a color-coded box that identifies the card type, its position in the chassis rack, and its current alarm status.
Green is a `normal' state; orange is a major alarm; and blue is a decommissioned (unmanaged) element. For example, in the chassis map shown in Figure 2-6, DS3-8-0 identifies a DS3 line card (DS3) in slot 8 (8) occupying the top half sub slot (0) of the slot and the green color indicates that the DS3 line card is in its normal state.
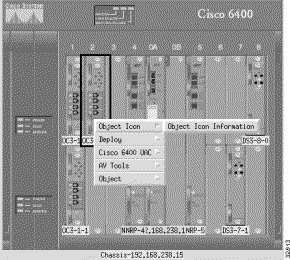
Figure 2-7 shows an example of typical line card menus displayed when you right click on the selected line card.
The Cisco 6400 UAC supports a number of alarm sources, including SNMP traps and SNMP alarm tables from Cisco 6400 MIBs. Additionally, a number of event derivations can be made by the Cisco 6400 SCM.
All alarm sources of the Cisco 6400 SCM are displayed in windows, providing an integrated fault management solution.
This section outlines the sources of Cisco 6400 SCM alarm information and shows how these sources are represented within the Cisco 6400 SCM and CEMF applications.
Event Browser is an application that allows you to view events flagged by the system.
The Event Browser displays the following information:
This information appears in a table format. All events are saved within the Event Browser, which displays both current and historical data.
All network objects are color-coded reflecting their operational status. Alarms are raised up the element hierarchy according to severity. Table 2-1 identifies alarm types and their associated color codes.
| Alarm Type | Color |
|---|---|
Critical | Red |
Major | Orange |
Minor | Yellow |
You can navigate directly from a single event to the affected object to perform detailed configuration activities.
One example of a major (orange) alarm is loss of connectivity to any Cisco 6400 component. This appears as an orange alarm in the Map Viewer window. When this occurs, you should go to the Event Browser window for details of the alarm.
To view the Event Browser window, proceed as follows:
Step 1 Right click on either the object on the relevant chassis in the MapViewer window; or, on a map node; or, on an object in the Object Manager; or, on an open Element Management window from an object pick list.
Step 2 Select the CEMF Tools, Open Event Browser option.
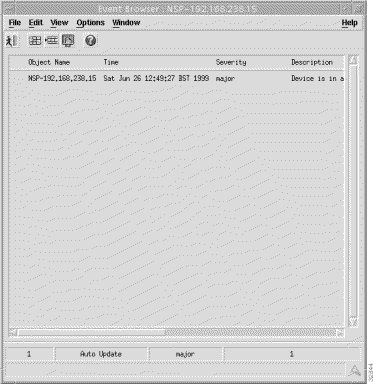
The Event Browser window identifies the Object Name, the Time the alarm occurred, the alarm Severity and a brief Description of the alarm.
For more details, double-click on a selected event to view the Full Event Description window.
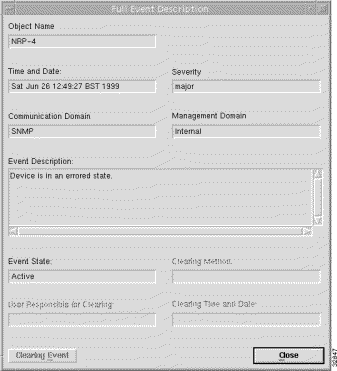
The Full Event description window displays the following information:
Step 3 Click Close to exit the Full Event Description window.
Step 4 Click Close to exit the Event Browser window.
Refer to the CEMF User Guide for further information on Event Browser.
Additionally, the Cisco 6400 SCM can be complemented by the addition of the CEMF Event Manager application. This application enables you to set thresholds, monitoring any supported Cisco 6400 SCM MIB variable (that is, those which appear on the Cisco 6400 SCM windows). One example of a supported Cisco 6400 SCM MIB variable is the "total connections" variable, which details the number of connections currently existing at the specified ATM port. With the CEMF Event Manager, you can set up a polling regime to periodically check the value of the total connections variable. When the total connections variable exceeds a user-defined limit (as specified in the threshold regime), the CEMF Event Manager raises a CEMF event against the relevant ATM port. This event appears in the Map Viewer and Event Browser and can be sent to a pager, by trouble ticket or e-mail message (as appropriate) through the Event Manager "Notification" facility, thereby providing an automated capacity and resource management application for the Cisco 6400 UAC.
The Cisco 6400 SCM software processes four traps sent from the Cisco 6400 UAC hardware:
1. Cisco6400ChassisChangeNotification --- raised when a 6400 component (such as an NRP) fails or is pulled out for various reasons (for example, a hot swap component change). This trap stimulates chassis rediscovery and ensures that the 6400 Chassis Map accurately reflects the status of the 6400 components.
2. Cisco6400ChassisFailureNotification --- raised on Power Supply Units (PSUs), fan or chassis temperature failure to show an event condition against the appropriate 6400 component. This trap facilitates simpler problem diagnosis and stimulates chassis rediscovery.
3. LinkUp --- signifies that the SNMPv2 entity, acting in an agent role, has detected that the ifOperStatus object for one of its communication links left the down state and changed into some other state (but not into the notPresent state). This other state is indicated by the included value of ifOperStatus.
4. LinkDown --- signifies that the SNMPv2 entity, acting in an agent role, has detected that the ifOperStatus object for one of its communication links is about to enter the down state from some other state (but not from the notPresent state). This other state is indicated by the included value of ifOperStatus.
Table 2-2 shows mapping between the alarms raised in the chassis alarm table and the traps that are dispatched from the Cisco 6400 UAC. For a simple integrated fault management solution, the SCM uses mapping to raise alarms on CEMF objects.
| Alarm | Trap |
coreTemp | ChassisFail |
inletTemp | ChassisFail |
totalFanFail | ChassisFail |
partialFanFail | ChassisFail |
fanMissing | ChassisFail |
pem0Fail | ChassisFail |
pem1Fail | ChassisFail |
sonetLineFail | linkUp / linkDown |
cardOIRAlarm | ChassisChange |
cardFail | ChassisChange |
cardPartialFail | ChassisChange |
The Cisco 6400 SCM uses both traps (detailed in Table 2-2) and the alarms raised in the chassis alarm table sent from the Cisco 6400 UAC to raise event conditions against the appropriate Cisco 6400 component. Alarms on the Faults tab in the Cisco 6400 Chassis Management window are represented explicitly against each object on which they occur. This allows any problems that exist involving the chassis/NSP, NRP, line card or ATM port objects to be quickly identified by the change of color severity.When an alarm exists its color severity is either yellow (indicating a minor alarm), orange (indicating a major alarm), or red (indicating a critical alarm). Full alarm descriptions can then be viewed using Event Browser.
Alarms that occur on physical objects are raised on the objects in the Cisco 6400 SCM as they occur. Similarly, as the alarm condition on the physical object is cleared, then the alarm against the object is cleared both in the Event Browser and by the color severity.
The Cisco 6400 also stores alarm information in SNMP tables. Because CEMF is based on a protocol-independent event model, these alarm conditions are presented to you in the same manner as SNMP traps.
The following table shows the alarm conditions available from the Cisco 6400 SNMP tables:
| Alarm Message | Alarm Description | Relevant Objects |
coreTemp | Core Temperature Limit | NSP |
inletTemp | Inlet Temperature Limit | NSP |
totalFanFail | Total Fan Failure | NSP |
partialFanFail | Fan Tray Failure | NSP |
fanMissing | Fan Missing | NSP |
pem0Fail | Power Module 0 Failure | NSP |
pem1Fail | Power Module 1 Failure | NSP |
sonetLineFail | Sonet Line Failure | ATMPort |
cardOIRAlarm | Card OIR Alarm for wrong type insertion or removal. | NSP, NRP, LineCard |
cardFail | Card failure alarm for non-redundant card failure or redundant primary card. | NSP, NRP, LineCard |
cardPartialFail | Card failure alarm for redundancy secondary card failure. | NSP, NRP, LineCard |
These alarms are available through the CEMF Event Browser (shown in Figure 2-3), and also through the CEMF Map Viewer (shown in Figure 2-3). These applications serve as a single integrated fault management interface for the Cisco 6400 UAC.
CEMF is an open carrier class management system, designed to integrate with third party products and proprietary operational support systems.
Many different management protocols, both standards-based and proprietary, are supported by CEMF in a transparent manner. New network devices are managed instantly and new management applications can be quickly developed to meet new requirements.
The Map Viewer is the primary entry point into the Cisco 6400 system. When the Map Viewer is launched, a map is displayed corresponding to the highlighted map icon in the hierarchy pane. You can easily monitor the status of all network elements or abstractions of elements contained within the network and you can launch any additional applications available.
The Object Manager is also an entry point into the CEMF system. The Object Manager displays objects in hierarchies, allowing you to navigate to other objects so that services can be invoked on an object.
The Cisco 6400 SCM supports multi-user access. Windows on other workstations are automatically updated to reflect the most recent status changes made to an element by another user when multiple users are present. You can enable or disable these automatic updates.
Additionally, multiple event browsers and map managers can be run on separate client workstations, allowing a number of users to simultaneously monitor the same or distinct portions of the managed network.
All of a user's applications can be run on client workstations that are remote from the server. This means that the load on the server is dependent only on how much data you request from the server. Therefore, the number of users are not limited by the resource footprint of the applications, all of which run on the server.
You can open multiple user sessions in CEMF. Each user session has access to the tools displayed in the Launchpad. Any changes made in a user session are reflected immediately in all other user sessions.
The CEMF login window restricts user access to the Cisco 6400 SCM based on a pre-set name/password combination defined by the system administrator.
The Cisco 6400 SCM maintains a log-in record of users who access the Element Manager windows. This information is provided as ASCII text files, namely c6400Manager.audit and C6400SSManager.audit. These files are found in <AVROOT>/logs.
A map is a graphical representation of related objects being managed. You can define maps in a hierarchy where each node on a map has a submap. You can view different levels of complexity in the managed network by looking at high level maps or by navigating to submaps which represent lower levels of detail in the managed network.
Nodes and links on a map are graphical symbols representing managed or abstracted objects in the network. A node has an iconic representation, while a link has a vector representation. Links can only exist as a connection between two nodes.
Nodes and links can have submaps, creating a hierarchy of browsable maps. Top level maps display administrative or physical network domains; submaps display more detail until actual managed elements are represented.
Network nodes display the current alarm status of a represented object. The alarm status of an object reflects the most severe alarm currently active on an object.
A submap relays the most severe alarm status of all its nodes to the corresponding node on the parent map. The node on the parent map then displays the combined severity of its submap and the node it represents.
This means that you can view a top level map and see the overall status of the entire network. When a node on the map shows a condition or alarm, you can view successive submaps until the source of the condition or alarm appears.
The toolbar at the top of each window contains icons that invoke various tools and menu options. The icons displayed in the toolbar vary depending on which window you are viewing. You can disable the toolbar so that it is not displayed in the window.

The tooltips option displays a brief description of each icon. This description will appear when the cursor is left over the icon. Tooltips is enabled by default.
If you want to view which windows you have open, select the Windows menu option and all currently open windows will be listed.
Throughout CEMF you can access pop up menus from map objects, events listed in the Event Browser, and objects listed in any containment tree. To access these pop up menus, simply right click on the desired object.
Throughout CEMF you can select either individual or multiple items from lists in the various windows.
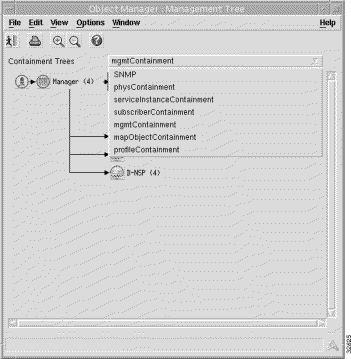
Containment Trees model hierarchical relationships between objects, both physical and logical. Objects are named by Containment Trees and can exist in multiple trees simultaneously by reference.
The Cisco 6400 SCM has six types of Containment Trees:
1. Physical Containment (physContainment)
2. Management Containment (mgmtContainment)
3. Map Object Containment (mapObjectContainment)
4. Service Instance Containment (serviceInstanceContainment)
5. Subscriber Containment (subscriberContainment)
6. Profiles Containment (profileContainment)
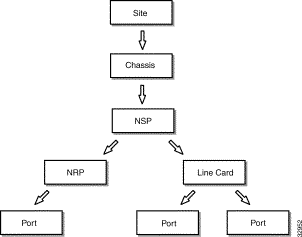
The physical containment reflects the physical relationship of objects and provides relevant information to draw maps.

The management containment populates the object pick lists that appear on the Element Management and the Service Connection Management windows.
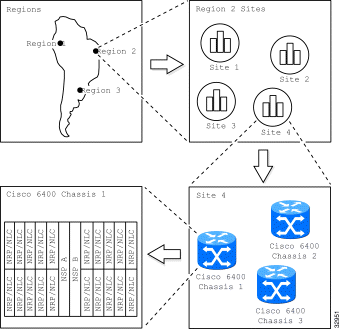
The map object containment reflects the relationship between maps and displays a representation of the chassis front panel contents.
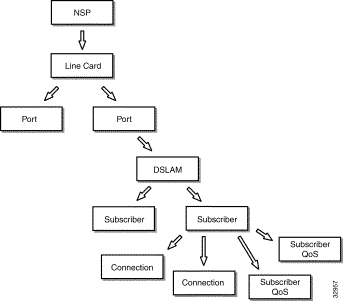
A subscriber is connected to a DSLAM. A subscriber has a number of connection objects which are related to the subscriber by this containment. A connection object links a subscriber to a service instance. A subscriber also has a number of subscriber QoS which are used when the subscriber is connected to a service.
Profile containment is used by the Cisco 6400 SCM to store user generated service and QoS profiles.

A service instance (refer to the "Services" section), exists on either an NRP port or a line card port. A service instance has a number of dynamically created connections that are related to the service instance by this containment. A connection links a subscriber to a service instance.
A service belongs to a specific service category and represents a physical service offered by a service provider (for example, xyz-gold). A service is also referred to as a service profile in the containment trees.
A service instance is a service deployed on a single Cisco 6400 SCM (for example, xyz-gold.mtn-view-1).
The Cisco 6400 UAC offers Layer 2 and Layer 3 services, for example tunneling and bridging. The provisioning of these services is quite a complex task. The 6400 SCM application is designed to help simplify this process.
The Cisco 6400 SCM currently supports the following services:
1. Pure ATM switching service
2. PPP-IP local termination service
3. PPP-L2TP tunneling service
4. Bridged-bridged service
5. Bridged-routed service
6. PPP Termination Aggregation over Multiple Domains (PTA-MD) service
7. Route Bridge Encapsulation (RBE) service
8. RFC1483 routed service
Each service is now discussed in greater detail.
Figure 2-17 shows an instance of a service which belongs to the Pure ATM Switching Service category which exists on the NSP and will connect two ATM ports (Subscriber & Service) on the NSP together.
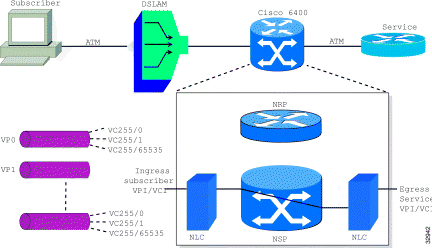
The pure ATM switching service (left to right) connects subscribers using DSLAMs in the Cisco end-to-end DSL architecture via an ATM network or perhaps directly into the 6400, and there on to the service provider terminated by a router typically. In the 6400, then, for the pure ATM switching service, we don't actually use the NRPs (so the router blades are not used here). It is basically an ATM switch. So you configure the ATM service, choose the subscriber, VPI/VCI, choose the service, VPI/VCI and connect it together. The subscriber is therefore connected to the service provider via a pure ATM network without the need for routing functions.
Only the egress (outgoing) ATM port VPI/VCI parameters require to be set up, making the ATM service the simplest 6400 SCM service to set up.
Refer to the "Service/Subscriber Provisioning" section for further details on each of the Cisco 6400 SCM services.
Figure 2-18 shows an instance of a service which belongs to the PPP--IP (Local Termination) Service category which exists on the NRP where the Cisco 6400 is required to terminate PPP connections using the pre-defined IP Addresses, Authentication protocol etc. as defined in the Virtual Template for this particular service. This Virtual Template must be referenced by the Permanent Virtual Circuit (PVC) which is part of the connection.

The subscriber connects to the DSLAM (the protocol between DSLAM and the 6400 is PPP over ATM) and this is routed via the 6400 onto a core IP network. We configure from the incoming subscriber VPI/VCI through to the router (the NRP) and from there on in, the routing is the responsibility of the end customer.
Refer to the IOS documentation supplied with your Cisco 6400 UAC system for details of how to set up the uplink.
Refer to the "Service/Subscriber Provisioning" section for further details on each of the Cisco 6400 SCM services.
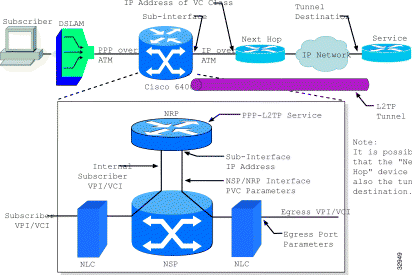
This service involves connecting the subscriber to an upstream service provider (for example, an Internet Service Provider (ISP)) through an L2TP tunnel.
The subscriber traffic is switched by the NSP onto the selected NRP and the tunnels set up between the uplink on the 6400 through the IP network to the service provider. The network architecture may not precisely match that shown in Figure 2-19. The exact network architecture will depend on the service provider requirements. There are a number of parameters required to set up the PPP-L2TP service and there are a number of network elements you must configure.
Refer to the "Service/Subscriber Provisioning" section for further details on each of the Cisco 6400 SCM services.
A bridge lets you connect multiple subscribers into a virtual LAN. The traffic being transmitted in an uplink are between each subscriber depending on how you configure the 6400 service. A bridge group is shown in the NRP in Figure 2-20. The bridge group is responsible for merging all this traffic together and passing it on to the uplink.

Refer to the "Service/Subscriber Provisioning" section for further details on each of the Cisco 6400 SCM services.
The Bridged-Routed service (shown in Figure 2-21) is a slight variant on the Bridged-Bridged service (shown in Figure 2-20).
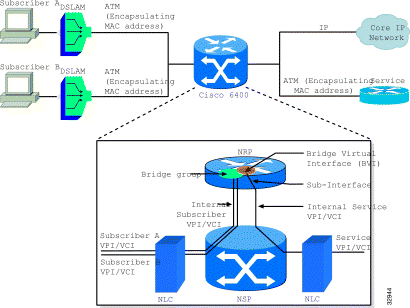
As well as the bridge, there is an amount of routing that takes place within the NRP. Multiple subscribers connected to a bridge group, virtual LAN capability, various types of switching, either on to service providers or on to core IP networks via the NRP.
Refer to the "Service/Subscriber Provisioning" section for further details on each of the Cisco 6400 SCM services.
Refer to the "Service Instance Configuration Window" section for details on each of the parameters displayed on Figure 2-21.
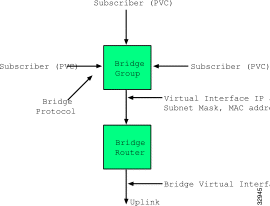
Figure 2-22 shows a conceptual or logical view of the bridge group. Here, for the bridged-routed service, the bridge group takes in the subscribers via the bridge virtual interface and the routing that occurs on the way to the uplink.
Refer to the "Service/Subscriber Provisioning" section for further details on each of the Cisco 6400 SCM services.
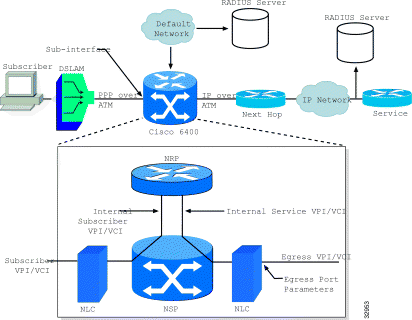
The PPP Termination Aggregation to Multiple Domains (PTA-MD) service (shown in Figure 2-23) is implemented by configuring Service Profiles locally on the NRP-SSG. The service can then be accessed by a subscriber using PPPoA or PPPoE. In the PPPoA case the subscriber can connect to the service, either statically or dynamically. In the PPPoE case the subscriber can only connect to the service dynamically.
Refer to the "Service/Subscriber Provisioning" section for further details on each of the Cisco 6400 SCM services.
Refer to the "PTA-MD Service Configuration Window" section for details on each of the parameters displayed on Figure 2-23.
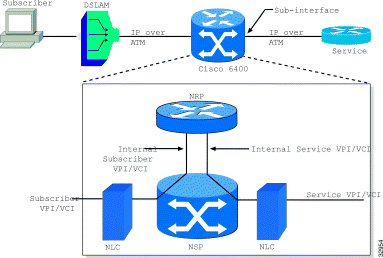
The Route Bridge Encapsulation (RBE) service (shown in Figure 2-24) is a layer 3 service that allows a subscriber to connect to a service dynamically without requirement to add static routes.
Refer to the "Service/Subscriber Provisioning" section for further details on each of the Cisco 6400 SCM services.
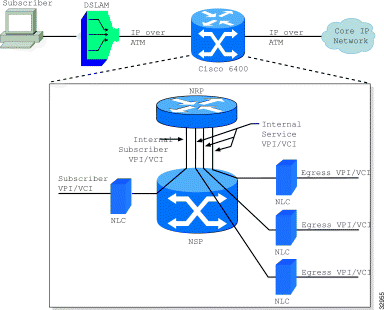
The RFC1483 Routing service (shown in Figure 2-25) connects subscribers to (potentially) multi point service uplink PVCs (residing within an uplink sub-interface), using AAL5 SNAP encapsulation to carry IP traffic over ATM. The IP traffic is routed by the NRP as required. This service is currently the only SCM-supported service that permits uplink PVCs.
Refer to the "Service/Subscriber Provisioning" section for further details on each of the Cisco 6400 SCM services.
![]()
![]()
![]()
![]()
![]()
![]()
![]()
![]()
Posted: Tue Feb 1 14:04:42 PST 2000
Copyright 1989 - 2000©Cisco Systems Inc.