|
|

The 6400 SCM Element Manager add custom windows to the standard Cisco EMF system in order to allow the management of the Cisco 6400 UAC. For example, the Cisco 6400 Chassis Management window has four tabbed sections: Faults, Status, Configuration, and Inventory. Each tab displays specific information about the current state of the system or allows you to change various 6400 UAC settings without the need to use IOS commands.
Multiple Element Managers can be installed onto a single Cisco EMF Server, thereby allowing multi-device and multi-vendor management from a single system.
Table 4-1 displays the Element Manager windows that can be launched from each node/object type. For example, to Manage the 6400 Chassis you should select the Cisco 6400 UAC, Manage, Chassis option from a Manager, Site, Chassis or NSP object.
| Task | Launch Point | |||||||
| Manager | Site | Chassis | NSP | NRP | NRP Port | Line Card | Line Card Port | |
Manage 6400 Chassis | Yes | Yes | Yes | Yes | No | No | No | No |
Manage NSP | Yes | Yes | Yes | Yes | No | No | No | No |
View NSP Logs | Yes | Yes | Yes | Yes | No | No | No | No |
Manage NRP | Yes | Yes | Yes | Yes | Yes | No | No | No |
View NRP Logs | Yes | Yes | Yes | Yes | Yes | No | No | No |
Manage NRP ATM Port | Yes | Yes | Yes | Yes | Yes | Yes | No | Yes |
Manage Line Card | Yes | Yes | Yes | Yes | No | No | Yes | No |
Manage Line Card ATM Port | Yes | Yes | Yes | Yes | No | Yes | Yes | Yes |
Manage Redundancy | Yes | Yes | Yes | Yes | No | No | No | No |
Manage SONET APS | Yes | Yes | Yes | Yes | No | No | No | No |
Admin, Download NSP IOS Image | Yes | Yes | Yes | Yes | No | No | No | No |
Admin, Download NRP IOS Image | Yes | Yes | Yes | Yes | Yes | No | No | No |
Performance Manager | No | No | No | Yes | Yes | Yes | No | Yes |
Telnet Session | No | No | No | Yes | Yes | No | No | No |
WebConsole | No | No | No | Yes | No | No | No | No |
The Cisco 6400 Chassis Management window is divided into four tabbed sections, as shown in the "Cisco 6400 Chassis Management Window" section.
Select the Cisco 6400 UAC, Manage, Chassis option from a relevant network map, a relevant object in the object manager or by using an object pick list on an open Element Manager window. Refer to Table 4-1 for information on which maps nodes or objects allow you to launch the Cisco 6400 Chassis Management window.
The Cisco 6400 Chassis Management window appears with the Faults tab displayed.
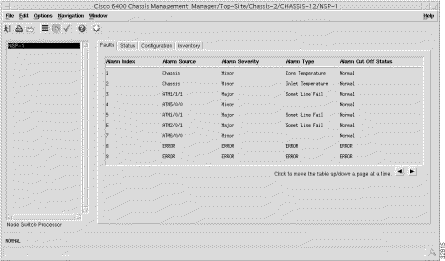
The Faults tab allows you to view a log of alarms raised against the selected chassis. Refer to the "Faults Tab" section for further information.
To view the Status tab:
Step 1 Open the Cisco 6400 Chassis Management window.
Step 2 Select the Status tab.
The status information for the selected chassis appears. Refer to the "Status Tab" section for further information.
To view the Configuration tab:
Step 1 Open the Cisco 6400 Chassis Management window.
Step 2 Select the Configuration tab.
The Cisco 6400 Chassis configuration information appears.
Step 3 Alter the information as required using the menus and data entry boxes.
Step 4 Save the changes.
Refer to the "Configuration Tab" section for further information.
To view the Inventory tab:
Step 1 Open the Cisco 6400 Chassis Management window.
Step 2 Select the Inventory tab.
The Inventory tab appears. Refer to the "Inventory Tab" section for further information.
The NSP Management window allows you to monitor and configure installed NSPs.
The Cisco 6400 NSP Management window is divided into five tabbed sections.
To view the Cisco 6400 NSP Management window, proceed as follows:
Select the Cisco 6400 UAC, Manage, NSP option from a relevant network map, a relevant object in the object manager or by using an object pick list on an open Element Manager window.
Refer to Table 4-1 for information on which maps nodes or objects allow you to launch the Cisco 6400 NSP Management window.
The Cisco 6400 NSP Management window appears with the Faults tab displayed as default.

To view the Faults tab:
Step 1 Open the Cisco 6400 NSP Management window. Refer to the "Viewing the Cisco 6400 NSP Management Window" section for further details.
The Faults tab appears by default.
Step 2 Select the relevant NSP in the Node Switch Processor list.
The fault information for the selected NSP appears. Refer to the "Faults Tab" section for further information.
To view the Status tab:
Step 1 Open the Cisco 6400 NSP Management window. Refer to the "Viewing the Cisco 6400 NSP Management Window" section for further details.
Step 2 Select the Status tab.
Step 3 Select the relevant NSP.
The status information for the selected NSP appears. Refer to the "Status Tab" section for further information.
To view the Performance tab:
Step 1 Open the Cisco 6400 NSP Management window. Refer to the "Viewing the Cisco 6400 NSP Management Window" section for further details.
Step 2 Select the Performance tab.
Step 3 Select the relevant NSP.
The performance information for the selected NSP appears. Refer to the "Performance Tab" section for further information.
To view the Configuration tab:
Step 1 Open the Cisco 6400 NSP Management window. Refer to the "Viewing the Cisco 6400 NSP Management Window" section for further details.
Step 2 Select the Configuration tab.
Step 3 Select the relevant NSP.
The configuration information for the selected NSP appears.
Step 4 Edit the information in the Configuration tab, as required.
Step 5 Save the changes.
Refer to the "Configuration Tab" section for further information.
To view the Inventory tab:
Step 1 Open the Cisco 6400 NSP Management window. Refer to the "Viewing the Cisco 6400 NSP Management Window" section for further details.
Step 2 Select the Inventory tab.
Step 3 Select the relevant NSP.
The Inventory tab appears.
Refer to the "Inventory Tab" section for further information.
The NSP Logs window allows you to view the event commands stored in the Event command history table and the system log messages stored in the syslog Message table for the selected NSP.
Select the Cisco 6400 UAC, View, NSP Logs option from a relevant network map, a relevant object in the object manager or by using an object pick list on an open Element Manager window. Refer to Table 4-1 for information on which maps nodes or objects allow you to launch the NSP Logs window.
The NSP Logs window appears with the Event Command History tab displayed.
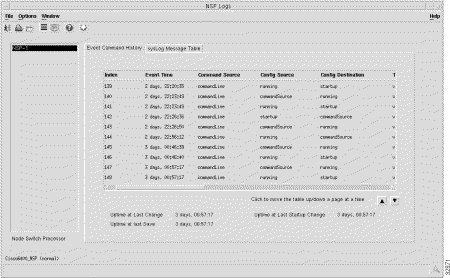
The NSP Logs window is divided into two tabbed sections: the Event Command History tab and the sysLog Message Table tab.
To view the Event Command History tab:
Step 1 Open the NSP Logs window. Refer to the "Viewing the Cisco 6400 NSP Logs Window" section for further details.
The Event Command History tab appears by default.
Step 2 Select the relevant NSP.
The Event Command History table appears for the selected NSP. Refer to the "Event Command History Tab" section for further information on the attributes.
Step 3 Scroll through the list of event commands (using the arrow keys) until the relevant event command appears. The down arrow displays the next ten entries and the up arrow displays the previous ten entries.Use the horizontal scroll bar to view all the table entries. Drag the scroll bar until the relevant information appears. You can change the width of each column if necessary to view fault strings clearly (see below).
To change the width of a column:
Step 1 Open the relevant window displaying a table.
Step 2 Place the cursor to the left of a column heading and move the cursor until it changes to a double arrow.
Step 3 Click and hold the left mouse button when the cursor changes.
Step 4 Drag the cursor until the column is at the required width.
Step 5 Release the mouse button.
Any text wider than the column is truncated. The columns widths return to the default widths when you close this window.
To view the sysLog Message Table tab:
Step 1 Open the NSP Logs window. Refer to the "Viewing the Cisco 6400 NSP Logs Window" section for further details.
Step 2 Select the sysLog Message Table tab.
Step 3 Select the relevant NSP.
The sysLog Message Table appears for the selected NSP. Refer to the "SysLog Message Table Tab" section for further information.
Step 4 Scroll through the list of system messages using the arrow keys until the you find the information you want. The right arrow displays the next ten entries and the left arrow displays the previous ten entries.
You can view all the table entries by using the horizontal scroll bar. Click and drag the scroll bar until you see the information you want. You can change the width of each column if necessary (refer to the "Changing Column Width" section).
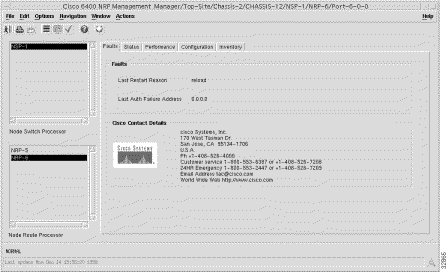
The NRP Management window is divided into five tabbed sections: Faults, Status, Performance, Configuration, Inventory.
Select the Cisco 6400 UAC, Manage, NRP option from a relevant network map, a relevant object in the object manager or by using an object pick list on an open Element Manager window. Refer to Table 4-1 for information on which maps nodes or objects you can select to launch the Cisco 6400 NRP Management window.
The Cisco 6400 NRP Management window appears with the Faults tab displayed.
To view the Faults tab:
Step 1 Open the Cisco 6400 NRP Management window. Refer to the "Viewing the Cisco 6400 NRP Management Windows" section for further details.
Step 2 The Faults tab appears by default.
Step 3 Select the relevant NSP and NRP.
The fault information for the selected NRP appears. Refer to the "Faults Tab" section for further information.
To view the Status tab:
Step 1 Open the Cisco 6400 NRP Management window. Refer to the "Viewing the Cisco 6400 NRP Management Windows" section for further details.
Step 2 Select the Status tab.
Step 3 Select the relevant NSP and NRP.
The status information for the selected NRP appears. Refer to the "Status Tab" section for further information.
To view the Performance tab:
Step 1 Open the Cisco 6400 NRP Management window. Refer to the "Viewing the Cisco 6400 NRP Management Windows" section for further details.
Step 2 Select the Performance tab.
Step 3 Select the relevant NSP and NRP.
The performance information for the selected NRP appears. Refer to the "Performance Tab" sectionfor further information.
To view the Configuration tab:
Step 1 Open the Cisco 6400 NRP Management window. Refer to the "Viewing the Cisco 6400 NRP Management Windows" section for further details.
Step 2 Select the Configuration tab.
Step 3 Select the relevant NSP and NRP.
The configuration information for the selected NRP appears.
Step 4 Change the information as required in the drop down lists and data entry boxes.
Step 5 Save the changes.
Refer to the "Configuration Tab" section for further information.
Step 1 Open the Cisco 6400 NRP Management window. Refer to the "Viewing the Cisco 6400 NRP Management Windows" section for further details.
Step 2 Select the Configuration tab.
Step 3 Select the relevant NSP and NRP.
The state of the selected card appears at the bottom left-hand-corner of the window.
Step 4 Click Commission when Decommissioned appears (at the bottom left-hand-corner of the window).
The NRP is now commissioned and its state changes to Normal.
Step 1 Open the Cisco 6400 NRP Management window. Refer to the "Viewing the Cisco 6400 NRP Management Windows" section for further details.
The Line Card tab appears by default.
Step 2 Select the relevant NSP and NRP.
The state of the selected card appears at the bottom left-hand-corner of the window.
Step 3 Click Decommission when Commissioned appears.
The selected NRP is now decommissioned and the state changes to Decommissioned.
To view the Inventory tab:
Step 1 Open the Cisco 6400 NRP Management window. Refer to the "Viewing the Cisco 6400 NRP Management Windows" section for further details.
Step 2 Select the SSG Configuration tab.
Step 3 Select the relevant NSP and NRP.
Refer to the "SSG Configuration Tab" section for further information.
To view the More SSG Configuration tab:
Step 1 Open the Cisco 6400 NRP Management window. Refer to the "Viewing the Cisco 6400 NRP Management Windows" section for further details.
Step 2 Select the More SSG Configuration tab.
Step 3 Select the relevant NSP and NRP.
Refer to the "More SSG Configuration Tab" section for further information.
To view the Inventory tab:
Step 1 Open the Cisco 6400 NRP Management window. Refer to the "Viewing the Cisco 6400 NRP Management Windows" section for further details.
Step 2 Select the Inventory tab.
Step 3 Select the relevant NSP and NRP.
Refer to the "Inventory Tab" section for further information.
The NRP Logs window allows you to view commands stored in the Event Command History table and the system log messages stored in the syslog Message table for the selected NRP.
Select the Cisco 6400 UAC, View, NRP Logs option from a relevant network map, a relevant object in the object manager or by using an object pick list on an open Element Manager window.
Refer to Table 4-1 for information on which maps nodes or objects allow you to launch the NRP Logs window.
The NRP Logs window appears with the Event Command History tab displayed.

To view the Event Command History tab:
Step 1 Open the Cisco 6400 NRP Logs window. Refer to the "Viewing the Cisco 6400 NRP Logs Window" section for further details.
The Event Command History tab appears by default.
Step 2 Select the relevant NSP and NRP.
The Event Command History table for the selected NRP appears. Refer to the "Event Command History Tab" section for further information.
Step 3 Scroll through the list of event commands until the you find the event command you want using the arrow keys. The down arrow displays the next ten entries; the up arrow displays the ten previous entries. To view all the table entries, you need to use the horizontal scroll bar. Drag the scroll bar until the relevant information appears. You can change the width of each column (refer to the "Changing Column Width" section).
To view the sysLog Message Table tab:
Step 1 Open the Cisco 6400 NRP Logs window. Refer to the "Viewing the Cisco 6400 NRP Logs Window" section for further details.
Step 2 Select the sysLog Message Table tab.
Step 3 Select the relevant NSP and NRP.
The sysLog Message table for the selected NRP appears. Refer to the "SysLog Message Table Tab" section for further information.
Step 4 Scroll through the list of system messages until the you find the messages you want, using the arrow keys. The right arrow displays the next ten entries and the left arrow displays the ten previous entries. To view all the table entries you need to use the horizontal scroll bar. Drag the scroll bar until the relevant information appears. You can change the width of each column (refer to the "Changing Column Width" section).
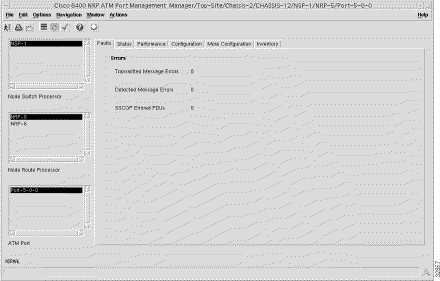
The NRP ATM Port Management window is divided into six tabbed sections: Faults, Status, Performance, Configuration, More Configuration, and Inventory.
Select the Cisco 6400 UAC, Manage, NRP ATM Port option from a relevant network map, a relevant object in the object manager or by using an object pick list on an open Element Manager window. Refer to Table 4-1 for information on which maps nodes or objects allow you to launch the Cisco 6400 NRP ATM Port Management window.
The Cisco 6400 NRP ATM Port Management window appears with the Faults tab displayed.
To view the Faults tab:
Step 1 Open the Cisco 6400 NRP ATM Port Management window. Refer to the "Viewing the Cisco 6400 NRP ATM Port Management Window" section for further details.
The Faults tab appears by default.
Step 2 Select the relevant NSP, NRP and ATM Port.
The fault information for the selected ATM Port appears. Refer to the "Faults Tab" section for further information.
To view the Status tab:
Step 1 Open the Cisco 6400 NRP ATM Port Management window. Refer to the "Viewing the Cisco 6400 NRP ATM Port Management Window" section for further details.
Step 2 Select the Status tab.
Step 3 Select the relevant NSP, NRP and ATM Port.
The status information for the selected ATM Port appears. Refer to the "Status Tab" section for further information.
To view the Performance tab:
Step 1 Open the Cisco 6400 NRP ATM Port Management window. Refer to the "Viewing the Cisco 6400 NRP ATM Port Management Window" section for further details.
Step 2 Select the Performance tab.
Step 3 Select the relevant NSP, NRP and ATM Port.
The performance information for the selected NRP appears. Refer to the "Performance Tab" section for further information.
To view the Configuration tab:
Step 1 Open the Cisco 6400 NRP ATM Port Management window. Refer to the "Viewing the Cisco 6400 NRP ATM Port Management Window" section for further details.
Step 2 Select the Configuration tab.
Step 3 Select the relevant NSP, NRP and ATM Port.
The configuration information for the selected ATM Port appears. Refer to the "Configuration Tab" section for further information.
Step 4 Change the information displayed, as required.
Step 5 Save the changes.
To view the More Configuration tab:
Step 1 Open the Cisco 6400 NRP ATM Port Management window. Refer to the "Viewing the Cisco 6400 NRP ATM Port Management Window" section for further details.
Step 2 Select the More Configuration tab.
Step 3 Select the relevant NSP, NRP and ATM Port.
The configuration information for the selected ATM port appears. Refer to the "More Configuration Tab" section for further information.
Step 4 Change the information as required.
Step 5 Save the changes.
Step 1 Open the Cisco 6400 NRP ATM Port Management window. Refer to the "Viewing the Cisco 6400 NRP ATM Port Management Window" section for further details.
Step 2 Select the More Configuration tab.
Step 3 Select the relevant NSP, NRP and ATM Port.
The state of the selected card appears at the bottom left-hand-corner of the window.
Step 4 Click Commission when Decommissioned appears.
The NRP ATM Port is now commissioned and the state changes to Normal.
Step 1 Open the Cisco 6400 NRP ATM Port Management window. Refer to the "Viewing the Cisco 6400 NRP ATM Port Management Window" section for further details.
Step 2 Select the More Configuration tab.
Step 3 Select the relevant NSP, NRP and ATM Port.
The state of the selected card appears at the bottom left-hand corner of the window.
Step 4 Click Decommission.
The NRP ATM port is now Decommissioned and the state changes to Decommissioned.
To view the Inventory tab:
Step 1 Open the Cisco 6400 NRP ATM Port Management window. Refer to the "Viewing the Cisco 6400 NRP ATM Port Management Window" section for further details.
Step 2 Select the Inventory tab.
Step 3 Select the relevant NSP, NRP and ATM Port.
The Inventory tab appears for the selected ATM Port. Refer to the "Inventory Tab" section for further information.
The Cisco 6400 Line Card Management window has a single tabbed section.
Select the Cisco 6400 UAC, Manage, Line Card option from a relevant network map, a relevant object in the object manager or by using an object pick list on an open Element Manager window.
Refer to Table 4-1 for information on which maps nodes or objects allow you to launch the Cisco 6400 Line Card Management window.
The Cisco 6400 Line Card Management window appears with the Line Card tab displayed.
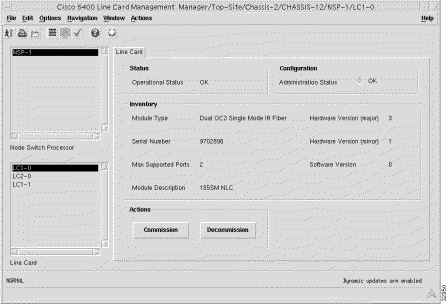
To view the Line Card tab:
Step 1 Open the Cisco 6400 Line Card Management window. Refer to the "Viewing the Cisco 6400 Line Card Management Window" section for further details.
Step 2 Select the relevant NSP and Line Card. Status information for the selected Line Card appears. Refer to the "Line Card Tab" section for further information.
Step 1 Open the Cisco 6400 Line Card Management window. Refer to the "Viewing the Cisco 6400 Line Card Management Window" section for further details.
Step 2 Select the relevant NSP and Line Card.
The state of the selected Line Card appears at the bottom left-hand-corner of the window.
Step 3 Click Commission. The state of the Line Card changes to Commissioned.
Step 1 Open the Cisco 6400 Line Card Management window. Refer to the "Viewing the Cisco 6400 Line Card Management Window" section for further details.
Step 2 Select the relevant NSP and Line Card.
The state of the selected card appears at the bottom left-hand-corner of the window.
Step 3 Click Decommission. The state of the Line Card changes to Decommissioned.
The Cisco 6400 Line Card ATM Port Management window is divided into six tabbed sections: Faults, Status, Performance, Configuration, More Configuration, and Inventory.
Select the Cisco 6400, Manage, Line Card ATM Port option from a relevant network map, a relevant object in the object manager or by using an object pick list on an open Element Manager window.
The Cisco 6400 Line Card ATM Port Management window appears with the Faults tab displayed. Refer to Table 4-1 for information on which maps nodes or objects allow you to launch the Cisco 6400 Line Card ATM Port Management window.

To view the Faults tab:
Step 1 Open the Cisco 6400 Line Card ATM Port Management window. Refer to the "Viewing the Cisco 6400 Line Card ATM Port Management Window" section for further details.
The Faults tab appears.
Step 2 Select the relevant NSP, Line Card and ATM Port. The fault information for the selected ATM Port appears. Refer to the "Faults Tab" section for further information.
To view the Status tab:
Step 1 Open the Cisco 6400 Line Card ATM Port Management window. Refer to the "Viewing the Cisco 6400 Line Card ATM Port Management Window" section for further details.
Step 2 Select the Status tab.
Step 3 Select the relevant NSP, Line Card and ATM Port. The status information for the selected ATM port appears. Refer to the "Status Tab" section for further information.
To view the Performance tab:
Step 1 Open the Cisco 6400 Line Card ATM Port Management window. Refer to the "Viewing the Cisco 6400 Line Card ATM Port Management Window" section for further details.
Step 2 Select the Performance tab.
Step 3 Select the relevant NSP, Line Card and ATM Port. The performance information for the selected ATM Port appears. Refer to the "Performance Tab" section for further information.
To view the Configuration tab:
Step 1 Open the Cisco 6400 Line Card ATM Port Management window. Refer to the "Viewing the Cisco 6400 Line Card ATM Port Management Window" section for further details.
Step 2 Select the Configuration tab.
Step 3 Select the relevant NSP, Line Card and ATM Port. The configuration information for the selected ATM Port appears.
Step 4 Change the information as required using the drop down lists.
Step 5 Save the changes. Refer to the "Configuration Tab" section for further information.
To view the More Configuration tab:
Step 1 Open the Cisco 6400 Line Card ATM Port Management window. Refer to the "Viewing the Cisco 6400 Line Card ATM Port Management Window" section for further details.
Step 2 Select the More Configuration tab.
Step 3 Select the relevant NSP, Line Card and ATM Port. The configuration information for the selected ATM Port appears. Refer to the "More Configuration Tab" section for further information.
Step 4 Change the information as required.
Step 5 Save the changes.
Step 1 Open the Cisco 6400 Line Card ATM Port Management window. Refer to the "Viewing the Cisco 6400 Line Card ATM Port Management Window" section for further details.
Step 2 Select the More Configuration tab.
Step 3 Select the relevant NSP, Line Card and ATM Port. The state of the selected port appears at the bottom left-hand-corner of the window.
Step 4 Click Commission.
The line card ATM Port is commissioned and the state changes to Normal.
Step 1 Open the Cisco 6400 Line Card ATM Port Management window. Refer to the "Viewing the Cisco 6400 Line Card ATM Port Management Window" section for further details.
Step 2 Select the More Configuration tab.
Step 3 Select the relevant NSP, Line Card and ATM Port.
The state of the selected port appears at the bottom left-hand-corner of the window.
Step 4 Click Decommission. The line card ATM Port is now Decommissioned.
To view the Inventory tab:
Step 1 Open the Cisco 6400 Line Card ATM Port Management window.
Step 2 Select the Inventory tab.
Step 3 Select the relevant NSP, Line Card, and ATM Port. The Inventory information appears for the selected ATM Port. Refer to the "Inventory Tab" section for further information.
The Redundancy window allows you to specify the redundancy pairings for CPUs (NSPs), slots (NRPs), and sub-slots (line cards). The Redundancy window is divided into three tabbed sections: NSP Redundancy, Slot Redundancy, and Sub-Slot Redundancy.
Select the Cisco 6400 UAC, Manage, Redundancy option from a relevant network map, a relevant object in the object manager or by using an object pick list on an open Element Manager window. Refer to Table 4-1 for information on which maps nodes or objects allow you to launch the Cisco 6400 Redundancy Configuration window.
The Cisco 6400 Redundancy Configuration window appears with the NSP Redundancy tab displayed.
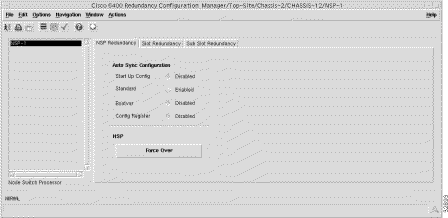
To set up NSP Redundancy pairings:
Step 1 Open the Cisco 6400 Redundancy Configuration window. Refer to the "Viewing the Cisco 6400 Redundancy Configuration Window" section for further details.
The NSP Redundancy tab appears.
Step 2 Select the relevant NSP.
Step 3 Change the information, as required. Refer to the "NSP Redundancy Tab" section for further information.
Step 4 Press Force Over to switch between the active NSP and the secondary NSP.
Step 5 Save any changes made.
To set up Slot Redundancy pairings:
Step 1 Open the Cisco 6400 Redundancy Configuration window. Refer to the "Viewing the Cisco 6400 Redundancy Configuration Window" section for further details.
Step 2 Select the Slot Redundancy tab. Refer to the "Slot Redundancy Tab" section for further information.
Step 3 Select the relevant NSP.
Step 4 Change the information, as required.
Step 5 Save any changes made.
To set up Sub-Slot Redundancy pairings:
Step 1 Open the Cisco 6400 Redundancy Configuration window. Refer to the "Viewing the Cisco 6400 Redundancy Configuration Window" section for further details.
Step 2 Select the Sub Slot Redundancy tab.
Step 3 Select the relevant NSP.
Step 4 Change the information displayed as required. Refer to the "Sub Slot Redundancy Tab" section for further information.
Step 5 Save any changes made.
Select the Cisco 6400 UAC, Manage, SONET APS option from a relevant network map, a relevant object in the object manager or by using an object pick list on an open Element Manager window.
Refer to Table 4-1 for information on which maps nodes or objects allow you to launch the SONET APS window.
The SONET APS window appears with the Statistics tab displayed.
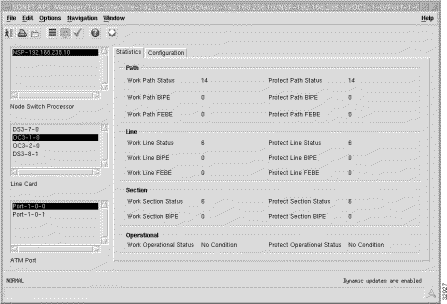
To view the SONET APS statistics for a specified port:
Step 1 Open the SONET APS window. Refer to the "Viewing the SONET APS Manager Window" section for further details.
Step 2 Select the relevant NSP, Line Card and ATM Port.
The statistics for the selected ATM Port appear. Refer to the "Statistics Tab" section for further information.
To change SONET APS configuration information for a specified port:
Step 1 Open the SONET APS window. Refer to the "Viewing the SONET APS Manager Window" section for further details.
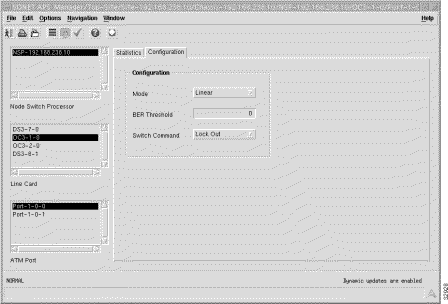
Step 2 Select the Configuration tab.
Step 3 Select the relevant NSP, Line Card and ATM Port.
The configuration information for the selected ATM Port appears.
Step 4 Alter the information displayed as required.
Step 5 Save the changes made. Refer to the "Configuration Tab" section for further information.
The Backup/Restore Manager window has one tabbed section that allows you to upload the current Cisco 6400 SCM running configuration from a specified 6400 and save it as a file to any Trivial File Transfer Program (TFTP) server. This file can later be downloaded from the specified TFTP server to a user specified 6400.
Regular configuration backups allow recovery in the unlikely event of a hardware failure. For example, if an NPR were to fail, a replacement NRP could be inserted into the chassis and the configuration data would be restored. Changes in configuration data between the last backup and the time of the failure would be lost.
Select the Cisco 6400 UAC, Admin, Backup/Restore option from a relevant network map, a relevant object in the object manager or by using an object pick list on an open Element Manager window.
Refer to Table 4-1 for information on which maps nodes or objects allow you to launch the Backup/Restore Manager window.
The Backup/Restore Manager window appears with the Backup/Restore tab displayed.
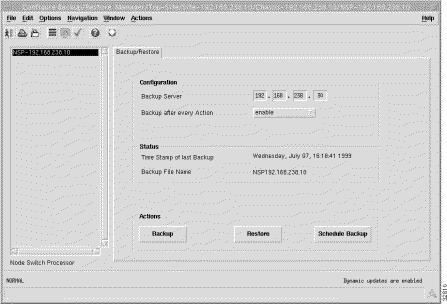
To view the Backup/Restore tab:
Step 1 Open the Backup/Restore window. Refer to the "Viewing the Backup/Restore Manager Window" section for further details.
Step 2 Select the relevant NSP.
The backup/restore information for the Cisco 6400 SCM appears. Refer to the "Backup/Restore Tab" section for further information.
The IOS Image Download for NSP/NRP Management window has a single tabbed section which allows a 6400 firmware/IOS release to one or more user-selected NSPs and NRPs at a user specified time.
Select the Cisco 6400 UAC, Admin, Download, NSP/NRP IOS Image option from a relevant network map, a relevant object in the object manager or by using an object pick list on an open Element Manager window.
Refer to Table 4-1 for information on which map nodes or objects allow you to launch the IOS Image Download for NSP/NRP window.
The IOS Image Download for NSP window appears with the Download tab displayed.
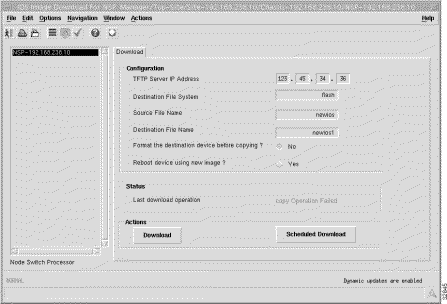
To view the Download tab:
Step 1 Open the IOS Image Download for NSP window. Refer to the "Viewing the IOS Image Download for NSP Window" section for further details.
Step 2 Select the relevant NSP.
The download information for the Cisco 6400 SCM appears. Refer to the "Download Tab" section for further information.
You can launch a telnet session from an icon representing an NSP or NRP in the MapViewer or Object Manager.
To launch a telnet session:
Step 1 Place the cursor over an icon representing an NSP or NRP.
Step 2 Press and hold the right mouse button.
Step 3 Drag the cursor until the Technology Specific Tools, Initiate Telnet Session option is highlighted.
Step 4 Release the mouse button. A telnet window appears.
Step 5 Enter the required password. Refer to the Cisco 6400 UAC Software Configuration Guide Text Part Number: 78-5785-01 for further telnet information.
You can launch Netscape and open the URL representing the home page of the embedded NSP HTTP server application (known as the WebConsole) from an icon representing an NSP in the MapViewer or the Object Manager.
Step 1 Place the cursor over an icon representing an NSP.
Step 2 Press and hold the right mouse button.
Step 3 Drag the cursor until the Technology Specific Tools, WebConsole option is highlighted.
Step 4 Release the mouse button.
A password window appears. Enter the required user ID and password.
A window appears providing access to the Cisco WebConsole product. For further information on WebConsole, refer to the Cisco 6400 UAC Software Configuration Guide Text Part Number: 78-5785-01.
The Cisco 6400 SCM allows you to enter Site and Contact information for each site object. To enter or edit information, proceed as follows:
To view and edit Site Information, proceed as follows:
Step 1 Select a Site object in the Map Viewer or Object Manager application with the right mouse button, a pop-up menu appears.
Step 2 Select the Site Information option.
The Site Information screen appears:
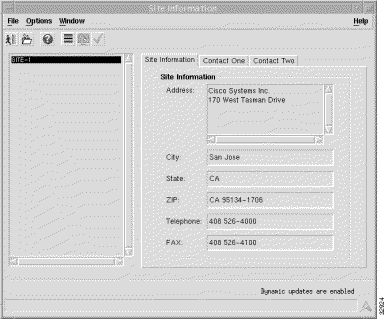
The Site Information screen has three tabbed sections, as follows:
Step 3 Enter information into each of the data entry boxes (as required) in the Site Information tab to identify the location of the site.
Step 4 Select the Contact One tab.
A screen similar to Figure 4-15 appears:
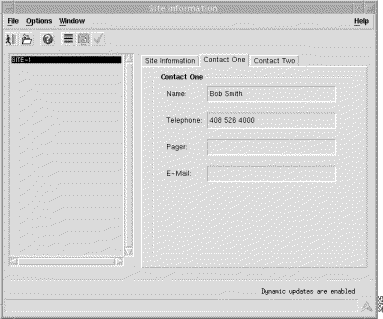
Step 5 Enter information into each of the data entry boxes as required, to provide personal contact details for an individual at the site.
Step 6 Select the Contact Two tab.
Step 7 Enter the details of a second contact person at the selected site.
Step 8 Select the Save option from the File menu to save the Site Information.
Step 9 Click the Close icon.
The Cisco 6400 SCM allows you to enter Notes for each site object. To enter or edit information, proceed as follows:
Step 1 Select a Site object in MapViewer or Objects manager application with the right mouse button, a pop-up menu appears.
Step 2 Select the Notes option.
The Notes screen appears:
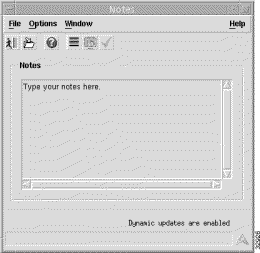
Step 3 Enter information into the Notes section.
Step 4 Click the Save icon to save changes.
Step 5 Click the Close icon.
An important component of efficient network management is the ability to receive performance information on a large network of many devices. This performance information can assist you to pro-actively manage your network elements.
Performance Manager is a powerful, flexible tool able to view general and performance specific attributes in one application and in a variety of formats (for example, graphs and tables). You define the attributes or parameters, choose the objects you want to view, select the date and time of the view, and set the summary interval.
Performance Manager can be accessed from map objects, events listed in the Event Browser and objects listed in any containment tree that represent an object type included in the relevant data file. Performance Manager can be accessed from NSP, NRP, NRP port or line card port objects by right-clicking on an object.
Step 1 Open the appropriate window to display a relevant element.
Step 2 Place the cursor over the element.
Step 3 Press and hold the right mouse button. A menu appears.
Step 4 Drag the cursor until the AV Tools, Open Performance Manager option is highlighted.
Step 5 Release the right mouse button. The Performance Manager window appears.
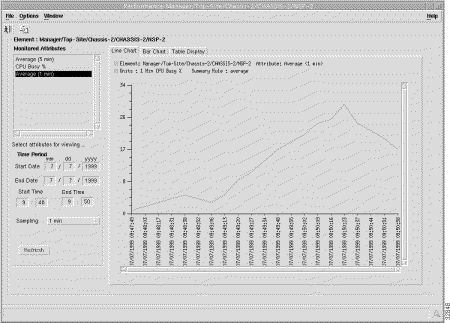
From the Performance Manager window you can:
To view performance statistics: select the attributes' performance statistics to be displayed; the time period that the performance statistics were gathered; and the format you want to use to display the results. Refer to the following steps for details.
Step 1 Open Performance Manager. Refer to the "Viewing the Performance Manager Window" section for further details.
Step 2 Select the attribute you want to monitor from the Monitored Attributes list.
Step 3 Enter the date to start viewing the performance statistics from in the Start Date data entry box. Use the mm/dd/yyyy format.
Step 4 To set the End Date you have two options:
In the End Date data entry boxes, enter the date the view of the performance statistics has to stop at. The format must be <mm>/<dd>/<yyyy>
or
select the Now check box to view the data from the selected start date to the current time. By selecting this option, you do not have to update the End Date and End Time fields.
Step 5 Enter the time that the view of the performance statistics has to start on the Start Date in the Start Time data entry boxes.
Step 6 Enter the time that the view of the performance statistics has to stop on the Stop Date in the Stop Time data entry boxes.
Step 7 Select the summary period you want to use in the Sampling list.
Step 8 Click Refresh. The Refresh button is blue when it is available for selection. It is greyed out when not available. The Refresh button is available for selection when Now is selected, or when any criteria has changed and you have moved the cursor away from the changed value by pressing the Tab key or by using the mouse.
The performance information appears as a line chart by default. You can view performance information as either a line chart, a bar chart, or a table display.
The performance information corresponds to the attributes' value returned during the raw sampling period. When a summary period other than raw is selected, the information appears according to the summary rule.
You can zoom in, zoom out and move around the displayed charts using the key presses detailed in Table 4-2. You must first select the chart before using the key presses detailed in Table 4-2.
Press | Action |
|---|---|
Right arrow key | Moves the chart one unit to the right |
Left arrow key | Moves the chart one unit to the left |
Up arrow key | Moves the chart to the bottom |
Down arrow key | Moves the chart to the top |
Shift and Z key | Zooms in on the chart's x axis |
Shift and U key | Zooms out on the chart's x axis |
Z key | Zooms in on the chart's y axis |
U key | Zooms out on the chart's y axis |
Shift and F key | Fits all information on the x axis in window |
F key | Fits all information on the y axis in window |
You can print performance statistics from the Performance Manager, either as a chart or as a table. A chart prints out the information which can be seen in the window. A Table prints out all of the performance statistics in a plain text format.
The output is printed by the default printer set up on your network.
Step 1 Open the Performance Manager and select the desired performance statistics.
Step 2 From the File menu, select Print. Choose either As Chart or As Table.
No performance data is saved automatically. If you want to save data, you must select Export to File to save the current data to a file.
Step 1 Open the Performance Manager and view the performance statistics you want to save.
Step 2 From the File menu, select Export to File
or
click the Save As icon from the Toolbar.
Step 3 The File Chooser window is displayed. The left hand panel displays the directories and the right hand panel displays the files. Use the scroll bars to locate the desired file. Click Filter to expand the list of options.
Step 4 Select the file. The full path name of the selected file is displayed in the File Filter box, as well as the Choice box.
Step 5 Click Apply to save the file or Cancel to return to the Performance Manager window.
Collected data is archived each day to <AVROOT>/logs by default. The applied file name is generated automatically using the format mm-dd-yyyy.log. When entries are archived, they are purged from the database. By default, only raw data is archived.
![]()
![]()
![]()
![]()
![]()
![]()
![]()
![]()
Posted: Tue Feb 1 14:09:18 PST 2000
Copyright 1989 - 2000©Cisco Systems Inc.