|
|

Table Of Contents
Using the Service Configuration Editor: Additional Options
The Service Security Dashboard
How to View the Service Security Dashboard
How to Configure Spam Detection Settings
Information About Viewing Malicious Traffic Reports
How to View Filter Rules for a Package
How to Activate and Deactivate Filter Rules
Managing Subscriber Notifications
Subscriber Notification Parameters
Information About Network Attack Notification
How to View Subscriber Notifications
How to Add Subscriber Notifications
How to Edit Subscriber Notifications
How to Delete Subscriber Notifications
Information About Setting the System Modes
How to Set the Operational and Topological Modes of the System
Setting Redirection Parameters
Managing Advanced Service Configuration Options
Using the Service Configuration Editor: Additional Options
This chapter explains how to use additional, advanced functionality available in the Service Configuration Editor.
•
The Service Security Dashboard
•
•
The Service Security Dashboard
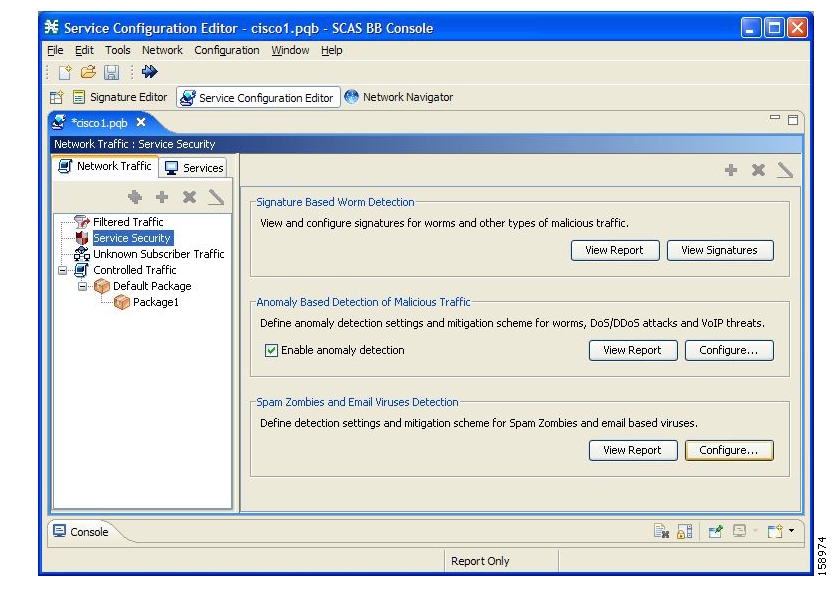
The Service Security Dashboard allows you to view and control all SCA BB security functionality.
The Dashboard is a gateway to a set of features that help you protect your network from security threats such as worms, DDoS attacks, and spam zombies. It allows configuration of the detection mechanisms (for example, attack thresholds) and of the actions to be taken when an attack is detected.
The Dashboard also allows you to access malicious traffic reports in the Reporter tool.
How to View the Service Security Dashboard
Step 1
Step 2
Figure 10-1
Viewing and configuring the various detection mechanisms and viewing malicious traffic reports are described in the following sections.
Worm Detection
SCA BB uses three mechanisms for detecting worms:
•
•
•
How to View Supported Worm Signatures
Step 1
The Signatures Settings dialog box appears, with Worm Signatures selected in the Signature Type drop-down list.
All supported worm signatures are listed.
Step 2
The Signatures Settings dialog box closes.
How to Add New Worm Signatures to a Service Configuration
Do one of the following:
Step 1
Step 2
Related Info
For more information, see Managing Protocol Signature.
Managing Anomaly Detection
The most comprehensive threat detection method is anomaly detection.
The basic principle of anomaly detection is monitoring successful (correctly established for TCP, bi-directional for other protocols) and unsuccessful (not properly established for TCP, unidirectional for other protocols) connection rates both to and from any IP address viewed by the system, and triggering an anomaly detection condition based of one of the following criteria:
•
•
The ratio metric is a particularly robust indicator of malicious activity, and together with a rate qualifier serves as a reliable identifier for malicious activity.
Anomaly detection is divided into three categories based on the directional nature of the detected anomaly condition. The concepts used for the three categories are identical, but the nature of the detected malicious activity is different for each category.
•
•
•
For all kinds of anomaly detection conditions, maximum flexibility is provided by the ability to define detection thresholds and the trigger actions to be taken for each:
•
•
•
Note
Anomaly Detection Parameters
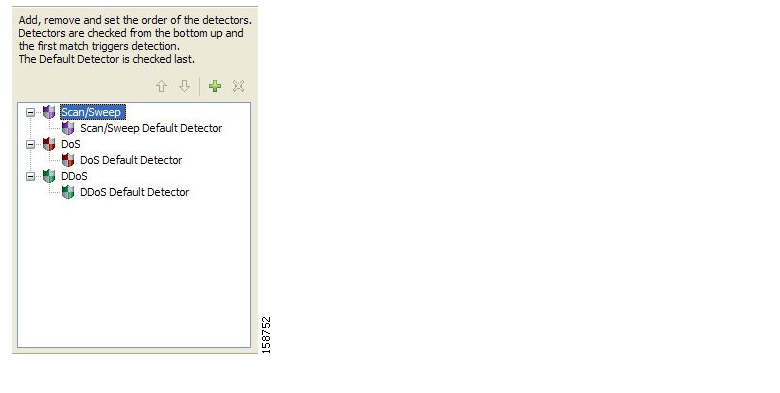
For each anomaly detector category (Scan/Sweep, DoS, DDoS) there is one default detector. You can add additional detectors of each category. Detectors in each category are checked in order; the first match (according to the detector's threshold settings) triggers detection. You set the order in which detectors are checked; the default detector is checked last.
Anomaly detectors can contain up to 12 anomaly types associated with malicious traffic:
•
–
–
–
–
–
–
•
–
–
–
–
–
–
Note
Each anomaly type on a detector has the following attributes associated with it:
•
–
–
–
–
•
Note
•
•
•
User defined detectors can also have one or more of the following attributes:
•
•
•
How to View Anomaly Detection Settings
You can view a list of all anomaly detectors. The anomaly detectors are displayed in a tree, grouped according to detector category (Scan/Sweep, DoS, or DDoS).
For each anomaly detector you can view its associated parameters and see a list of all anomaly types included in the detector, together with their parameters.
Step 1
The Anomaly Detection Settings dialog box appears.
The detector tree is displayed in the left area of the dialog box; the right area is empty.
Figure 10-2
Step 2
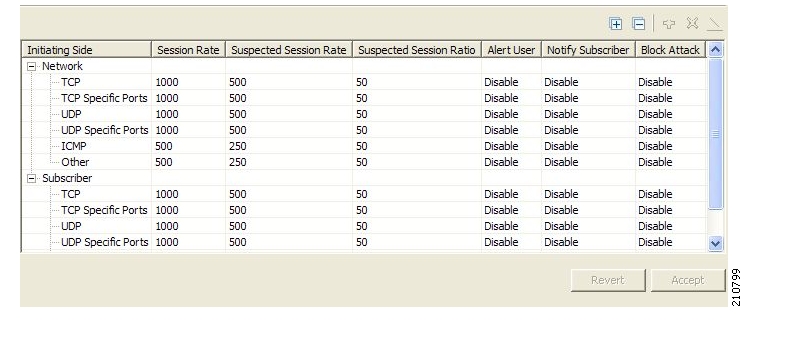
The detector parameters are displayed in the upper right area of the dialog box.
Figure 10-3
The detector's defined anomaly types are listed in the lower right area of the dialog box, together with the value of each parameter. The following screen capture shows the default parameter values for the Scan/Sweep default detector.
Figure 10-4
If asymmetric routing classification mode is enabled, the Suspected Session Rate is set equal to the Session Rate, which practically disables anomaly detection by the suspected session trigger.
Step 3
The Anomaly Detection Settings dialog box closes.
How to Add Anomaly Detectors
You can add new anomaly detectors. A service configuration can contain up to 100 anomaly detectors.
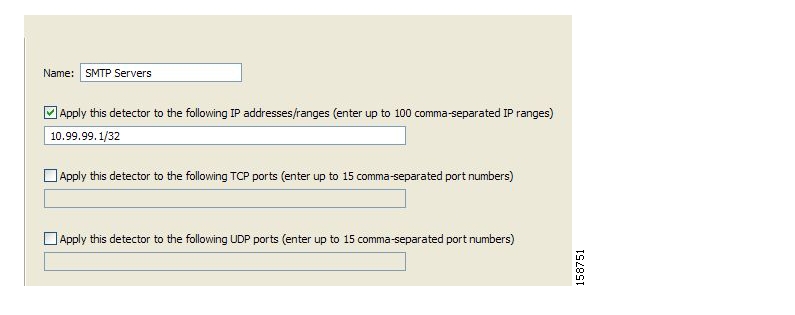
You define IP address ranges and TCP and UDP ports for the new detector, and one anomaly type.
After you have defined the detector, you can add other anomaly types (see Editing Anomaly Detectors ).
Step 1
The Anomaly Detection Settings dialog box appears.
Step 2
Step 3

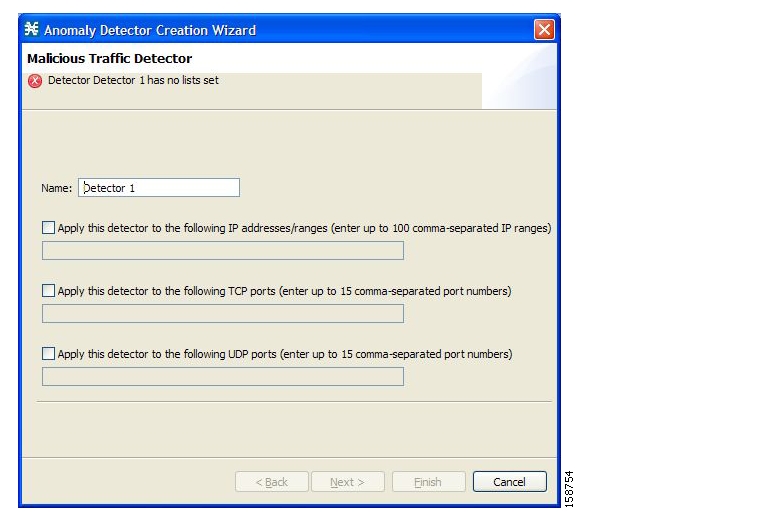
The Anomaly Detector Creation Wizard appears, open to the Malicious Traffic Detector screen.
Figure 10-5
Step 4
Step 5
The relevant fields are enabled.
Step 6
Step 7
The Malicious Traffic Characteristics for a WORM attack screen of the Anomaly Detector Creation Wizard opens.
Figure 10-6
Step 8
If you are defining a DDoS detector, select the target side for the anomaly type you are defining.
Step 9
Step 10
The Anomaly Detection Thresholds screen of the Anomaly Detector Creation Wizard opens.
Figure 10-7
Step 11
•
•
Step 12
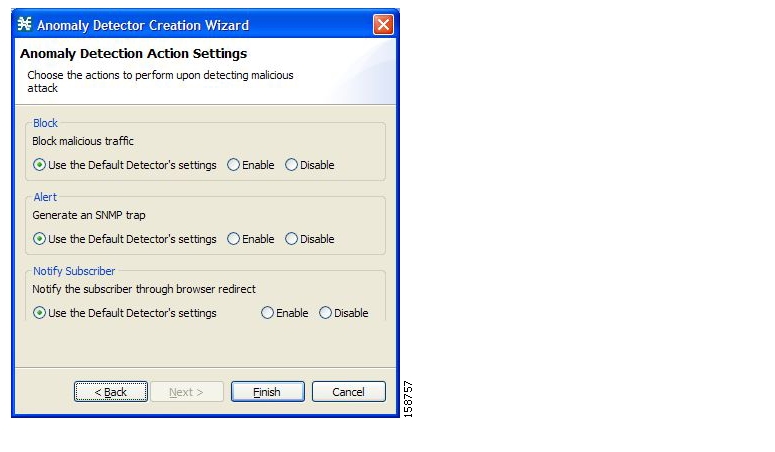
The Anomaly Detection Action Settings screen of the Anomaly Detector Creation Wizard opens.
Figure 10-8
Step 13
Step 14
The Anomaly Detector Creation Wizard closes.
The new detector is added to the detector tree.
Step 15
Editing Anomaly Detectors
You can perform the following on a user-defined anomaly detector:
•
•
•
•
•
For each detector category, detectors are checked, bottom-up, in the order that they are listed in the detector tree; the default detector is checked last.
You can edit the anomaly types of the three default detectors.
How to Edit Detector Parameters
Step 1
The Anomaly Detection Settings dialog box appears.
Step 2
The detector parameters are displayed in the upper right area of the dialog box.
Step 3
Step 4
Step 5
Step 6
The Anomaly Detection Settings dialog box closes.
Your changes are saved.
How to Edit an Anomoly Type
Step 1
The Anomaly Detection Settings dialog box appears.
Step 2
Information about the anomaly types is displayed in the lower right area of the dialog box.
Step 3
The Anomaly Detector Creation Wizard appears, open to the Anomaly Detection Thresholds screen (see How to Add an Anomoly Type ).
Step 4
•
•
Step 5
The Anomaly Detection Action Settings screen of the Anomaly Detector Creation Wizard opens.
Step 6
Step 7
The Anomaly Detector Creation Wizard closes.
The anomaly type is updated with your changes.
Step 8
Step 9
The Anomaly Detection Settings dialog box closes.
How to Add an Anomoly Type
Step 1
The Anomaly Detection Settings dialog box appears.
Step 2
The anomaly types are listed in the lower right area of the dialog box.
Step 3
The Anomaly Detector Creation Wizard appears, open to the Malicious Traffic Characteristics for a WORM attack screen (see How to Add Anomaly Detectors ).
Step 4
Step 5
Step 6
The Anomaly Detection Thresholds screen of the Anomaly Detector Creation Wizard opens.
Step 7
•
•
Step 8
The Anomaly Detection Action Settings screen of the Anomaly Detector Creation Wizard opens.
Step 9
Step 10
The Anomaly Detector Creation Wizard closes.
The new anomaly type is added to the anomaly type list.
Step 11
Step 12
The Anomaly Detection Settings dialog box closes.
How to Delete an Anomoly Type
Step 1
The Anomaly Detection Settings dialog box appears.
Step 2
The anomaly types are listed in the lower right area of the dialog box.
Step 3
Step 4
.
The selected anomaly type is deleted from the anomaly type list.
Step 5
Step 6
The Anomaly Detection Settings dialog box closes.
How to Change the Order in which Detectors are Checked
Step 1
The Anomaly Detection Settings dialog box appears.
Step 2
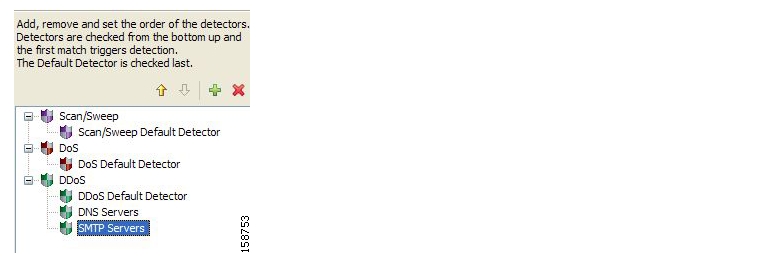
The move up arrow, the move down arrow, or both are enabled, depending on the detectors location in the tree.
Figure 10-9
Step 3
Step 4
Step 5
The Anomaly Detection Settings dialog box closes.
Your changes are saved.
How to Delete Anomaly Detectors
You can delete any or all user-defined detectors.
You cannot delete the three default detectors.
Step 1
The Anomaly Detection Settings dialog box appears.
Step 2
Step 3
A Confirm Delete message appears.
Figure 10-10
Step 4
The selected detectors are deleted and are no longer displayed in the detector tree.
Step 5
The Anomaly Detection Settings dialog box closes.
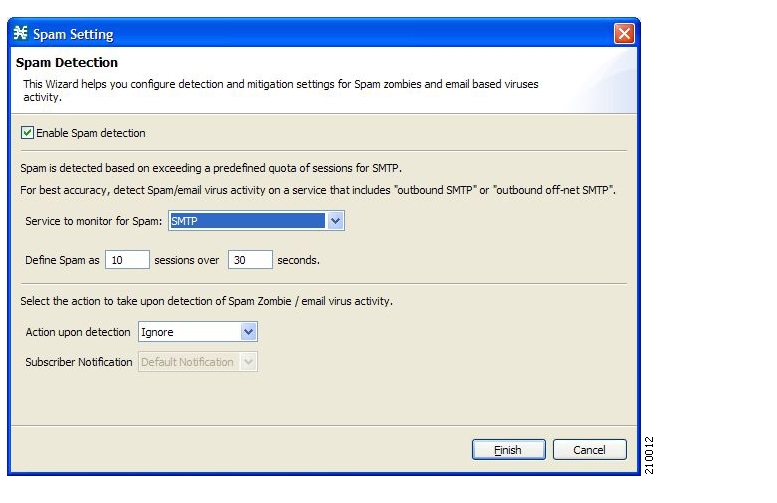
How to Configure Spam Detection Settings
Step 1
The Spam Setting dialog box appears.
Figure 10-11
Step 2
All other fields are disabled.
Continue at step 7.
Step 3
Note
Step 4
Step 5
•
•
•
•
Step 6
Note
Step 7
The Spam Setting dialog box closes.
Information About Viewing Malicious Traffic Reports
•
•
Viewing Malicious Traffic Reports
Information about detected traffic anomalies is stored in the Collection Manager database. You can use this information for network trending, detection of new threats, and tracking of malicious hosts or subscribers.
A number of reports dealing with malicious traffic can be displayed in the Reporter tool:
•
–
–
–
–
–
•
–
–
–
–
How to View a Service Security Report
Step 1
A Choose a report dialog box appears, displaying a tree of relevant reports.
Step 2
Step 3
The Choose a report dialog box closes.
The Reporter tool opens in the Console, and displays the requested report.
Step 4
Filtering the Traffic Flows
Filter rules are part of service configurations. They allow you to instruct the Service Control Engine (SCE) platform to ignore some types of flow based on the flow's Layer 3 and Layer 4 properties and to transmit the flows unchanged.
When a traffic flow enters the SCE platform, the platform checks whether a filter rule applies to this flow.
If a filter rule applies to this traffic flow, the SCE platform passes the traffic flow to its transmit queues. No RDR generation or service configuration enforcement is performed; these flows will not appear in any records generated for analysis purposes and will not be controlled by any rule belonging to the active service configuration.
It is recommended that you add filter rules for OSS protocols (such as DHCP) and routing protocols (such as BGP) that might traverse the SCE platform. These protocols usually should not be affected by policy enforcement, and their low volume makes them insignificant for reporting.
A number of filter rules are included in every new service configuration.
Note
Flows of certain protocols can also be filtered according to the flow's Layer 7 characteristics. (See Managing Advanced Service Configuration Options.) Like all other filtered flows, Layer 7 filtered flows are neither classified, controlled, nor reported. The flows of the protocols that can be filtered are typically short and their overall volume is negligible, so filtering these protocols has little effect on network bandwidth and on the accuracy of the SCA BB reports.
How to View Filter Rules for a Package
You can view a list of the filter rules included in a service configuration.
The listing for each filter rule includes the name, the status, and a brief description (generated by the system) of the rule.
To see more information about a filter rule, open the Edit Filter Rule dialog box (see How to Edit Filter Rules ).
Step 1
A list of all filter rules is displayed in the right (Rule) pane.
Figure 10-12
How to Add Filter Rules
The Add Filter Rule wizard guides you through the process of adding a filter rule.
Step 1
Step 2
The Add Filter Rule wizard appears.
Figure 10-13
Step 3
The Transport Type and Direction screen of the Add Filter Rule wizard opens.
Figure 10-14
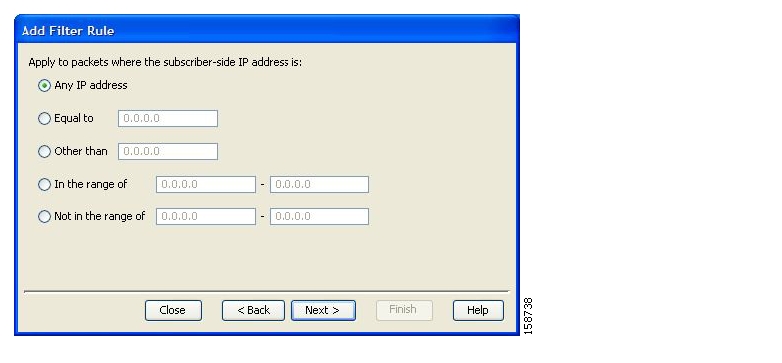
Step 4
The Subscriber-Side IP Address screen of the Add Filter Rule wizard opens.
Figure 10-15
Step 5
The Network-Side IP Address screen of the Add Filter Rule wizard opens.
Figure 10-16
Step 6
If the transport type selected in step 4 was not TCP or UDP, the ToS screen of the Add Filter Rule wizard opens. Go to step 9.
If the transport type selected in step 4 was TCP or UDP, the Subscriber-Side Port screen of the Add Filter Rule wizard opens.
Figure 10-17
Step 7
The Network-Side Port screen of the Add Filter Rule wizard opens.
Figure 10-18
Step 8
The ToS screen of the Add Filter Rule wizard opens.
Figure 10-19
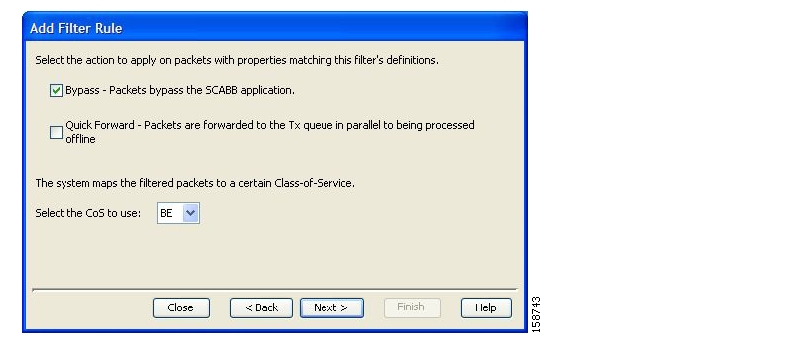
Step 9
Note
The Action and Class-of-Service screen of the Add Filter Rule wizard opens.
Figure 10-20
•
•
•
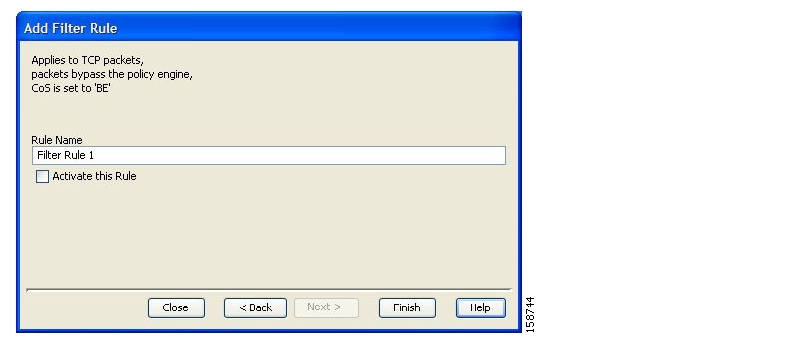
Step 10
The Finish screen of the Add Filter Rule wizard opens.
Figure 10-21
Step 11
Note
Step 12
Step 13
The Add Filter Rule wizard closes.
The filter rule is added and is displayed in the Filter Rule table.
How to Edit Filter Rules
You can view and edit the parameters of a filter rule.
Step 1
A list of all filter rules is displayed in the right (Rule) pane.
Step 2
Step 3
( Edit Rule).
The Introduction screen of the Edit Filter Rule wizard appears.
The Edit Filter Rule Wizard is the same as the Add Filter Rule wizard.
Step 4
Step 5
The filter rule is changed and relevant changes appear in the Filter Rule table.
How to Delete Filter Rules
You can delete filter rules. This is useful, for example, when you want the system to resume handling the IP addresses and their attributes according to the individual rules that were previously defined for each subscriber IP address.
Step 1
A list of all filter rules is displayed in the right (Rule) pane.
Step 2
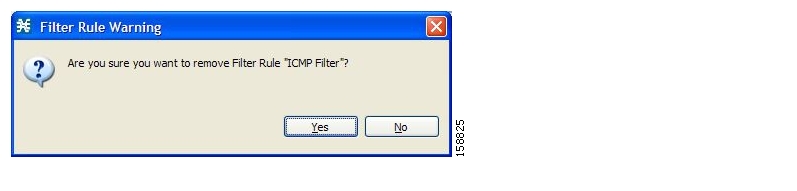
Step 3
A Filter Rule Warning message appears.
Figure 10-22
Step 4
The filter rule is deleted and is no longer displayed in the Filter Rule table.
How to Activate and Deactivate Filter Rules
You can activate or deactivate filter rules at any time. Deactivating a filter rule has the same effect as deleting it, but the parameters are retained in the service configuration, and you can reactivate the filter rule at a later date.
Step 1
A list of all filter rules is displayed in the right (Rule) pane.
Step 2
Step 3
Step 4
Step 5
Managing Subscriber Notifications
The subscriber notification feature pushes web-based messages to a subscriber by redirecting the subscriber HTTP traffic to relevant web pages. These web pages contain information relevant to the subscriber, such as notifications of quota depletion. HTTP redirection starts when the subscriber notification is activated and ceases when the notification is dismissed.
Note
The Cisco Service Control Application for Broadband (SCA BB) supports a maximum of 31 subscriber notifications, including the default notification and the Network Attack Notification.
•
•
•
•
•
•
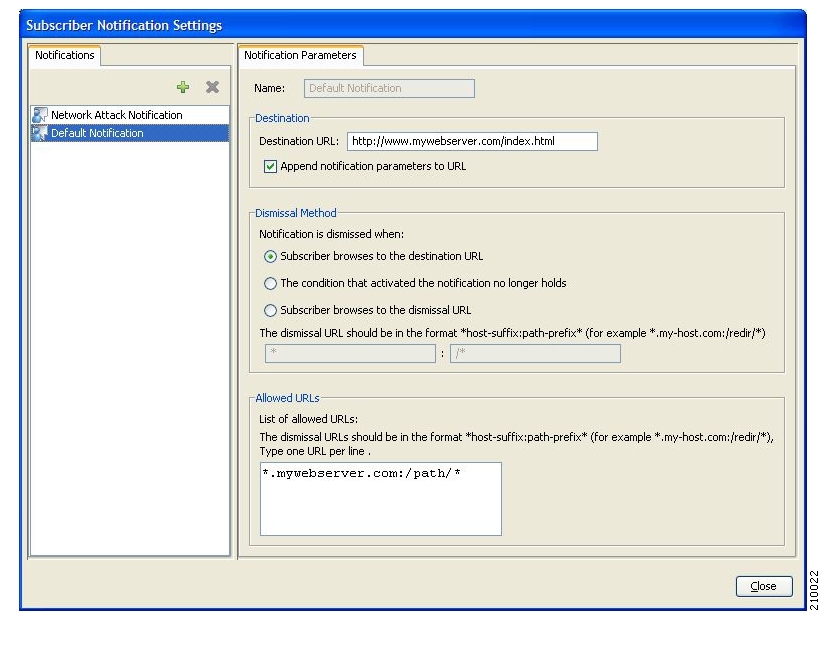
Subscriber Notification Parameters
A subscriber notification is defined by the following parameters:
•
Note
–
–
The format of the notification parameters to be added to the destination URL is:
•
?n=<notification-ID>&s=<subscriber-ID>where <notification-ID>is the ID of the notification that redirected the subscriber and <subscriber-ID>is the subscriber name.
Note
•
•
–
For example, if a quota was exceeded, the notification state is dismissed as soon as the subscriber browses to the destination URL that informs them of this fact (even though the subscriber still remains in a breach state).
–
For example, if a quota was exceeded, the notification state is dismissed only when the subscriber completes the procedure to refresh their quota.
Note
•
All HTTP flows are redirected until the notification is dismissed, which takes place when the subscriber accesses the dismissal URL. By default, the destination URL is also the dismissal URL and a notification is dismissed as soon as the first redirection takes place. However, you can define a different dismissal URL, so that the subscriber must acknowledge the notification.
For example, if a quota was exceeded, the web page at the destination URL may ask the subscriber to press an Acknowledgebutton after reading the message. The acknowledge URL would be defined as the dismissal URL and would deactivate further notifications.
The dismissal URL is composed of the URL hostname and the URL path, separated by a colon, in the following format:
•
[*]<hostname>:<path>[*]–
–
–
•
•
*.some-isp.net:/redirect/*matches all the following URLs:
–
–
–
•
After redirection is activated, all HTTP flows, except flows to the destination URL and to the dismissal URL, are blocked and redirected to the destination URL. However, subscribers can be permitted to access an additional set of URLs. This is useful, for example, to give subscribers access to additional support information.
Allowed URLs have the same format as the dismissal URL.
These parameters are defined when you add a new subscriber notification (see How to Add Subscriber Notifications ). You can modify them at any time (see How to Edit Subscriber Notifications ).
Information About Network Attack Notification
•
•
Network Attack Notification
Subscriber notification informs a subscriber in real-time about current attacks involving IP addresses mapped to that subscriber. (Enabling these notifications is described in The Service Security Dashboard.) SCA BB notifies the subscriber about the attack by redirecting HTTP flows originating from the subscriber to a server that supplies information about the attack.
One subscriber notification, Network Attack Notification, is dedicated to providing these notifications; it cannot be deleted. A Network Attack Notification is not dismissed at the end of an attack; subscribers must respond to it.
To allow redirection when blocking traffic, the system is configured to leave open one specified TCP port (by default, port 80). See Managing Advanced Service Configuration Options.
Note
Network Attack Notification Parameters
When a network attack is detected, HTTP flows of the subscriber are redirected to a configurable destination URL. This web page should display the warning that needs to be conveyed to the subscriber.
Optionally, the destination URL can include a query part containing notification parameters. The destination web server can use these parameters to create a more specific warning to the subscriber.
The query part of the URL has the following format:
?ip=<ip>&side=<side>&dir=<dir>&prot=<protocol>&no=<open-
flows>&nd=<suspected-flows>&to=<open-flows-
threshold>&td=<suspected-flows-
threshold>&ac=<action>&nh=>handled-flows>
The meaning of each field in the tail is described in the following table:
EXAMPLE OF URL WITH DESCRIPTION TAIL:
http://www.some-isp.net/warning?ip=80.178.113.222&side=s&proto=TCP&no=3
4&nd=4&to=34&td=10&ac=B&nh=100
How to View Subscriber Notifications
Step 1
The Subscriber Notifications Settings dialog box appears.
Figure 10-23
The Notifications tab displays a list of all subscriber notifications.
Step 2
The parameters of the subscriber notification are displayed in the Notification Parameters tab.
Step 3
The Subscriber Notifications Settings dialog box closes.
How to Add Subscriber Notifications
You can add up to 29 subscriber notifications to a service configuration.
Note
Step 1
The Subscriber Notifications Settings dialog box appears.
Step 2
Step 3
Note
Step 4
Step 5
Step 6
•
•
•
Step 7
Step 8
Step 9
The Subscriber Notifications Settings dialog box closes.
How to Edit Subscriber Notifications
Step 1
The Subscriber Notifications Settings dialog box appears.
Step 2
Step 3
Step 4
The Subscriber Notifications Settings dialog box closes.
How to Delete Subscriber Notifications
You can delete subscriber notifications at any time.
You cannot delete the default notification or the Network Attack Notification.
Step 1
The Subscriber Notifications Settings dialog box appears.
Step 2
Step 3
Step 4
Step 5
The Subscriber Notifications Settings dialog box closes.
Managing the System Settings
The Console allows you to determine various system parameters that control:
•
•
•
•
•
Information About Setting the System Modes
•
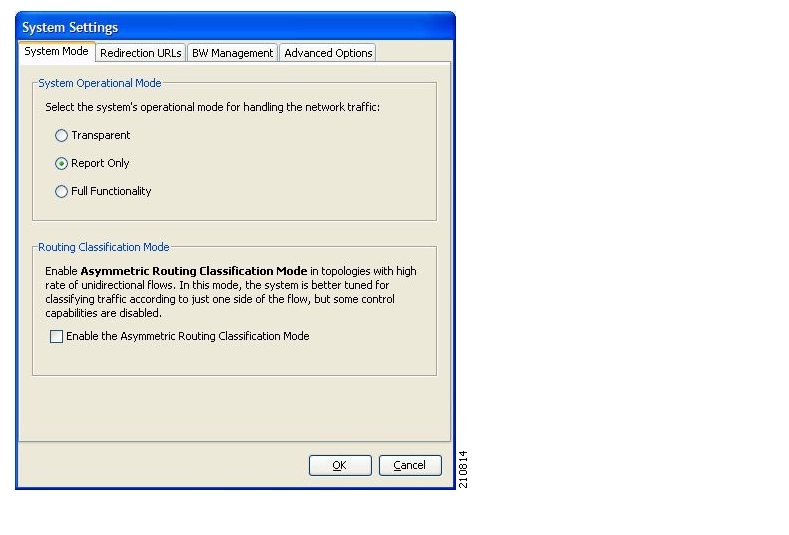
System Operational Mode
The Console allows you to select the operational mode of the system. This feature defines how the system handles network traffic.
Note
The three operational modes are:
•
•
•
Asymmetric Routing Classification Mode
You can enable or disable asymmetric routing classification mode from the Console. Enabling this mode significantly improves classification accuracy when the SCE platform is deployed in an environment with a high rate of unidirectional flows. However, the following SCA BB features are not supported when this mode is enabled:
•
•
•
•
•
•
•
•
When asymmetric routing classification mode is enabled, the service configuration editor indicates (in the Problems View) if the service configuration is consistent with the features that are supported in this mode.
The following features, which are not part of the service configuration, are also affected when asymmetric routing classification mode is enabled:
•
•
The system gives no indication if the state of the above features is consistent with the state of the routing classification mode.
Protocol Classification
When asymmetric routing classification mode is enabled, protocol classification is performed in the normal way with the exception of unidirectional UDP flows. Because it is impossible to know the server side of a unidirectional UDP flow, SCA BB tries to classify the protocol using the destination port of the first packet; if no exact match is found, SCA BB tries to classify the protocol using the source port.
Switching to Asymmetric Routing Classification Mode
If you create a service configuration in symmetric mode and switch to asymmetric routing classification mode:
•
•
•
Switching from Asymmetric Routing Classification Mode
If you create a service configuration in asymmetric routing classification mode:
•
•
•
•
How to Set the Operational and Topological Modes of the System
Step 1
The System Settings dialog box appears.
Figure 10-24
Step 2
•
•
•
Step 3
Step 4
The System Settings dialog box closes.
The new System Mode setting is saved.
Setting Redirection Parameters
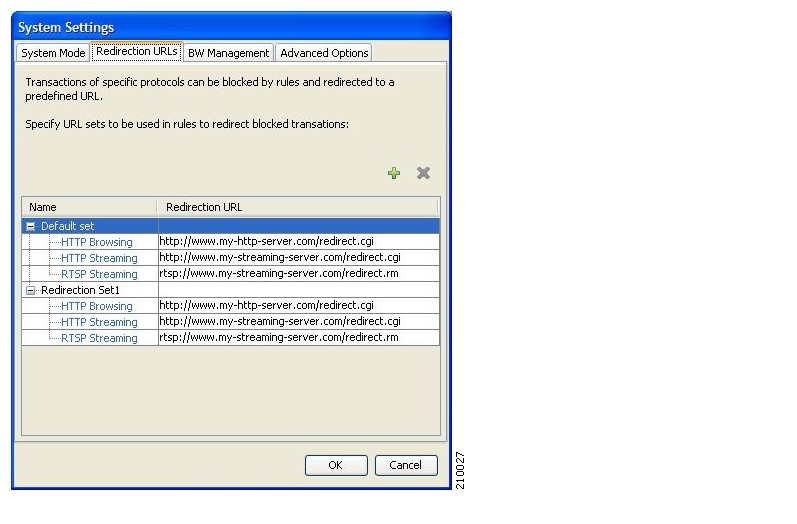
The rules for a package may deny access to selected protocols. When a subscriber to the package tries to access a blocked protocol, the traffic flow can be redirected to a server where a posted web page explains the reason for the redirection (for example, a "Silver" subscriber trying to access a service available only to "Gold" subscribers). This web page can offer subscribers the opportunity to upgrade their packages. You configure which redirection set to use when defining rules (see How to Define Per-Flow Actions for a Rule ).
Note
The Console Redirection feature supports only three protocols:
•
•
•
Each redirection set contains one redirection option for each of these three protocols. The system provides a default redirection set, which cannot be deleted. You can add up to 49 additional sets.
Each redirection URL includes the URL specified name, the Subscriber ID, and the Service ID in the following format:
<URL>?n=<subscriber-ID>&s=<service-ID>How to Add a Set of Redirection URLs
You can add up to 49 redirection sets.
Step 1
The System Settings dialog box appears.
Step 2
The Redirection URLs tab opens.
Figure 10-25
Step 3
A new redirection set containing the default redirection URLs is added to the redirection set list.
Figure 10-26
Step 4
Note
Step 5
Step 6
The System Settings dialog box closes.
The Redirection group is added to the redirection set list.
How to Edit the Redirection Parameters
Step 1
The System Settings dialog box appears.
Step 2
The Redirection URLs tab opens.
Step 3
Step 4
Step 5
The System Settings dialog box closes.
The Redirection settings are saved.
How to Delete a Set of Redirection URLs
Step 1
The System Settings dialog box appears.
Step 2
The Redirection URLs tab opens.
Step 3
Step 4
A Redirection Warning message appears.
Figure 10-27
Step 5
The redirection set is deleted.
Step 6
The System Settings dialog box closes.
The Redirection settings are saved.
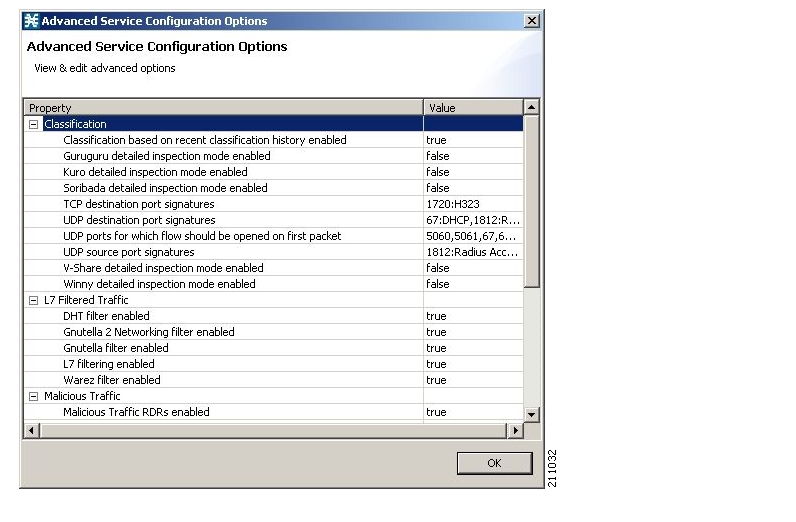
Managing Advanced Service Configuration Options
Advanced service configuration options control the more sophisticated and less frequently changed attributes of the system. It is recommended that you do not change these options.
The following table lists these options:
•
•
•
•
•
•
•
How to edit Advanced Service Configuration Options
DETAILED STEPS
Step 1
The System Settings dialog box appears.
Step 2
The Advanced Options tab opens.
Figure 10-28
Step 3
The Advanced Service Configuration Options dialog box opens.
Figure 10-29
Step 4
Step 5
The Advanced Service Configuration Options dialog box closes.
The changes to the advanced options are saved.
Managing VAS Traffic-Forwarding Settings
Traffic forwarding to Value Added Services (VAS) servers allows you to use an external expert system (VAS server) for additional traffic processing, such as intrusion detection and content filtering to subscribers. After processing, flows are sent back to the SCE platform, which then sends them to their original destinations.
The flows to be forwarded are selected based on the subscriber package and the flow type (IP protocol type and destination port number).
VAS traffic forwarding has the following limitations:
•
•
•
•
•
Note
To use VAS traffic forwarding, you must also configure VAS services on the SCE platform. Additional information is available in the "Value Added Services (VAS) Traffic Forwarding" chapter of the Cisco Service Control Engine (SCE) Software Configuration Guide .
Enabling VAS Traffic Forwarding
By default, VAS traffic forwarding is disabled. You can enable it at any time.
Note
How to Enable VAS Traffic Forwarding
Step 1
The VAS Settings dialog box appears.
Step 2
Note
Click OK, and continue at step 3.The VAS Traffic Forwarding Table drop-down list in the Advanced tab of the Package Settings dialog box is enabled (see How to Set Advanced Package Options ).
Step 3
The VAS Settings dialog box closes.
How to Disable VAS Traffic Forwarding
Step 1
The VAS Settings dialog box appears.
Figure 10-30
Step 2
VAS traffic forwarding is disabled.
Step 3
The VAS Settings dialog box closes.
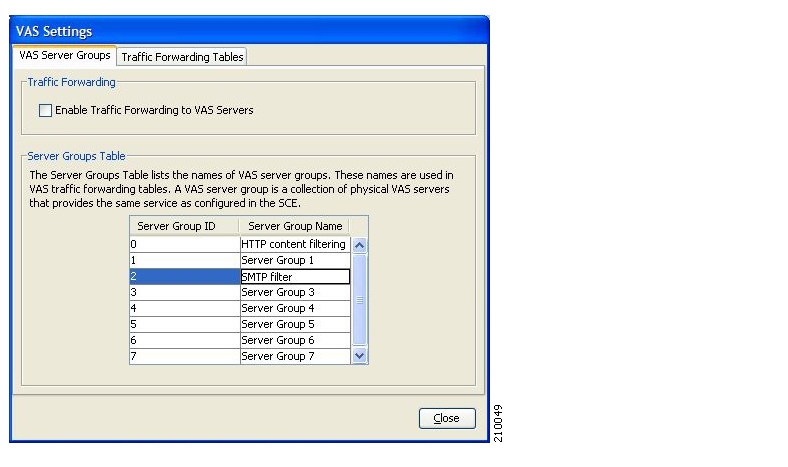
How to Rename VAS Server Groups
An SCE platform can forward flows to up to eight different VAS server groups. By default, the eight server groups are named "Server Group n", where n takes a value from 0 to 7. Give the server groups meaningful names; the names you give will appear in the drop-down list in the Advanced tab of the Package Settings dialog box (see How to Set Advanced Package Options ) and in the Server Group field of the table parameters added to each traffic-forwarding table (see Managing VAS Table Parameters ).
Step 1
The VAS Settings dialog box appears.
Step 2
Step 3
Step 4
Figure 10-31
Step 5
The VAS Settings dialog box closes.
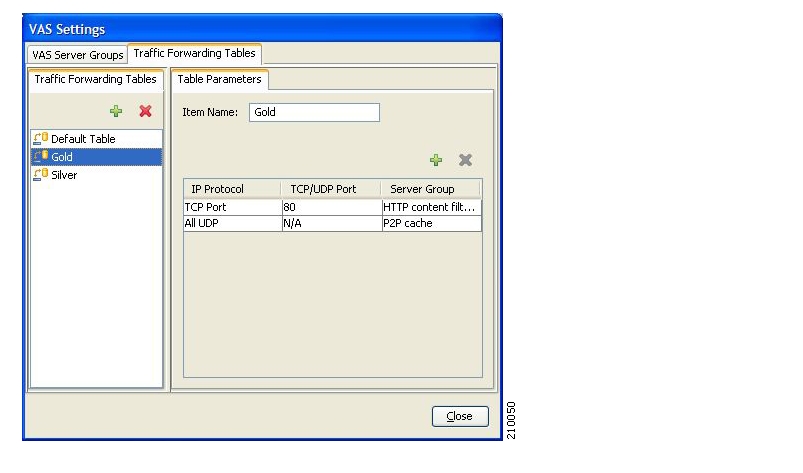
How to View VAS Traffic Forwarding Tables
SCA BB decides whether a flow passing through an SCE platform should be forwarded to a VAS server group based on a traffic-forwarding table . Each entry ( table parameter ) in a traffic-forwarding table defines to which VAS server group the specified flows should be forwarded.
Step 1
The VAS Settings dialog box appears.
Step 2
The Traffic Forwarding Tables tab opens.
A list of all traffic-forwarding tables is displayed in the Traffic Forwarding Tables area.
Step 3
A list of all table parameters defined for this traffic-forwarding table opens in the Table Parameters tab.
Figure 10-32
Step 4
The VAS Settings dialog box closes.
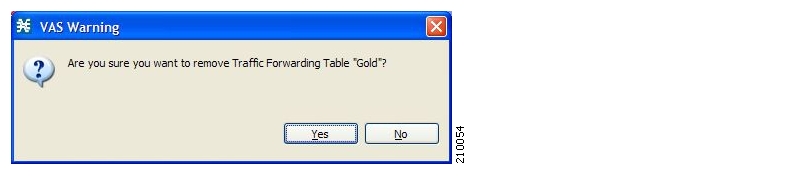
How to Delete VAS Traffic-Forwarding Tables
You can delete all user-created traffic-forwarding tables. The default traffic-forwarding table cannot be deleted.
Note
Step 1
The VAS Settings dialog box appears.
Step 2
The Traffic Forwarding Tables tab opens.
Step 3
Step 4
A VAS Warning message appears.
Figure 10-33
Step 5
The selected table is deleted and is no longer displayed in the list of traffic-forwarding tables.
Step 6
The VAS Settings dialog box closes.
How to Add VAS Traffic-Forwarding Tables
A default traffic-forwarding table is included in the service configuration. You can add up to 63 more traffic-forwarding tables, and then assign different traffic-forwarding tables to different packages.
Step 1
The VAS Settings dialog box appears.
Step 2
The Traffic Forwarding Tables tab opens.
Step 3
A new table named Table (n), where n is a value between 1 and 63, is added to the list of traffic-forwarding tables in the Traffic Forwarding Tables area.
The table name is also displayed in the Item Name box in the Table Parameters tab.
Step 4
You can now add table parameters to the new traffic-forwarding table, see How to Add VAS Table Parameters.
Managing VAS Table Parameters
A table parameter is an IP protocol type, an associated TCP/UDP port (where applicable), and a VAS server group or a range of IP addresses.
A traffic-forwarding table is a collection of related table parameters.
A traffic-forwarding table can contain up to 64 table parameters.
How to Add VAS Table Parameters
You can add up to 64 table parameters to a traffic-forwarding table.
Step 1
The VAS Settings dialog box appears.
Step 2
The Traffic Forwarding Tables tab opens.
Step 3
Step 4
A new table parameter is added to the list of table parameters in the Table Parameters tab.
Note
You can now edit the new table parameter, as described in the following section.
Step 5
The VAS Settings dialog box closes.
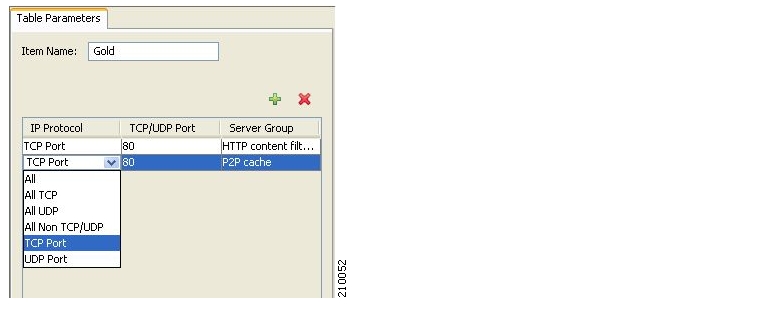
How to Edit VAS Table Parameters
Step 1
The VAS Settings dialog box appears.
Step 2
The Traffic Forwarding Tables tab opens.
Step 3
Step 4
1.
Figure 10-34
2.
3.
Note
4.
Figure 10-35
Step 5
The VAS Settings dialog box closes.
How to Delete VAS Table Parameters
Step 1
The VAS Settings dialog box appears.
Step 2
The Traffic Forwarding Tables tab opens.
Step 3
Step 4
Step 5
The selected table parameter is deleted and is no longer displayed in the list of table parameters.
Step 6
The VAS Settings dialog box closes.
![]()
![]()
![]()
![]()
![]()
![]()
![]()
![]()
Posted: Wed May 30 14:02:41 PDT 2007
All contents are Copyright © 1992--2007 Cisco Systems, Inc. All rights reserved.
Important Notices and Privacy Statement.