|
|

If the call succeeds, then the symbol status will reflect the current alarms on the node. The Version and Revision fields of the node attributes database are also updated with the current software version and revision running on that node.
Node status is indicated by the color of the node on the network map. (See Table 5-1.)
| Response | APS Standalone or Co-resident with SV+ 8.0 | APS Co-resident with SV+ 8.1 |
|---|---|---|
| Node Color | Node Color | |
No response to poll | red | tan |
Major alarm | orange | red |
Minor alarm | yellow | yellow |
Warning | cyan | cyan |
Normal | green | green |
Unknown | blue | blue |
The alarms and events that constitute Normal, Warning, Minor, or Major status are defined in the aps.conf file (see the chapter, Installation and Setup). A complete list of events that can be generated by FastPADmp/mpr nodes is found in the appendix "FastPAD Events."
Polling interval can be set to any value followed by:
For example, 3h is a polling interval of 3 hours. The default is 10m (10 minutes).
The monitoring type of a node can have one of the following values:
APS also will not poll nodes with Passive monitoring status. Passive is used to indicate that any alarms received from the node are reflected in the object's status.
Active monitoring status is used to indicate that the node should be polled according to its polling interval.
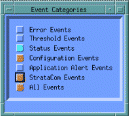
To view events and alarms for FastPADmp/mpr nodes, first select StrataCom Events in the HP OpenView Event Categories window. (See Figure 5-1.)
You then receive the HP OpenView Event Browser window. (See Figure 5-2.)
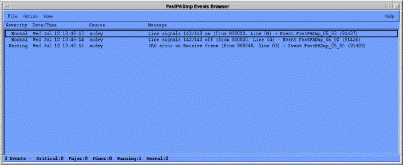
The Browser includes all events for StrataCom products, including the IPX. To review FastPADmp/mpr events, or events for a particular node select View -> Set Filters, and enter a unique message string such as "FastPADmp/mpr", or the node's X.25 address.
To Receive more information about a particular event, highlight the event and select
View -> Event Description. (See Figure 5-3.)
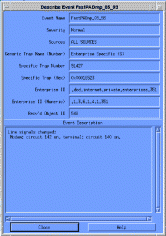
The Describe Event window contains all information that is available for a particular event.
The Node Event Browser displays events for a specific node in your network. The Node Event Browser displays all categories of events for the selected node only. Events are filtered based on the X.25 address of the selected node. The Node Event Browser is a display-only view of events. The standard HPOpenView event browser is still available to the user for viewing and working with all events.
The Node Event Browser operates in a similar manner to the HPOpenView event browser, but does not save or retrieve event logs, configuration actions, or SNMP configuration actions.
To start the APS Node Event Browser, double click on a node in the Repository Submap window. The Node Event Browser will display events specific to the node on which you double clicked.
The APS Node Event Browser contains the standard Motif menu bar at the top, with a line of static fields listing the selected node's X.25 address, node name, and model. Below the menu line is a display with a scrolling list of events, one event on each line. (See Figure 5-4.)

Event information in the Node Event Browser is arranged as follows:
At the bottom of the node event window is a summary of the event log containing total number of events, and a breakdown of events by severity level.
The event browser loads all past events and then begins a continuous update of new events. The events are stored in a buffer, and can be viewed going backward, using the scroll button on the right side. The display can be scrolled horizontally using the scroll button on the bottom of the window.
The size of the buffer can be set by changing the value in the Xdefaults file in the root directory of the workstation. The default size is set to 500 events.
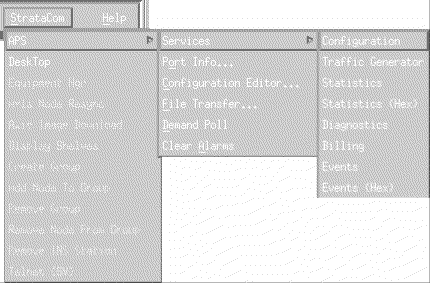
The StrataCom Menu selection is added to HP OpenView when APS is loaded onto the workstation. APS management operations appear when you click the left mouse button on this menu item. (See Figure 5-5.)
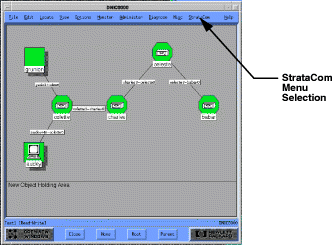
Select APS, and the following menu options appear. When you click the left mouse button on the Services menu item, an additional menu of Services appears, (see Figure 5-6) allowing any of the following tasks to be performed:
The Port Info function enables you to locally record the configuration of FastPADmp/mpr ports. When selected, the Ports window appears, and you can enter data into the text fields on the right of the screen. (See Figure 5-7.)
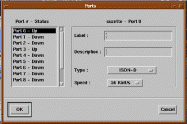
The Status of each port (on the left) is dynamically updated after each poll of the node.
The Configuration Editor lets you perform the following tasks:
When you select Configuration Editor, the Load Configuration File screen displays. (See Figure 5-8.)
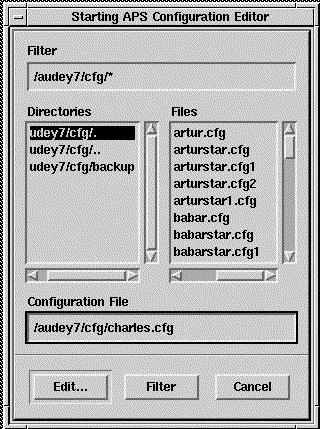
Following are some examples of the menus and screens accessed through this structure.
The Main menus screen allows you to select configuration for the following items:
See Figure 5-9 to view the Main Menu.

Selecting a General Parameters on the main menu screen displays the General Parameters screen. (See Figure 5-10.)
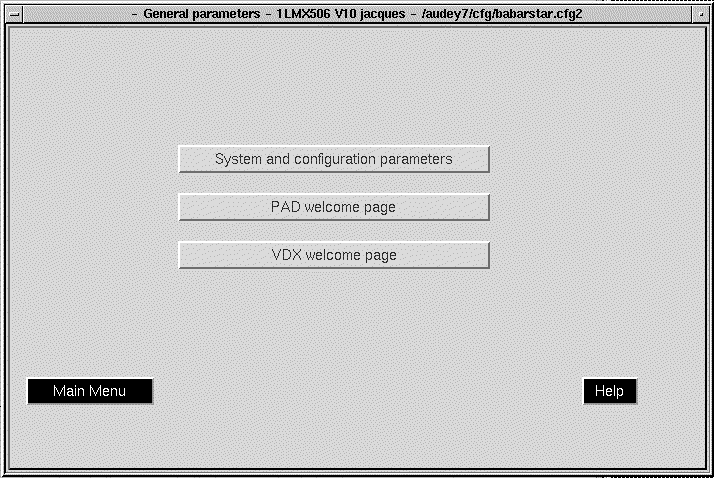
The General Parameters menu allows you to select the following:
Selecting any of these items displays the selected screen on your system.
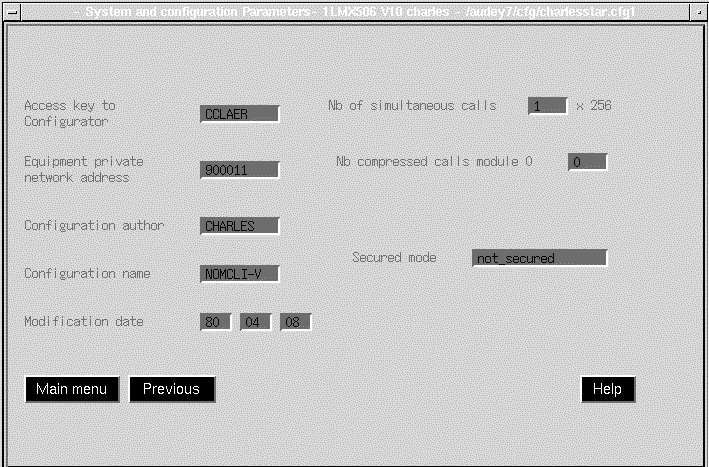
The System and configuration parameters menu permits you to configure the following system parameters:
See Figure 5-11 for an example of the System and Configuration Parameters menu.
The PAD welcome screen displays the attributes of each PAD message in Hexadecimal format. (See Figure 5-12.)

The VDX welcome screen displays the attributes of each VDX message in Hexadecimal format. (See Figure 5-13.)

The Lines Configuration screen displays the lines that are installed in your system and how they are configured. (See Figure 5-14.)

The Tables dialog allows you to select a table to view. (See Figure 5-15.)


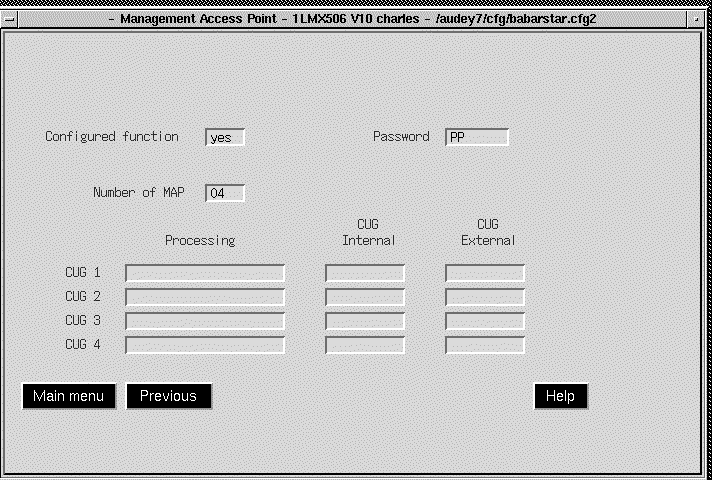
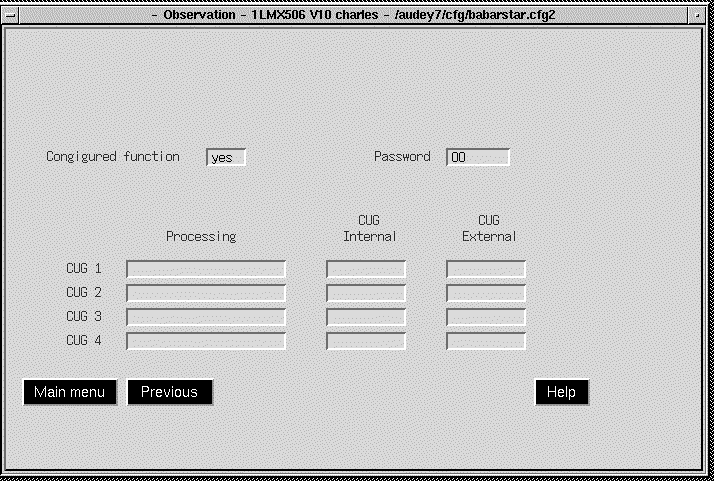
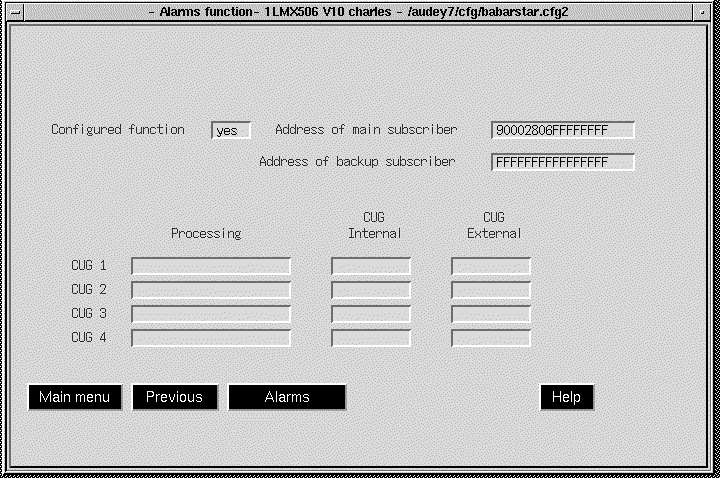
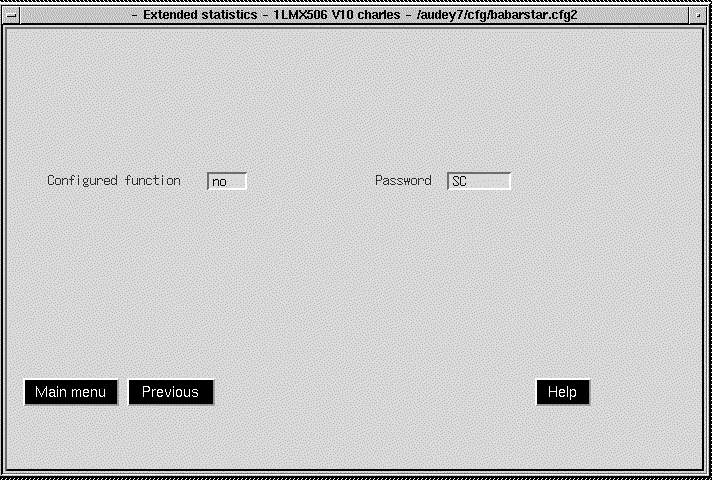


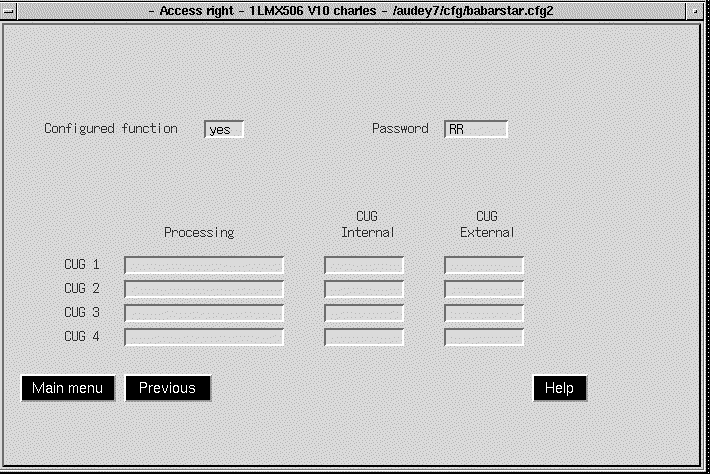
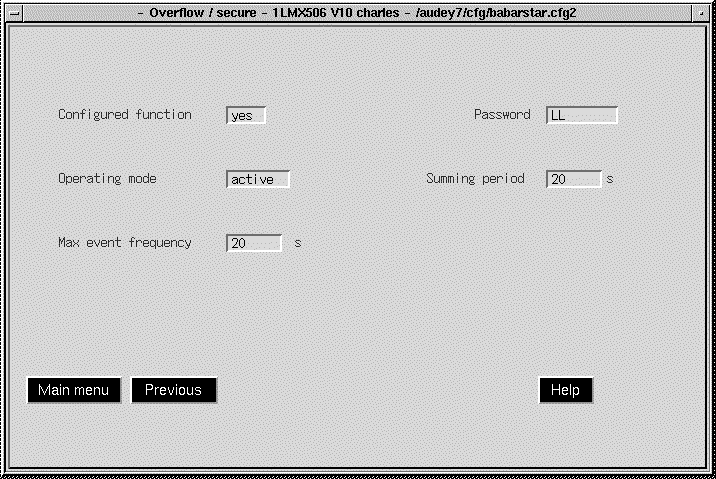
Lines
-mp/mpr 6 lines
-mp/mpr 12 lines

-SDLC family
SDLC LLC level
-SDLC protocol level
-SDLC signalling level

-VIP family
VIP physical level
-VIP controller protocol level
-VIP frontal protocol level
-VIP signalling level

Transparent BSC (T.VIP family and T.BSC/BSC3270 BSC2780/3780 family)
-BSC-3270/2780-3780 physical level
-BSC-3270/2780-3780 protocol level 3270
-BSC-3270/2780-3780 protocol level 2780/3780
-BSC-3270 / 2780-3770 signalling level
-BSC-3270/2780-3780 X.3 parameters level
-MLP family

-X.25-PSTN family
-X.25 synchronous physical level
-PSTN parameters level
-data link level
-network level
-network level (next)
-facilities level
X.3 parameters level PSTN parameters level
X.25 synchronous signalling level
X.25 synchronous signalling level (more) services level
X.25 synchronous physical level
X.25 synchronous PSTN parameters level
X.25 synchronous data link level
X.25 synchronous network level
X.25 synchronous network level (next)
X.25 synchronous facilities level
X.25 synchronous signalling level
X.25 synchronous signalling level (more)
X.25 synchronous services level


Asynchronous physical level
Asynchronous protocol level
Asynchronous signalling level

-ESV securized VC family

-N4 securized VC family


-IR securized VC family

-ISDN channel D family
-ISDN channel D physical level
-ISDN channel D data link level
-ISDN channel D network level
-ISDN channel D signalling level
-X.29 Rerouting family

-Ethernet family
-Ethernet BRIDGE physical level
-Ethernet BRIDGE bridge level
-Ethernet BRIDGE services level
-Ethernet ROUTER physical level
-Ethernet ROUTER router level
-Ethernet ROUTER services level
-Ethernet ROUTER signalling level


-Frame relay family
-Network frame physical level
-Network frame relay services level
-Subscriber frame relay physical level
-Subscriber frame relay protocol level
-Subscriber frame relay services level

-Compressing family

-D L M family

-Configuration family

-Extended statistics

-Dynamic adaptive routing

-Statistics

-Telemaintenance

-Access right

-Overflow secure
-Tables

-X25 Outgoing routing and unknown DNIC, ZO, Subscribers
	-  Routing to
--known DNICs (001-060)
--known DNICs (061-100)
--known ZOs (001-050)
--known ZOs (051-100)
--known subscribers (001-050)
--known subscribers (051-100)

 PVC: Table of Permanent Virtual Circuits
-PVC (001-050)
-PVC (051-100)
-PVC (101-150)
-PVC (151-200)
-	PVC (201-250)

Automatic calling
- Automatic calls (001-050)
- Automatic calls (051-100)
-Automatk calls (101-160)
- Automatic calls (151-200)

Address conversion
-Incoming address conversion (001-060)
-Incoming address conversion (051-100)
-Outgoing address conversion (00l-150)
-Outgoing address conversion (051-100)

 PSTN/ISDN conversion
-PSTN/ISDN table (000-049)
-PSTN/ISDN table (050-099)
-PSTN/ISDN table (100-149)
-PSTN/ISDN table (150-199)
-PSTN/ISDN table (200-249)
 Abbreviated calling (001-100)
-NUI/NUA pairs
-NLII/NLIA (001-050)
-NUI/NUA (051-100)
-NUI/NUA (101-150)
-NUI/NUA (151-200)
-NUI/NUA (201-220)

CUG Lines
- CUG: Choice of line (Line 00-07)
- CUG for (Line 00-27)

Profile ref. ISDN/FR
-ISDN profile ref 00 data link level
-ISDN profile ref 00 network level
-ISDN profile ref 00 facilities level
-ISDN profile ref 00 signalling level
-ISDN profile ref 00 services level

ESV securized lines
-Network Interface and Transport Protocol RVC

Controllers
-SDLC cluster table (001-050)
-SDLC cluster table (051-100)
-SOLC cluster table (101-150)
-SDLC cluster table (15l-200)
-VIP controllers I BSC 3270 (001-050)
-VIP controllers / BSC 3270 (051-100)
-VIP controllers / BSC 3270 (101-160)
-VIP controllers / BSC 3270 (151-200)
-BSC 2780/3780 Controllers (001-050)
-BSC 2780/3780 Controllers (061-100)
-BSC 2780/3780 Controllers (101-150)
-BSC 2780/3780 Controllers (151-200)

Ethernet/VIP
-Table of filters (001-012)
-Table of filters (013-024)
-Table of filters (025-036)
-Table of filters (037-048)
MAC
-Table of MAC address (001-030)
-Table of MAC address (031-060)

LLC
-Table at LLC (001-050)
-Table at LLC (051-100)
-Table at LLC (101-150)
-Table at LLC (151-200)

 Table of IP ranges - IP min/max
-ranges (001-020)
-ranges(021-040)
-ranges(041-060)
-ranges(061-080)
-ranges(081-100)
-ranges (101-120)
-ranges(121-140)
-ranges(141-160)
-ranges (161-180)
-ranges(181-200)

LAN interfaces
-Table of LAN interfaces (1)
-Table of LAN interfaces (2)
-Table of LAN interfaces (3)
-Table of LAN interfaces (4)
-Table of LAN interfaces (5)
-Table of LAN interfaces (6)
-Table of LAN interfaces (7)
-Table of LAN interlaces (8)
-Table of LAN interfaces (9)
-Table of LAN interlaces (10)
-Table at LAN interlaces (11)
-Table of LAN interfaces (12)
-Table of LAN interfaces (13)
-Table of LAN interfaces (14)
-Table of LAN interfaces (15)
-Table of LAN interfaces (16)
- Table of LAN interfaces (17)
-Table of LAN interferes (18)
-Table at LAN interfaces (19)
-Table of LAN Interfaces (20)
LLC Helpers
-Table of LLC HELPER (001-020)
-Table oi LLC HELPER (021-040)

MLP bundles
-MLP Configuration
-Bundle 1
-Bundle 2
-Bundle 3
-Bundle 4
-Bundle 5
-Bundle 6
-Bundle 7
-Bundle 8
-Bundle 9

Frame relay
-Frame relay table (001-040)
-Frame relay table (041-120)
-Frame relay table (M1-120)
-Frame relay table (121-160)
-Frame relay table (161-200)

 PDN table
 -PDN line addresses 00-35

Compacting tables
-Comp/decompacting (001-050)
-Comp/decompacting (051-100)
- Comp/decompacting (101-150)
- Comp/decompacting (151-200)

 PLL Frame Configurations
-PLL configuration (001-040)
-PLL configuration (041-180)
-PLL configuration (081-120)
-PLL configuration (121-160)
-PLL configuration (161-200)


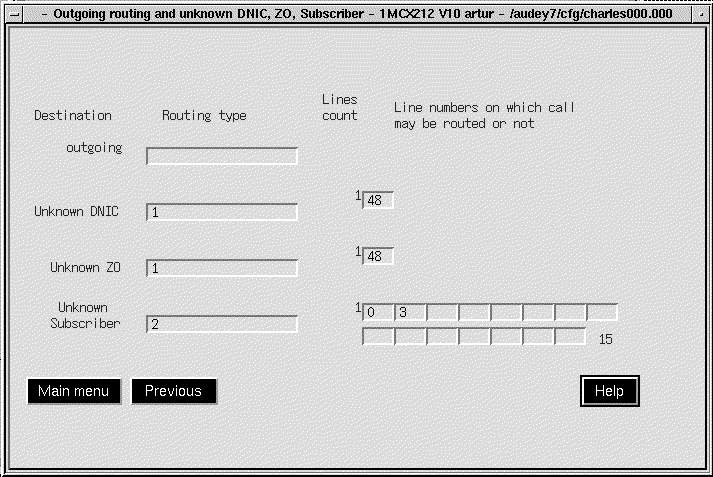
Clicking on the Routing Tables button opens the X.25 Routing Configuration screen. (See Figure 5-34.)

Clicking on any of the first four buttons (outgoing routing, Routing to an unknown DNIC, Routing to an unknown ZO, or Routing to an unknown subscriber) opens the Outgoing Routing screen. (See Figure 5-35.)


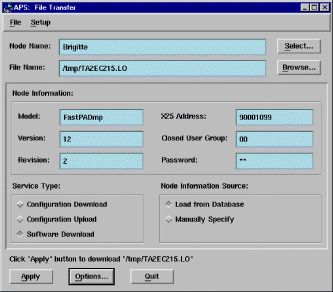
The File Transfer function lets you perform the following tasks:
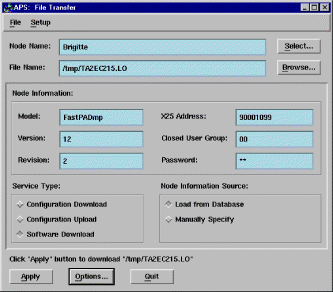
Figure 5-51 illustrates the File Transfer Function screen.
The Configuration Download function transfers a binary configuration file from the APS workstation to the selected FastPADmp/mpr node. The Configuration file name and Configuration download date fields are updated in the database if the operation execution is successful. A reset node command must be issued from the File Transfer Function dialog before this new download takes effect.
The Configuration Upload function copies the configuration of the selected FastPADmp/mpr node to a file specified on the network management workstation. You must have write access to this directory to perform this function.
The Software Download function downloads FastPADmp/mpr operational software from the APS workstation to the flash PROM of the node. Software file name and Software download date fields are displayed in the Attributes for Object dialog and are updated in the database if the operation is successful. There are two modes for software download: online and offline.
Online software download allows the switch to remain operational while it receives the software image. Online software download automatically compresses the file before downloading. The image is downloaded to a reserved area of the node's memory, and then when a reset node command is issued from the File Transfer Function dialog, the image is uncompressed, and loaded into the node's Flash PROM.
Offline software download automatically halts the node, and puts the node into boot mode. Once the node is in boot mode, the previous software image is deleted, and the new image is downloaded from the management workstation. The node is then issued a reset node command from the File Transfer Function dialog, and the new image is loaded into Flash PROM.
It takes about 40 minutes (9600 bit/s, 8 bits, no parity) to transfer operational software (about 1.05 megabytes).
1. Either enter the Node name or click on Select to receive a list of nodes. A highlighted node's name appears in the dialog. The list of nodes consists of only those that have been entered into the database.
2. Select a service to be performed by clicking the desired radio button.
3. Either enter the file name to be used or click the Browse button to receive a list of available files.
4. Click Apply.
When a file transfer is being performed, a progress indicator dialog appears in the screen to indicate the number of bytes transferred and the percentage of work done so far:
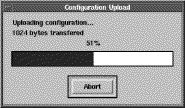
You can abort the operation by clicking the "Abort" button in the progress indicator dialog.
This function resets the node, loading its fixed operational configuration and operational software into the memory. When this is being executed, all communications in progress are interrupted. This function waits until the equipment is responding before returning.
This function erases the operational software from the Flash PROM memory and shifts to boot software. All communications in progress are interrupted. Furthermore, the equipment will not be in service again until new operational software is downloaded and the equipment is reset.
The Equipment Halt function waits until the boot software is loaded into memory before returning. After the operation is completed successfully, the FastPADmp/mpr node is ready to communicate with the APS workstation to perform software downloading.
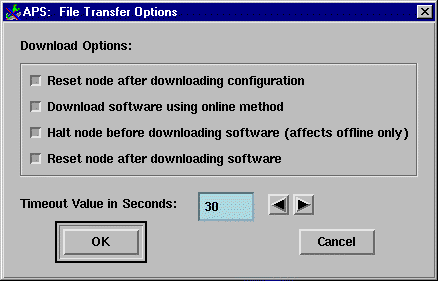
Equipment halt and reset operations are separated from the downloading/uploading services in the File transfer dialog. These two actions are available under the Options menu selection under File Transfer.
Click on Options in the File Transfer dialog and you receive a the File Transfer Options dialog. (See Figure 5-53.)
To run aps_ft in batch mode, user supplies the command line option "-b". All parameters other than the options data that are displayed in the non-batch mode graphical user interface window can be specified through other command line options. Once the service is done, aps_ft exits with the status code.
The following program usage message is printed to the standard output with "-h" option.
Usage: aps_ft	[ -bhmp ] [ -c <cug> ] [ -d <level> ] [ -f <name> ]
	[ -r <rev> ] [ -s <type> ] [ -t <model> ]
	[ -v <ver> ] [ -w <passwd> ] [ -x <addr> ]
	[ <node_name> ]
where:
	-b	run in batch mode;
	-c <cug>	specify the closed user group;
	-d <level>	specify the debug level, ranging from 0 to 7, the default is 0;
	-f <name>	specify the configuration or program file name,
		the default is NULL;
	-h	print program usage message on the standard output;
	-m	indicate the node information will be specified manually,
		by default, node information is loaded from the database;
	-p	indicate the downloading service applies to software program,
		meaningful only when the service type is download; if this
		option not specified, download applies to configuration file;
	-r <rev>	specify the revision number;
	-s <type>	specify the service type string, which is one of the following:
			download | upload | reset | halt
		prefix string is acceptable, e.g. "-s d" is equivalent to
		"-s download", the default is download;
	-t <model>	specify the node model type;
	-v <ver>	specify the version number;
	-w <passwd>	specify the password;
	-x <addr>	specify the X25 address;
	<node_name>	is optional, has to be the last argument after all options.
File transfer options are not supported in the command line and batch mode does not support the download options. You must therefore reset or halt the equipment separately in batch mode, as shown in the following example.
The following is a sample shell script to halt a node first, then download software and reset the node at the end.
	#!/bin/sh
	#
	# Usage: SoftwareDownload <file_name> <node_name>
	#
	# Using APS file transfer program aps_ft in batch mode to download the
	# given software file to the given FastPADmp/mpr node. It will halt the node
	# first, then download the software, and reset the node at the end
	#

	if [ $# -ne 2 ]
	then
		echo "Usage: $0 <file_name> <node_name>"
		exit 1
	fi

	aps_ft -b -s halt $2
	aps_ft -b -p -s download -f $1 $2
	aps_ft -b -s reset $2
The Services menu allows you to choose from the following APS functions:
The Configuration service places an X.25 call to the selected node, with a port number of 99, which is the FastPADmp/mpr Supervisory Process. Any of the FastPADmp/mpr configuration functions may be performed. A window indicating this connection is displayed. (See Figure 5-54.)
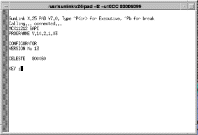
Any of the FastPADmp/mpr configuration functions as described in the FastPADmp/mpr Configuration manual may be performed.
To exit, enter ^P (Control-P) <Return>to access the SunLink X.25 prompt, and enter clear (lower case) to clear the call. Press <Return> to continue.
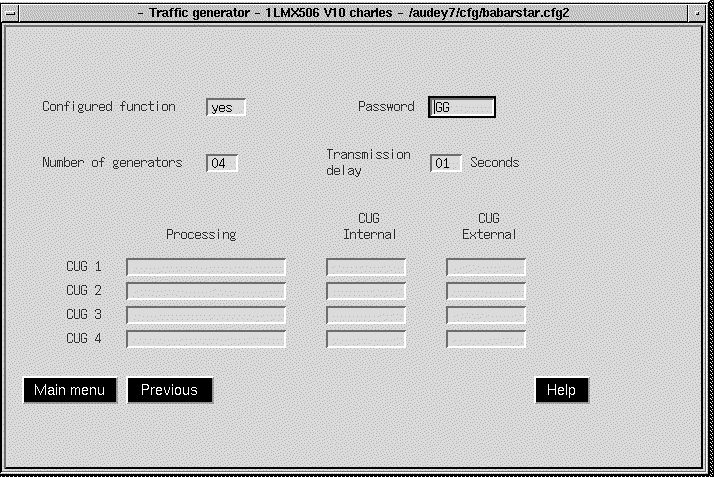
The Traffic Generator service tests the connection between APS and the selected node. Traffic Generator parameters are set using the Configuration Editor screen. After selecting the Traffic Generator screen, a connection is established, a window is opened, and the stream of data (generated traffic) is displayed. (See Figure 5-55.)
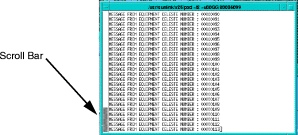
Closing the window terminates the traffic generator.
Service windows for traffic generator, statistics, and events have scroll bars. Use the Center mouse button to scroll up into the window to view more data.
The Statistics service displays node operation statistics. Refer to the FastPADmp/mpr Management manual for a description of statistics information. (See Figure 5-56.)
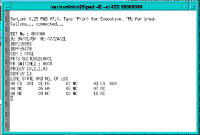
Gathering statistics from the node can take up to 30 seconds.
The Statistics (Hex) service function displays node statistics in Hex format. (See Figure 5-57.)
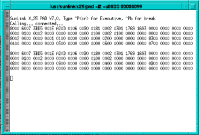
Figure 5-58 shows the results of the telemaintenance status function (LS03S) requested for line 3:
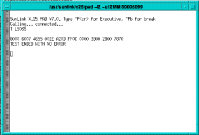
Other Diagnostic functions that can be performed include connecting and disconnecting a line.
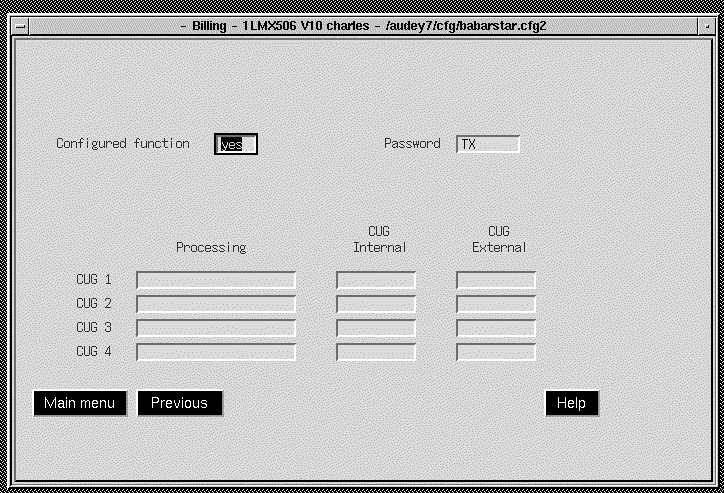
The Billing service function retrieves billing information for the node as set on a per-line basis as described in the FastPADmp/mpr Configuration manual. (See Figure 5-59.)
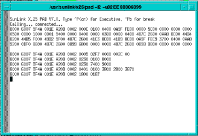
The Events service function retrieves the outstanding events log from the selected node and displays it in ASCII format. (See Figure 5-60.) Refer to the FastPADmp/mpr Management manual for a description of Event ASCII format.
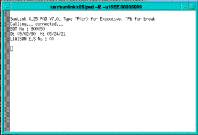
The Events (Hex) service function retrieves the outstanding events log from the selected node and displays it in Hex format. (See Figure 5-61.)
![]()
![]()
![]()
![]()
![]()
![]()
![]()
![]()
Posted: Thu Jan 25 14:47:07 PST 2001
All contents are Copyright © 1992--2001 Cisco Systems, Inc. All rights reserved.
Important Notices and Privacy Statement.