|
|

Table Of Contents
Starting the ISM User Interface
Using the ISM Command-Line Interface
Using ISM PF Keys, Command Keys, and Entry Fields
Viewing ISM Event Log Messages
Viewing the Activity Log Browse Panel
Using the ISM Status Summary Panel
Using the Resource Status Panel
Using the Resource Status with Options Panel
Starting the ISM Web Interface
Using the ISM Web Command Page
Using ISM
This chapter describes how to use ISM. It provides specific information on the following topics:
•
Starting the ISM User Interface
•
Starting the ISM User Interface
Note
To start the ISM standard NetView 3270 program interface, hereafter called the standard interface, log into NetView, type ism on the command line of the NetView main menu panel, and press Enter.
Note
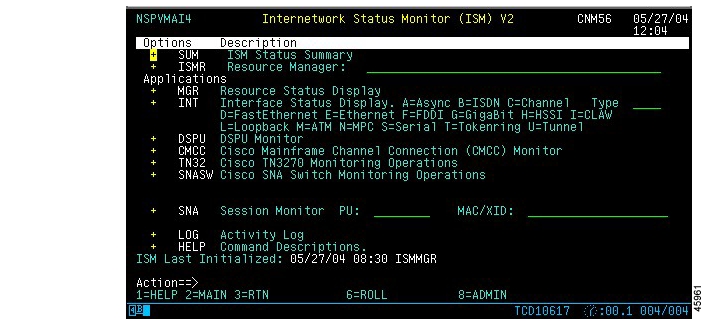
The Internetwork Status Monitor (ISM) main menu panel ( Figure 2-1) is displayed.
Figure 2-1 ISM Main Menu Panel
This panel shows the date and time ISM was last initialized and the name of the ISM autotask (ISMMGR).
Note
Navigating in ISM
This section describes how to navigate ISM's menus, panels, function keys and command lines. It provides specific information on the following topics:
•
•
Using the ISM Main Menu
The ISM main menu panel ( Figure 2-1) displays enabled ISM options and applications. To run an option or application, position the cursor on the option or application and press Enter. The selected application panel is displayed.
Using ISM Application Menus
Use ISM application menus to perform the following functions:
•
•
•
•
Table 2-1 describes functions in the ISM application menu panels.
Using the ISM Command-Line Interface
Use the ISM or NetView command line to access ISM applications, both those that appear on the ISM main menu panel, and those that do not appear on ISM menus.
To use the comman- line interface, position the cursor on the ISM command-line prompt, enter an ISM function command, and press Enter. ISM displays the application panel.
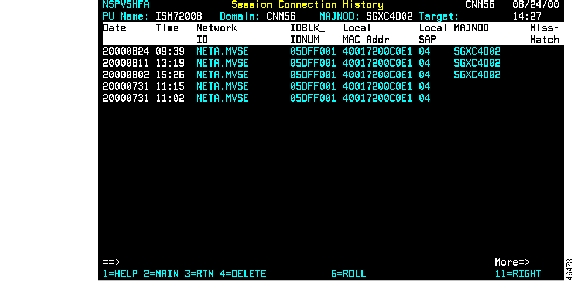
For example, you can enter the ism mgr command at the Session Connection History panel ( Figure 2-2) command prompt.
Figure 2-2 Session Connection History Panel
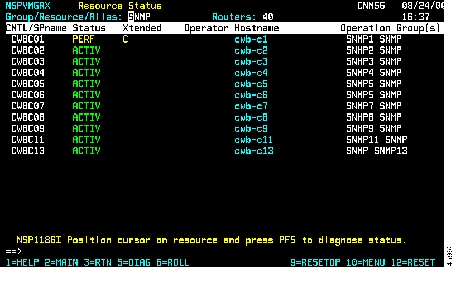
The Resource Status panel ( Figure 2-3) is displayed:
Figure 2-3 Resource Status Panel
Using ISM PF Keys, Command Keys, and Entry Fields
Use ISM PF keys to navigate panels or run applications. Table 2-2 describes standard ISM PF key functions. (If a panel uses a non-standard PF key function, the function is called out on the panel.)
Use the following standard keys to navigate or update ISM panel options:
•
•
•
You can easily locate options and enter data in ISM input fields. There are two types of fields displayed on ISM panels:
•
•
Viewing ISM Event Log Messages
This section describes how to access and view ISM event log messages. It provides information on the following topics:
•
ISM Event Log Functions
The ISM Event Log performs the following functions:
•
•
•
Viewing the Activity Log Browse Panel
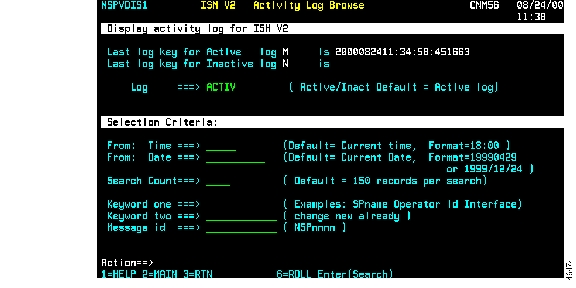
To view the Activity Log Browse panel, position the cursor on the LOG line and press Enter. The Activity Log Browse panel ( Figure 2-4) is displayed.
Figure 2-4 Activity Log Browse Panel
Searching the ISM Event Log
To search for ISM events, on the Activity Log Browse panel ( Figure 2-4), in the Log field, enter the name of the event log to search:
•
•
You can also enter one or more of the following search parameters:
•
•
•
•
•
•
Press Enter to display event records in the Event Log panel that match your search criteria.
Viewing the Event Log Panel
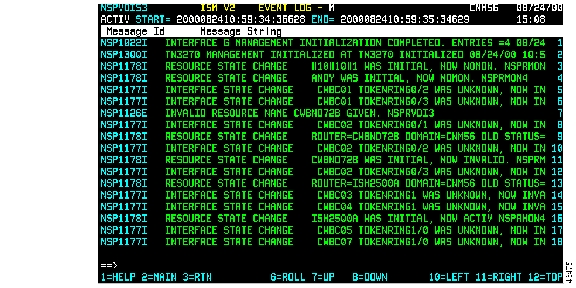
The ISM Event Log panel ( Figure 2-5) displays current and past event log messages.
Figure 2-5 ISM Event Log Panel
To view help for a message, position the cursor on a message and press PF1.
To return to the Activity Log Browse panel ( Figure 2-4) and change the Search Rules, press PF3.
To view earlier event records, press PF7.
To view later (more current) event records, press PF8.
Using ISM Status Panels
The following subsections describe how to monitor network resources using the following ISM panels:
•
•
•
Using the ISM Status Summary Panel
The ISM Status Summary panel monitors the status of ISM managed resources. You can view the status by resource type and the number of resources in the selected status condition.
This section describes how to use the ISM Status Summary panel to perform the following tasks:
•
•
•
Viewing the ISM Status Summary Panel
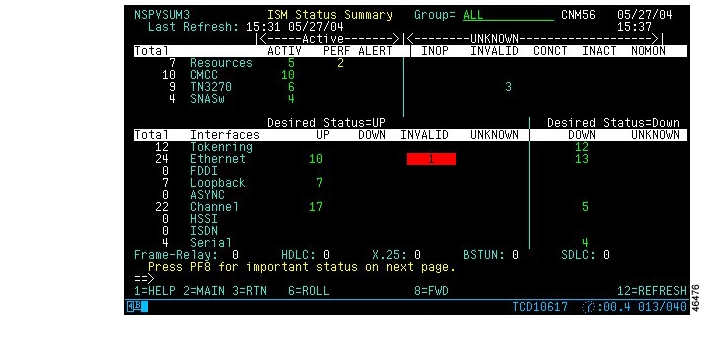
To view the ISM Status Summary panel, on the ISM main menu panel, position the cursor on the SUM line and press Enter. The first panel of the ISM Status Summary ( Figure 2-6) is displayed.
Figure 2-6 ISM Status Summary—First Panel
Viewing Detailed Resource Information
To display detailed resource information, position the cursor on a resource type condition and press Enter.
Viewing the Total Number of ISM Resources
To use the ISM Status Summary panel to display the total number of ISM managed resources, position the cursor on the Total field for resources, then press Enter. ISM lists all ISM managed resources.
If there is a performance (PERF) or alert condition for your selected resource field, only resources in that condition are displayed.
Viewing Resources by Group
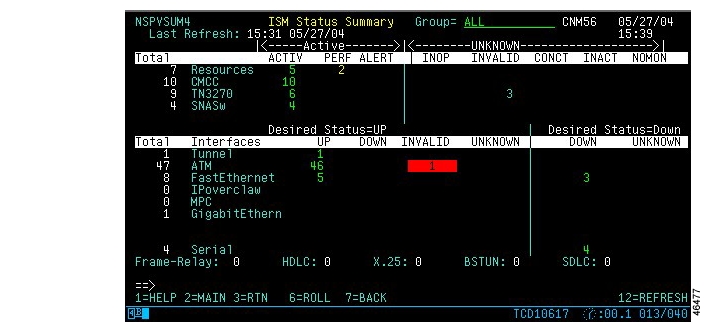
To use the ISM Status Summary panel to view resources categorized by group, enter the group name in the Group field, then press Enter. ISM displays resources for that group. Figure 2-7 shows a sample summary screen for group ALL.
Figure 2-7 ISM Status Summary Panel—Second Panel
If your operator's profile is authorized for resource group filters, you can view only the group names within that profile. See the "Enabling Monitoring Options for Multiple Routers" section for more information.
Using the Resource Status Panel
To monitor resources, in the ISM main menu panel ( Figure 2-1) position the cursor on the MGR line and press Enter. The Resource Status panel ( Figure 2-3) is displayed, showing the status of all resources managed by ISM.
The Resource Status panel provides the following features:
•
•
•
To diagnose a resource condition from the Resource Status panel, position the cursor on a resource to diagnose and press PF5. ISM automatically displays the appropriate diagnostic panel for resource condition, such as NetView's NPDA for troubleshooting hardware problems.
•
–
–
•
For details about monitoring resources, see "Monitoring ISM Resources"
Using the Resource Status with Options Panel
The Resource Status with Options panel offers the following features:
•
•
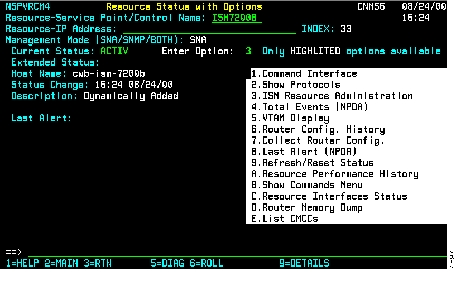
To view the Resource Status with Options panel, select a resource on the Resource Status panel ( Figure 2-3), then press Enter. The Resource Status with Options panel ( Figure 2-8) is displayed.
Figure 2-8 Resource Status with Options Panel
To diagnose a resource condition from the Resource Status with Options panel, press PF5. ISM displays the appropriate diagnostic panel for the resource condition, such as NetView's NPDA for troubleshooting hardware problems.
To run one or more resource menu options, type a menu option number or letter in the Enter Option field (or position the cursor on the desired option), then press Enter.
The options displayed depend on the resource type and how it is managed. Available options are displayed in black-on-white. Unavailable options are displayed in blue.
Accessing NetView
You can switch between ISM and the NetView console from any panel in ISM. From NetView, you can browse the NetView log and run NetView commands and then return to ISM. To go to the NetView console from ISM, press PF6.
To return to ISM from NetView, press PF6 again.
Using the ISM Web Interface
This section describes how to use the ISM Web interface, and provides specific information on the following topics:
•
•
•
Note
Starting the ISM Web Interface
To start ISM in a Web browser, complete the following steps:
Step 1
Step 2
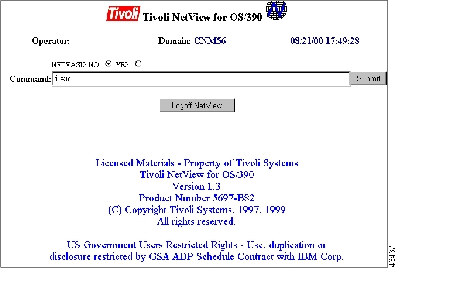
Figure 2-9 Tivoli NetView for OS/390 Page
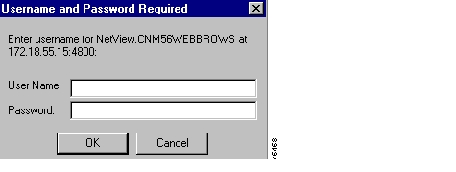
Step 3
Figure 2-10 Username and Password Required Dialog Box
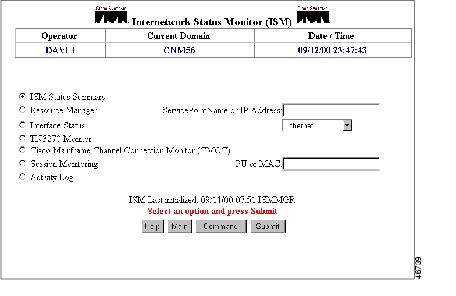
Step 4
Figure 2-11 ISM Main Menu Page
Step 5
Navigating the Web Interface
The NetView system administrator has the following options:
•
•
•
Using the ISM Web Command Page
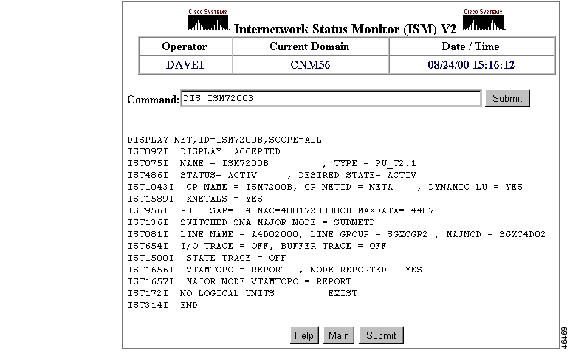
Figure 2-12 shows the output of the NetView dis command.
Figure 2-12
NetView Web Command Output Panel
Using the ISM Activity Log
The ISM Activity Log records ISM events. When ISM resources change status, or you update their definitions, the ISM activity log records the event. It maintains both primary and secondary logs. When the active log is full, a secondary log automatically becomes active.
You can view the contents of the active or inactive logs, and indicate a date and time range to view events. Once you open the log, you can change the review date and time range.
Viewing the ISM Activity Log
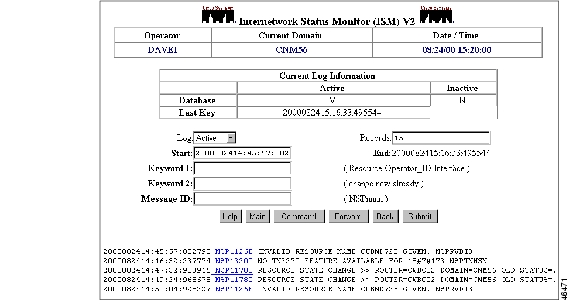
To view the ISM Activity Log, select the Activity Log option on the ISM main menu, then click Submit to display the browse menu for the active ISM log ( Figure 2-13).
Figure 2-13 Browse Menu for ISM Activity Log
Viewing the ISM Inactive Log
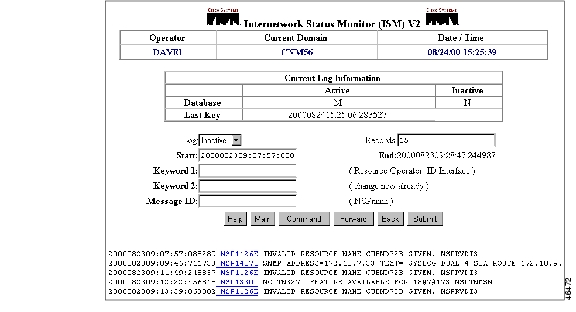
To view events in the inactive log, click the Log field, select Inactive, and click Submit. The browse menu for the inactive ISM log ( Figure 2-14) is displayed.
Figure 2-14 Browse Menu for ISM Inactive Log
Viewing Events
To display events for a selected date or time range, perform one of the following tasks on the active ISM log ( Figure 2-13) or inactive ISM log ( Figure 2-14) and click Submit:
•
•
•
•
![]()
![]()
![]()
![]()
![]()
![]()
![]()
![]()
Posted: Wed Oct 13 00:44:21 PDT 2004
All contents are Copyright © 1992--2004 Cisco Systems, Inc. All rights reserved.
Important Notices and Privacy Statement.