|
|

As you enable ISM monitoring resources, keep the following considerations in mind:
To monitor ISM network resource status, complete the tasks in the following sections:
Use the following procedures to perform global resource management:
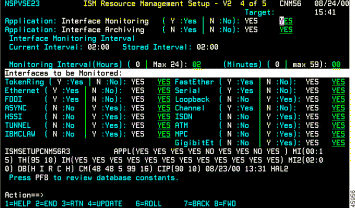
The Monitoring Interval field on the ISM Resource Management Setup—Third Panel (Figure 4-5) controls the time that an ISM monitoring autotask waits before contacting resources, collecting statistics, or updating status. The default monitoring interval is 15 minutes.
Use the following procedure to enable resource monitoring intervals:

The ISM Administration menu panel (Figure 4-2) is displayed.
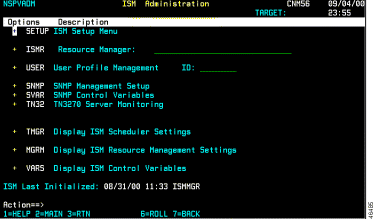
Step 2 Select SETUP and press Enter. The ISM Resource Management Setup—First Panel (Figure 4-3) is displayed.
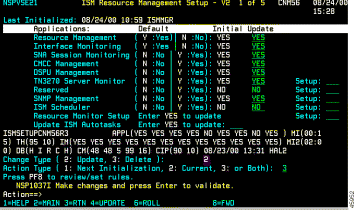
Step 3 Press PF8. The ISM Resource Management Setup—Second Panel (Figure 4-4) is displayed.
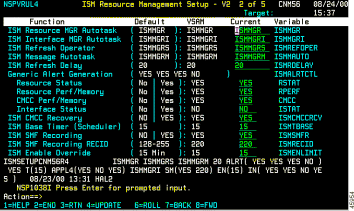
Step 4 Press PF8. The ISM Resource Management Setup—Third Panel (Figure 4-5) is displayed.
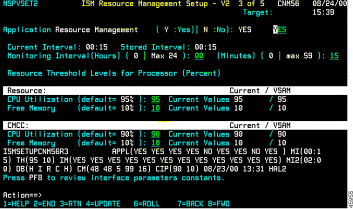
Use this panel to change the monitoring interval for all resources.
Use the ISM Scheduler to balance the monitoring load among a large number of resources. You can assign resources and monitoring intervals to resource groups. For more information about using the ISM Scheduler, see the "Enabling Resource Monitor Scheduling" section.
You can modify CPU and memory thresholds that ISM uses for monitoring resources to issue alerts for CPU and memory performance conditions on a global or individual resource basis. The default threshold settings are 95 percent for CPU utilization and 10 percent free memory.
Use the following procedure to modify CPU and memory thresholds:
Step 2 On the Resource option, type new CPU utilization and free memory values, then press Enter.
Step 3 (Optional) Remove resource and threshold settings by typing Off and pressing Enter.
If threshold settings are specified, it means that ISM indicates a performance alert (status is PERF) for the resource when the following conditions occur:
 |
Note ISM issues a generic alert in NetView's NPDA hardware monitor application if you have enabled the Resource Perf/Memory alert option on the ISM Resource Management Setup—Second Panel. For more information about enabling alerts to NPDA, see the "Enabling Resource Alert Generation" section. |
To override the CPU and memory thresholds that are enabled for an individual resource, use the ISM Resource Administration panel (Figure 4-11).
To enable or disable interface archiving for all resources, use the ISM Resource Management Setup—Fourth Panel (Figure 4-6). Enter Y or N in the Interface Archiving option.
To override the CPU and memory thresholds that are enabled for an individual resource, use the ISM Resource Administration panel (Figure 4-11).
Use the following procedure to enable resource alert generation:
Step 2 Select SETUP and press Enter. The ISM Resource Management Setup—First Panel (Figure 4-3) is displayed.
Step 3 Press PF8. The ISM Resource Management Setup—Second Panel (Figure 4-4) is displayed.
Step 4 To enable alerts for resource hardware status conditions, enter Yes in the Resource Status option under Generic Alert Generation.
Step 5 To enable alerts for resource performance and memory conditions, enter Yes in the Resource Perf/Memory option under Generic Alert Generation.
Step 6 To return to the ISM Resource Management Setup—First Panel, press PF7.
Step 7 In the Change Type field, enter 2 (Update).
Step 8 In the Action Type field, enter 3.
Step 9 Press PF4 to save your changes.
If you assign a resource to more than one group and also enable the ISM Scheduler application, ISM monitors the resource according to the monitoring interval associated with the first group to which the resource is assigned. The order in which you specify a group ID for a resource affects the implementation of group scheduling.
To assign a single resource to a group, on the ISM Resource Administration panel (Figure 4-11), enter up to three group names in the Group(s) fields.
Use the following procedure to enable monitoring options for multiple routers:
Step 2 Select MGRM and press Enter to display the ISM Router Management Settings panels (Figure 4-7 and Figure 4-8).
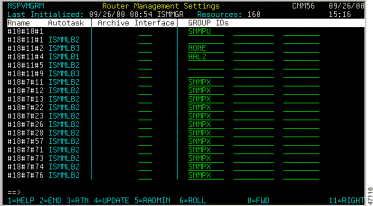
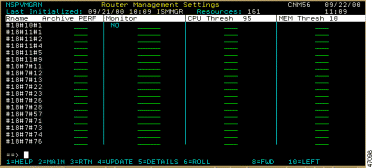
Step 3 Change settings as desired and press PF4 to save your changes.
Use the following procedure to enable monitoring for an individual resource:
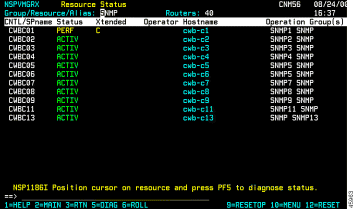
Step 2 On the Resource Status panel, position the cursor on the CNTL/SPname of a resource that you want to change, and press PF10. The Resource Status with Options panel (Figure 4-10) is displayed.

Step 3 In the Enter Option field, type 3 and press Enter. The ISM Resource Administration panel (Figure 4-11) is displayed.
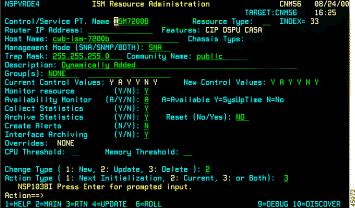
Step 4 Change the fields as desired.
Step 5 In the Change Type field, enter 2 (Update).
Step 6 In the Action Type field, enter 3.
Step 7 Press PF4 to save your changes.
This section includes information on the following topics:
By default, ISM enables resource monitoring and archiving of history and performance data, such as CPU and memory utilization statistics. To disable archiving for a single resource, on the ISM Resource Administration panel (Figure 4-11), enter No in the Archive Statistics field.
You can remove the history and performance records for an individual resource from the history database using the Reset option on the ISM Resource Administration panel (Figure 4-11). When you enable the Reset option, the history records are removed from the database when you press PF4 to update.
To delete history and performance records for an individual resource, on the ISM Resource Administration panel (Figure 4-11), enter Yes in the Reset field and press PF4.
You can change the VSAM database IDs that ISM uses for global resource management data only after ISM has been installed, and before ISM has been initialized for the first time. Change the database IDs using the Resource Management Constants Setup panel (Figure 4-12).
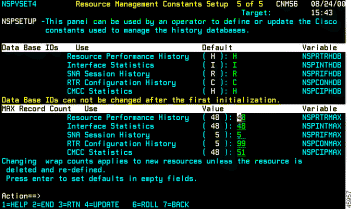
You can also change the maximum number of records that the database contains before overwriting the data contents. The wrap counts are set for all resources and interfaces. When these values are changed after initializing ISM, the new values apply to new resources and interfaces defined to ISM. You can apply the new values to existing resources if you reset the history for an individual resource or interface. After you reset the history records, the next time the file is initialized the new values are used.
Another method of applying changed wrap counts to previously defined resources and interfaces is to delete the resource definition and redefine the resource to ISM.
To create SNA resource management definitions, complete the tasks in the following sections:
 |
Note ISM uses VTAM RUNCMD to manage SNA resources. |
To add SNA resource management definitions, complete the following steps:

Step 2 Type the Service Point Name of an SNA router and press Enter. ISM automatically recognizes the resource as an SNA type and the Resource Status with Options panel displays the following new field data:
Resource Service Point/Control Name
Management Mode
Step 3 In the Enter Option field, type 1 (Command Interface) and press Enter. The Router Command Interface panel (Figure 4-14) is displayed.
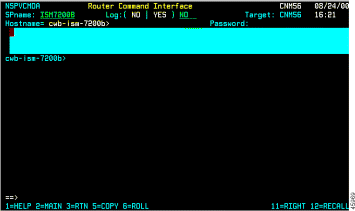
ISM sends a RUNCMD to the router.
Step 4 Press PF3 to display the Resource Status With Options panel, updated with the RUNCMD results.
To update or change SNA control data, complete the following steps:

Step 2 On the ISM Resource Administration panel, correct any missing or inaccurate information. Additionally, if a resource is also available to SNMP, enter the Router IP address and change the management mode to Both.
Step 3 Press PF4 to return to the Resource Status With Options panel.
Use the following procedure to display the current SNA interface status:
Step 2 In the Enter Option field, type C (Resource Interface Status) and press Enter to display the Interface Type panel (Figure 4-16).

To display details about a selected SNA interface, select an interface name on the Interface Status Panel and press Enter. The ISM Interface Operation Options panel (Figure 4-17) is displayed.
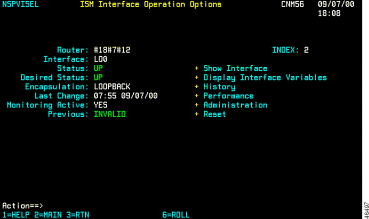
To enable SNA session monitoring, complete the following steps:
Step 2 In the Change Type field, enter 2 (Update).
Step 3 In the Action Type field, enter 3.
Step 4 Press PF4 to save your changes. The ISM main menu displays the new SNA Session Monitoring option.
To create SNMP resource management definitions, complete the tasks in the following sections:
Use the following procedure to add SNMP resource definitions:
Step 2 Add an SNMP resource definition from the ISM main menu or NetView command line by performing one of the following tasks:
nspsadd 172.18.7.37 cwbc05
The Resource Status with Options panel for SNMP (Figure 4-18) is displayed.
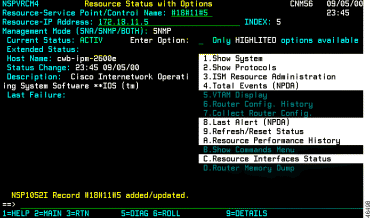
Step 3 In the Enter Option field, enter 3 and press Enter. The ISM Resource Administration panel for SNMP (Figure 4-19) is displayed.
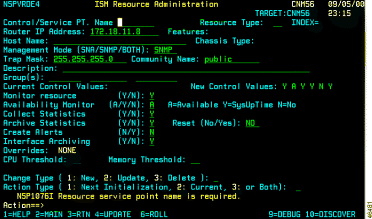
To contact and collect system data from an SNMP resource, complete the following steps:
Step 2 On the Control/Service Point Name field, type a control name for the resource, and press Enter. The ISM Resource Administration panel for SNMP is updated (Figure 4-20) to reflect the control name.

In Figure 4-20, the control name shown is created from a host name. When the resource is added dynamically, the control name is created from the IP address. (For example, 172.18.7.42 becomes #18#7#42.)
To create a control block and control file for an SNMP resource, press PF4 on the ISM Resource Administration panel for SNMP (Figure 4-19) to display the Resource Status with Options panel for SNMP (Figure 4-18). Data appears automatically in the required fields.
To add SNMP interfaces, on the Resource Status with Options panel for SNMP (Figure 4-18), in the Enter Options field, type 2 (Show Protocols) and press Enter. The Interface Status Table panel (Figure 4-21) is displayed.
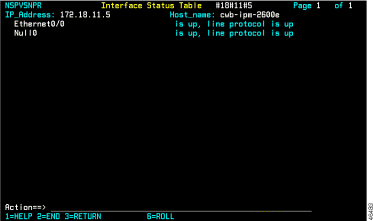
When ISM detects an SNMP resource, this panel displays the resource protocols.
When ISM does not detect an SNMP resource, the system creates a control block and control file for each resource.
To update the status in the control block, complete the following steps:
Step 2 Position the cursor on an interface and display the MIB variables for the interface.
Step 3 Press PF3 to return to the ISM Interface Operation Options panel (Figure 4-17).
Step 4 In the Enter Option field, type C (Resource Interface Status) and press Enter to display the Interface Type panel (Figure 4-16).
To rename an SNMP device control (CNTL), complete the following steps:

Step 2 Position the cursor on the SNMP resource to be renamed, then press Enter. The Resource Status with Options panel (Figure 4-10) is displayed.
Step 3 In the Enter Option field, enter 3 and press Enter. The ISM Resource Administration panel (Figure 4-11) is displayed.
Step 4 Enter the new control name in the Control/Service Point Name field.
Step 5 In the Change Type field, enter 1 and press PF4. ISM creates a new SNMP control record with a duplicate IP address.
Step 6 Repeat Step 4.
Step 7 In the Change Type field, enter 3 and press PF4. ISM deletes the old CNTL resource.
Step 8 Press PF3 to return to the Resource Status panel.
Step 9 Position the cursor on the newly added resource and press Enter.
Step 10 Select option 2 to have ISM discover and build control files and control blocks for each SNMP interface.
Step 11 When ISM displays the Interface Type panel (Figure 4-16), press PF3 to return to the Resource Status panel.
Step 12 Select option 2 to update the status of the SNMP interfaces.
Step 13 When ISM displays the Interface Type panel with updated status, press PF3 to return again to the Resource Status panel.
Step 14 Press PF2 to return to the ISM main menu.
Use the following procedure to enable SNMP session monitoring:
Step 2 In the Change Type field, enter 2 (Update).
Step 3 In the Action Type field, enter 3.
Step 4 Press PF4 to save your changes. The ISM main menu displays the new SNMP Session Monitoring option.
For details on using the Web interface, see the "Displaying Resource Status Using the Web Interface" section.
This section describes how to perform the following tasks:
Use the ISM Status Summary panel (Figure 4-23) to monitor the overall status of all your resources by type of condition.
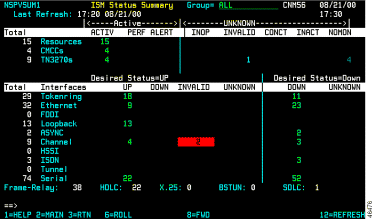
The ISM Status Summary panel uses a color-coded display to indicate different types of status conditions. New alerts are shown in a colored box. After you view the resources with new alerts, or if you leave the ISM Status Summary panel, the colored box is removed. The number in the column representing the resources in that condition remains color-coded unless the status condition is removed.
You can access other information when monitoring resources using the ISM Status Summary panel, as follows:
To view resource status and diagnose problems, use the Resource Status panel (Figure 4-9). To access the Resource Status panel, select MGR on the ISM main menu panel, or select a resource on the ISM Status Summary panel, then press Enter.
You can perform the following tasks on the Resource Status panel:
The color of the control name of a resource on the ISM Status Summary panel (Figure 4-23) or ISM Resource Status panel (Figure 4-9) indicates the condition of that resource. Table 4-1 lists the color and definition of each status.
| Color | Status | Definition |
Green | ACTIV | ISM can communicate with the resource. |
Red | CONCT | Resource is not connected to VTAM. |
Red | INOP | Resource failed to respond when a RUNCMD was issued, perhaps because the resource was made inactive by an operator. If a resource is in an inactive state, a System Services Control Point (SSCP)-to-PU session cannot be established. You must first activate the resource by issuing the NetView ACT command. |
Yellow | PERF | The resource is active, but ISM has detected a performance-related problem for the CPU or memory utilization thresholds, or an interface configured in the resource is down. |
Pink | ALERT | The resource is active, but an alert was detected through the NetView automation table for a resource managed by the resource control point. |
Turquoise | INVALID | Service point is unknown to VTAM. VTAM definition does not exist. |
Turquoise | INACT | An operator has de-activated the resource in VTAM. |
Reverse | nnnnn | An operator is enabled to the resource. |
Blue | NOMON | Resource monitoring is disabled. |
ISM provides a powerful diagnostic function that you can use to obtain information about the most critical problem affecting the resource. On the Resource Status panel (Figure 4-9) or the Resource Status with Options panel (Figure 4-10), press PF5 to display the diagnostic panel that ISM determines is best-suited to solve the resource's most critical problem.
For example, if an alert has been received from a resource (resource is displayed in pink and has an ALERT status), select the resource and press PF5 to display the appropriate panel to view the received alerts for that resource. If the problem is a hardware-related problem, ISM might open NPDA to show hardware status information from NetView.
The Resource Status panel (Figure 4-9) can display status information for up to 18 resources in a single view. If you have more than 18 resources, you can scroll forward or backward, or apply filters to display a subset of resources.
This section provides information on the following topics:
Group filtering allows you to view the status for logically grouped resources. For example, a group may include all the resources located in a region or department, or those of a particular device type. The group to which a resource belongs is assigned by an ISM administrator when the resource is defined to ISM, and only an ISM administrator can filter resources by groups. For more information about assigning resources to groups, see the "Enabling Monitoring Options for Multiple Routers" section.
This section includes information on the following topics:
To include filters for up to two resource groups on the ISM status panels, complete the following steps:

Step 2 In the Resource Group Filters option, type Y.
Step 3 In the Group 1 and Group 2 options, specify the resource group names that you want to include when viewing the ISM resource status displays.
Step 4 In the Change Type field, enter 2 (Update).
Step 5 In the Action Type field, enter 3.
Step 6 Press PF4 to save your changes.
Step 7 View the ISM status panels to see only the resources defined to the groups that you selected.
To view a logical group of resources from the Resource Status panel (Figure 4-9), in the Group/Resource/Alias option at the top of the panel, type the name of the resource groups that you want to view and press Enter. The resources are displayed that belong to the filter groups that you specified, and that you are authorized to see. Figure 4-25 shows sample filtering for resources assigned to the group MVS.
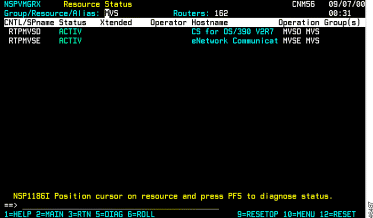
To include or exclude resources that match the filter criteria (up to three status types) for viewing on the ISM status panels, complete the following steps:
Step 2 In the Status Filters option, type Y.
Step 3 In the Exclude/Include option, do one of the following:
Step 4 In the Filter 1, Filter 2, and Filter 3 fields, specify the resource status types that you want to include or exclude when viewing the ISM resource status displays.
Step 5 In the Change Type field, enter 2 (Update).
Step 6 In the Action Type field, enter 3.
Step 7 Press PF4 to save your changes.
You can filter the resources that you want to view on the Resource Status panel (Figure 4-9).
In the Group/Resource/Alias field, enter the beginning characters of the control name you want to view, followed by an asterisk (*), and press Enter. (The asterisk acts as a wildcard, matching any remaining characters in the name.) Only the resources with control names that begin with the characters you specified are displayed. For example, to filter the display of all resources beginning with the characters cwb, type cwb* in the Group/Resource/Alias field.
If you are an enabled ISM user, you can release and reset a resource from an operator who is logged in to a resource in enabled mode, or who is in a busy state with a resource.
You can refresh or check the status of a resource from the Resource Status panel (Figure 4-9). Resources can be reset from the Resource Status panel depending upon where the cursor is positioned when you perform the reset operation.
To refresh outdated resource status information, press PF12. You can also reset and check the status of a resource by selecting the resource and pressing Enter to display the Resource Status with Options panel (Figure 4-10). Then, in the Enter Option field, type 9 and press Enter.
To view an ISM resource, complete the following steps:
Step 2 In the Enter Option field, type 3 and press Enter. The ISM Resource Administration panel is (Figure 4-11) displayed.
Complete the following tasks to view a resource as it is defined in VTAM:
Step 2 In the Enter Option field, type 5 and press Enter. The resource configuration as it is defined in VTAM is displayed in an Output panel (Figure 4-26).

Complete the following tasks to collect the current configuration of a resource:
Step 2 In the Enter Option field, type 7 and press Enter. The Router Configuration Collector panel (Figure 4-27) is displayed.
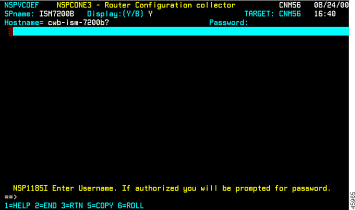
Step 3 In the Username field, type the user ID for the router.
Step 4 In the Password field, type the enable password and press Enter.
Step 5 Press PF10. Status messages are displayed as ISM requests and collects the router configuration.
Step 6 When you are notified that the configuration for the router has been saved, press Enter. The configuration you collected is archived.
Step 7 Press PF3 to terminate your enabled session.
To display a list of archived configuration files, complete the following steps:
Step 2 In the Enter Option field, type 6 and press Enter. The Archived Router Configurations panel (Figure 4-28) is displayed.

Step 3 To view the details of a configuration file, position the cursor on the record that you want to view and press Enter. The Archived Configuration Details panel (Figure 4-29) is displayed.
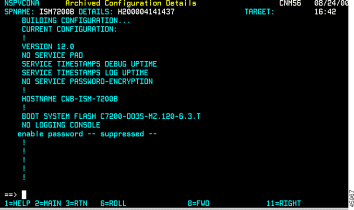
As an ISM security feature, if the command issued requires a password, the password is suppressed and not logged.
You can use the following methods to monitor resource performance:
The following sections describe the ways that you can monitor resource performance:
Specifying CPU and memory thresholds determines the level (expressed as a percentage of the CPU utilization and availability of free memory) that when exceeded will cause ISM to generate an alert. When a performance alert is generated, ISM displays PERF for the resource status.
Once you have set the monitoring interval and CPU and memory threshold levels, ISM will measure the performance of the resources in your network using those values. The results are archived in the Router Performance History data set. Any ISM user can view the records archived for a specific resource on the Router Performance History panel. If you are an ISM administrator, you can set the record wrap counts for the data set in the ISM Resource Management setup. For more information about setting the record wrap counts, see the "Changing the Database IDs and Maximum Record Counts" section.
To view performance history records for a specific resource, complete the following steps:
Step 2 In the Enter Option field, type A and press Enter. The Router Performance History panel (Figure 4-30) is displayed.
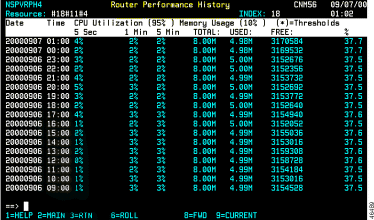
This panel shows CPU utilization and memory usage statistics. Threshold values are shown at the top of the display columns. If a threshold is exceeded, the threshold is shown in yellow.
Alerts generated by a resource that is being monitored by ISM are forwarded to the host by the service point configured in the resource. You can enable ISM to generate alerts for resources, interfaces, and CMCCs when thresholds are exceeded. For information about enabling alert generation in ISM, see the "Enabling Resource Alert Generation" section.
You can access NetView's Hardware Monitor Facility from within ISM to obtain a list of alerts generated by a specific resource and sent to NetView. For more information on using the NetView Hardware Monitor Facility, refer to the appropriate NetView operations manual.
You can perform the following tasks to view hardware alerts and events:
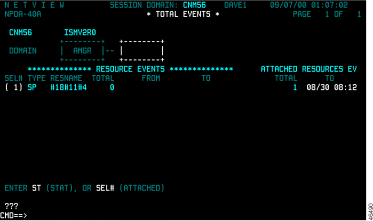
Complete the following tasks to display the total count of events in NetView's hardware monitor:
Step 2 In the Enter Option field, type 4 and press Enter. A NetView Hardware Monitor panel is displayed (Figure 4-31), listing the most recent count of total events (in reverse chronological order) generated by the resource.
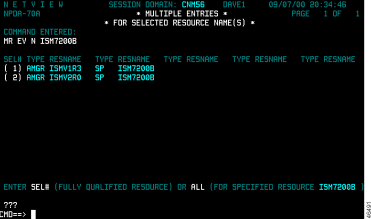
Step 2 In the Enter Option field, type 8 and press Enter. A NetView Hardware Monitor panel is displayed (Figure 4-32), listing the alert records generated by the resource.
You can use the ISM Router Command Interface panel (Figure 4-33) to connect to a router and issue commands that you would normally have to issue in a Telnet session. However, ISM does not accept some commands, such as telnet. Additionally, the commands you can issue from the Resource Command Interface panel are based on your authority level, as defined in your operator profile and on the security implemented in the router.
This section contains information on the following topics:
To issue commands to a router from the ISM main menu panel (Figure 4-1), complete the following steps:
Step 2 Type in the control name of the router and press Enter. The Router Command Interface panel (Figure 4-33) is displayed.

The Router Command Interface panel contains the following functional areas:
Step 3 To specify how to handle the output from the router command, specify one of the following options:
Step 4 In the Command Field, type the router command and press Enter.
Step 5 If a user ID or password is required, type the appropriate response at the corresponding prompt.
Step 6 To recall the last command that you issued, press PF12.
To issue router commands from the Resource Status panel (Figure 4-9), complete the following steps:
Step 2 In the Enter Option field, type 1 and press Enter. The Router Command Interface panel (Figure 4-33) is displayed.
Step 3 To specify how to handle the output from the router command, specify one of the following options:
Step 4 In the Command Field, type the router command and press Enter.
Step 5 If a user ID or password is required, type the appropriate response at the corresponding prompt.
Step 6 To recall the last command you issued, press PF12.
To issue router show commands, complete the following steps:
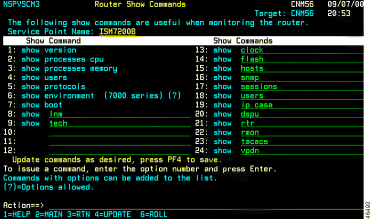
Step 2 On the Enter Option field, type B and press Enter. The Router Show Commands panel is displayed (Figure 4-34).

Step 3 To issue a command, type the number corresponding to the command and press Enter.
If you are an ISM administrator, you can add Cisco IOS software show commands to the Router Show Commands panel (Figure 4-34). (The show commands you add must be supported by Cisco IOS Release 11.0 and later.)
Complete the following tasks to add a Cisco IOS software show command to the Router Show Commands panel:
Step 2 Position the cursor on the line on which you want to add a show command.
Step 3 In the data-entry field on the line, type the parameter or parameters that correspond to the command you are adding (without the show keyword) and press F4. The next time you display the Router Show Commands panel, it includes the command you added.
To issue router memory commands, complete the following steps:
Step 2 Type D in the Enter Option field and press Enter. The Router Memory Dump Options panel (Figure 4-36) is displayed.

The following commands are displayed on the Router Memory Dump Options panel:
Step 3 To issue the command, type an X in the field corresponding to the memory command and press Enter.
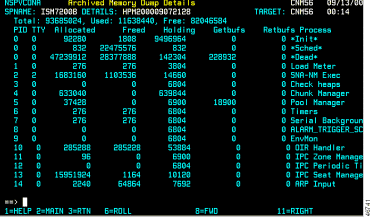
Step 4 To view the output from the command, press PF10. The Archived Router Memory Dumps panel (Figure 4-37) is displayed.
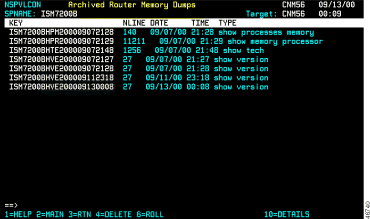
Each time you issue a command, a new record is created that contains the actual command output.
For details on using the standard interface, see the "Displaying Resource Status Using the Standard Interface" section.
This section describes the following tasks:
Use the ISM Status Summary page to monitor the overall status of all your resources by type of condition. To access this page, select ISM Status Summary on the ISM main menu page (Figure 4-39), then click Submit.
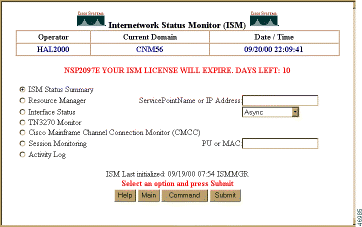
The ISM Status Summary page (Figure 4-40) is displayed.
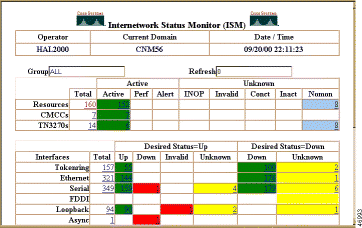
The ISM Status Summary page uses a color-coded display to indicate different types of status conditions. You can access other information when monitoring resources using the ISM Status Summary page, as follows:

You can perform the following tasks on the Resource Status page:
The Resource Status with Options page is displayed. Figure 4-42 shows the Resource Status with Options page for an SNA resource; Figure 4-43 shows the Resource Status with Options page for an SNMP resource.
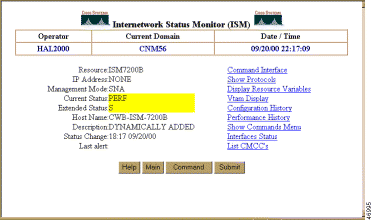

You can perform the following commands from the Resource Status with Options page:
The color of the service point name of a resource on the ISM Status Summary page (Figure 4-40) or ISM Resource Status page (Figure 4-41) indicates the condition of that resource. Table 4-2 lists the color and definition of each status:
| Color | Status | Definition |
Green | ACTIV | ISM can communicate with the resource. |
Red | CONCT | Resource is not connected to VTAM. |
Red | INOP | Resource failed to respond when a RUNCMD was issued, perhaps because the resource was made inactive by an operator. If a resource is in an inactive state, a System Services Control Point (SSCP)-to-PU session cannot be established. You must first activate the resource by issuing the NetView ACT command. |
Yellow | PERF | The resource is active, but ISM has detected a performance-related problem for the CPU or memory utilization thresholds, or an interface configured in the resource is down. |
Pink | ALERT | The resource is active, but an alert was detected through the NetView automation table for a resource managed by the resource control point. |
Turquoise | INVALID | Service point is unknown to VTAM. VTAM definition does not exist. |
Turquoise | INACT | An operator has de-activated the resource in VTAM. |
Blue | NOMON | Resource monitoring is disabled. |
To issue commands to a router, complete the following steps:
Step 2 Click on Command Interface. The Router Command Interface page (Figure 4-44) is displayed.

For a detailed description of the fields on this page, see the online help.
Step 3 In the Command Field, type the router command and click Submit.
To display the Management Information Base (MIB) variables, select Show System on the Resource Status with Options page (Figure 4-43) and click Submit. The System Status page (Figure 4-45) is displayed.

For a detailed description of the fields on this page, see the online help.
To display the global and interface-specific status of any configured protocols, select Show Protocols on the Resource Status with Options page (Figure 4-42) and click Submit. The Protocols Status page (Figure 4-46) is displayed.

For a detailed description of the fields on this page, see the online help.
To display detailed information about a resource's variables, including current values, select Display Resource Variables on the Resource Status with Options page (Figure 4-42) and click Submit. The Resource Variables page (Figure 4-47) is displayed.

For a detailed description of the fields on this page, see the online help.
Complete the following tasks to view a resource as it is defined in VTAM:
Step 2 Click on VTAM Display. The VTAM Resource Configuration page (Figure 4-48) is displayed.

For a detailed description of the fields on this page, see the online help.
To display a list of archived configuration files for an SNA resource, complete the following steps:
Step 2 Click on Configuration History. The Archived Router Configurations page (Figure 4-49) is displayed.

For a detailed description of the fields on this page, see the online help.
Step 3 To display a specific configuration, click on a value in the Key field.
ISM measures the performance of the routers in your network using the monitoring interval and CPU and memory threshold values you set. The results are archived in the Router Performance History data set. Any ISM user can view the records archived for a specific router on the Router Performance History page. If you are an ISM administrator, you can set the record wrap counts for the data set in the ISM Resource Management setup. For more information about setting the record wrap counts, see the "Changing the Database IDs and Maximum Record Counts" section.
To view performance history records for a specific router, complete the following steps:
Step 2 Click on Performance History. The Router Performance History page (Figure 4-50) is displayed.
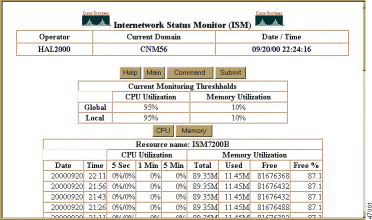
This page shows CPU utilization and memory usage statistics. Threshold values are shown at the top of the display columns. If a threshold is exceeded, the threshold is shown in yellow.
For a detailed description of the fields on this page, see the online help.
To issue router show commands, complete the following steps:
Step 2 Click on Show Commands Menu. The Router Show Commands page is displayed (Figure 4-51).
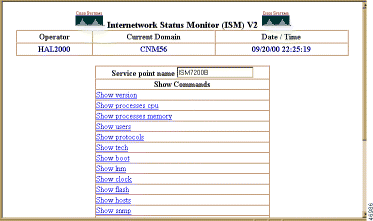
For a detailed description of the fields on this page, see the online help.
Step 3 To issue a command, click on its name. The following commands are displayed on the Router Show Commands page:
To display the status of any configured interfaces, select Interfaces Status on the Resource Status with Options page (Figure 4-43) and click Submit. The Interfaces Type page (Figure 4-52) is displayed.
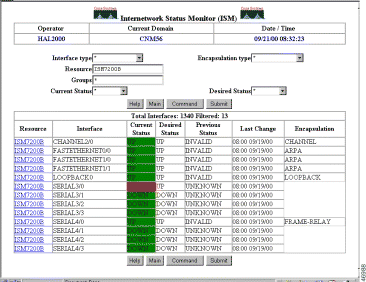
For a detailed description of the fields on this page, see the online help.
To display the status of any configured CMCCs, select List CMCCs on the Resource Status with Options page (Figure 4-43) and click Submit. The CMCCs Status page (Figure 4-53) is displayed.
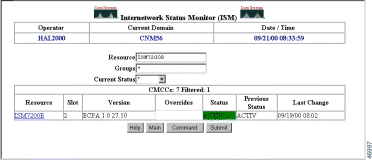
For a detailed description of the fields on this page, see the online help.
![]()
![]()
![]()
![]()
![]()
![]()
![]()
![]()
Posted: Sat Oct 7 16:41:37 PDT 2000
Copyright 1989-2000©Cisco Systems Inc.