|
|

This chapter describes the following interface monitoring tasks:
ISM's architecture provides two layers of interface control options—global and individual.
This section describes how to enable interface monitoring, and how to set global interface control options. For details on how to set individual interface control options, including how to disable monitoring for specific interfaces, see the "Enabling Management Options for Individual Interfaces" section.
To enable ISM to monitor interfaces for all resources in ISM, use the following procedure:

The ISM Administration menu panel (Figure 5-2) is displayed.
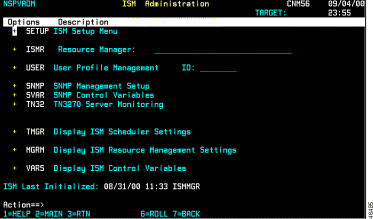
Step 2 Position the cursor on the SETUP line and press Enter. The ISM Resource Management Setup—First Panel (Figure 5-3) is displayed.
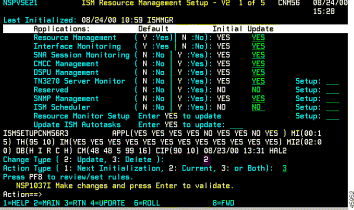
Step 3 In the Interface Monitoring Update field, type Y and press Enter.
Step 4 To enable additional global interface control options, press PF8. The ISM Resource Management Setup—Second Panel (Figure 5-4) is displayed.
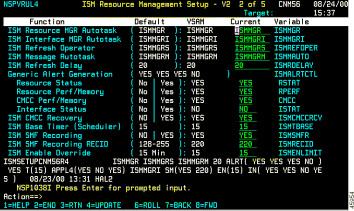
Step 5 Press PF8. The ISM Resource Management Setup—Third Panel (Figure 5-5) is displayed.
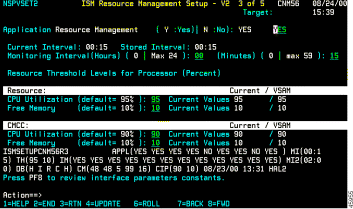
Step 6 Press PF8. The ISM Resource Management Setup—Fourth Panel (Figure 5-6) is displayed.
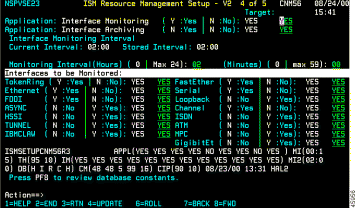
Step 7 To specify an interface monitoring interval for all interfaces, enter the number of hours and minutes in the Monitoring Interval (Hours) and (Minutes) option. The default interval is 12 hours and 0 minutes.
Step 8 To enable types of interfaces to be monitored, type Y in the corresponding field.
Step 9 Press PF7 three times to return to the ISM Resource Management Setup—First Panel.
Step 10 In the Change Type field, enter 2 (Update).
Step 11 In the Action Type field, enter 3.
Step 12 Press PF4 to save your changes and update the ISM resource management setup definition.
To enable interface monitoring options for an individual interface from the ISM main menu panel, follow these steps:
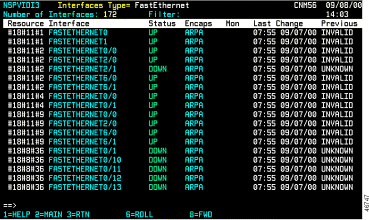
Step 2 Position the cursor on the name of the resource whose interface you want to modify and press Enter. The ISM Interface Operation Options panel is displayed (Figure 5-8).
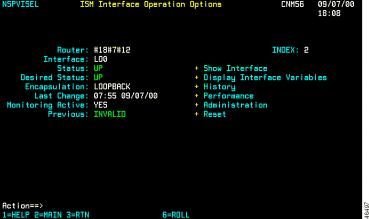
Step 3 Position the cursor on the Administration option and press Enter. The ISM Interface Administration panel (Figure 5-9) is displayed.

Step 4 To specify a status for the interface, enter Up or Down beside the Desired Status option.
Step 5 To disable monitoring for the selected interface, enter No beside the Monitor Mode option.
Step 6 In the Change Type field, enter 2 (Update).
Step 7 In the Action Type field, enter 3.
Step 8 Press PF4 to save your changes and update the ISM interface management setup definition.
To enable interface monitoring options for an individual interface from the ISM Status Summary panel, follow these steps:

The Interfaces Type panel is displayed, showing resources with the selected interface type. Figure 5-7 shows a sample panel for Ethernet interfaces.
Step 2 Position the cursor on the name of the resource whose interface you want to modify and press Enter. The ISM Interface Administration panel (Figure 5-9) is displayed.
Step 3 Position the cursor on the Administration option and press Enter.
Step 4 To specify a status for the interface, enter Up or Down beside the Desired Status option.
Step 5 To disable monitoring for the selected interface, enter No beside the Monitor Mode option.
Step 6 In the Change Type field, enter 2 (Update).
Step 7 In the Action Type field, enter 3.
Step 8 Press PF4 to save your changes and update the ISM interface management setup definition.
To enable options for collecting interface statistics at high rates, complete the following tasks:
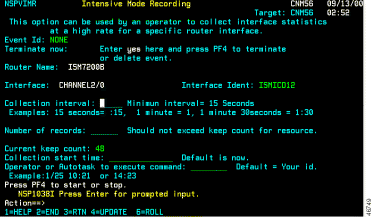
Step 2 When you have completed specifying the options, press Enter to confirm the options.
Step 3 To update the ISM interface management setup definition, press PF4 to return to the ISM Interface Administration panel.
You can disable the archiving of interface history and performance data for all resources, or for individual resources. See the "Enabling Resource Interface Archiving" section.
To delete history and performance records for a specific resource, on the ISM Interface Administration panel (Figure 5-9), enter Yes beside the Delete history and performance records option, enter 2 in the Change Type field, and press PF4.
When you configure the ISM management environment, you specify the types of interfaces you want monitored and the interval (in hours and minutes) at which you want them monitored. For more information on selecting the interfaces that are enabled for monitoring by ISM, see the "Enabling Interface Monitoring" section.
After ISM is enabled to monitor interfaces, you can perform the following monitoring operations for interfaces and view status descriptions:
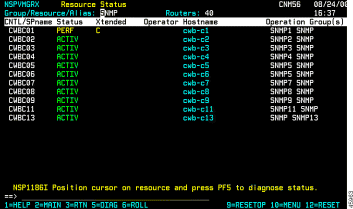
The Resource Status with Options panel is displayed (Figure 5-13).

Step 2 Enter C beside the Enter Option field and press Enter. The Interfaces Type panel (Figure 5-14) is displayed for all interfaces ISM can monitor.

Step 3 To access the ISM Interface Administration panel (Figure 5-9) for a particular interface, position the cursor on the interface and press Enter. The ISM Interface Operation Options panel is displayed (Figure 5-8). Then position the cursor on the Administration option and press Enter to display the ISM Interface Administration panel.
 |
Note Pressing PF2 on this panel returns you to the Resource Status with Options panel, not to the ISM main menu panel. |
ISM provides a couple of ways for you to monitor interfaces of a particular type and status:
Complete the following tasks to monitor interface types and status from the ISM Status Summary panel:
Step 2 To view a list of all interfaces of a particular type, position the cursor in the Total field beside the interface type that you want to view and press Enter. The Interfaces Type panel is displayed, showing all resources with interfaces of the selected type being monitored by ISM.
Step 3 To view a list of all interfaces of a particular type categorized by status, position the cursor in the status field that you want to view and press Enter. The Interfaces Type panel (Figure 5-14) is displayed, showing only the interfaces with the selected status. The status filter is displayed at the top of the panel in the Filter field.
Table 5-1 lists the color and definition of each status.
Color
| Status
| Definition
|
| | |
| | |
| | |
| | |
| | |
| | |
Step 4 To monitor interface types and status from the ISM main menu panel, position the cursor in the Type field beside the INT option, enter the letter that corresponds to the interface type you want to modify, and press Enter. The Interfaces Type panel is displayed, showing the interfaces of the selected type for all resources being monitored by ISM.
There are many ways to access the Interface Operation Options panel (Figure 5-8) in ISM. Some of the ISM applications provide direct access to the command interface and list the commands that are specific to the resource currently being managed. When you are using the Interface Monitoring application panels in ISM, you can access panels that provide resource commands that are specific to managing interfaces.
To view history statistics for a particular interface in a resource:
Step 2 Select History. The history statistics records logged for the selected interface are displayed on a statistics panel. Figure 5-15 shows a sample Statistics for FastEthernet Interface panel.

There can be up to four additional panels of statistics, depending on the interface type. To display additional panels of statistics, press PF11. For information about the statistics on these panels, press PF1 for Help.
To view performance statistics for a particular interface in a resource:
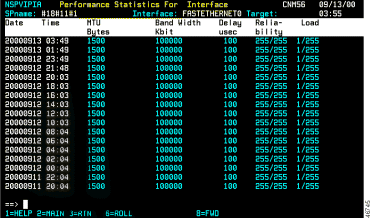
Step 2 Select Performance. The performance statistic records logged for the selected interface are displayed on the Performance Statistics for Resource Interface panel (Figure 5-16).
To view the internal variables used by ISM to perform interface management, on the ISM Interface Operation Options panel (Figure 5-8), position the cursor on Display Interface Variables and press Enter. The ISM Interface Variables panel (Figure 5-17) is displayed. The information on this panel is useful when you troubleshoot ISM operational problems.

After ISM is enabled to monitor interfaces, you can perform the following monitoring operations for interfaces and view status descriptions:
Complete the following tasks to display a list of interfaces configured in a specific resource:

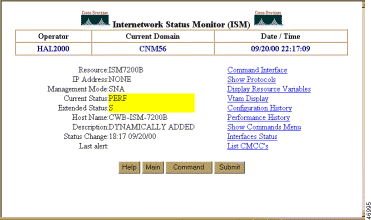
The Resource Status with Options page (Figure 5-19) is displayed.
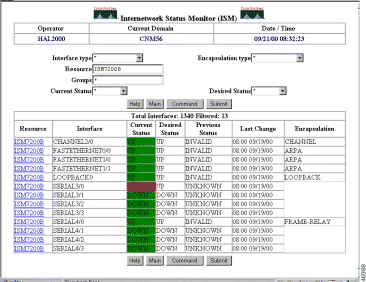
Step 2 Click on Interfaces Status. The Interfaces Type page (Figure 5-20) is displayed for all interfaces ISM can monitor on the resource.
Step 3 To access the ISM Interface Operation Options page (Figure 5-21) for a particular interface, click on the interface.

ISM provides a couple of ways for you to monitor interfaces of a particular type and status:
Complete the following tasks to monitor interface types and status from the ISM Status Summary page:
The ISM Status Summary page (Figure 5-23) is displayed, showing:
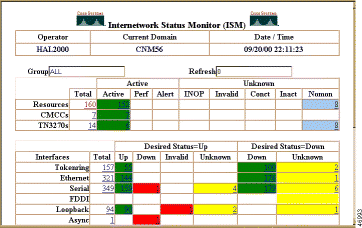
Step 2 To view a list of all interfaces of a particular type, click on the value in the Total column beside the interface type that you want to view. The Interfaces Type page (Figure 5-20) is displayed, showing all resources with interfaces of the selected type being monitored by ISM.
Step 3 To view a list of all interfaces of a particular type categorized by status, click on the value in the Status column. The Interfaces Type page (Figure 5-20) is displayed, showing only the interfaces with the selected status. The status filter is displayed at the top of the page in the Filter field.
Table 5-1 lists the color and definition of each status.
Color
| Status
| Definition
|
| | |
| | |
| | |
| | |
| | |
| | |
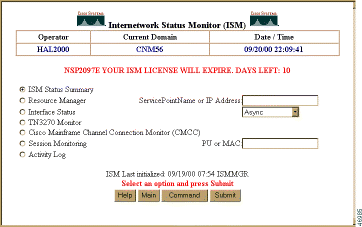
Step 4 To monitor interface types and status from the ISM main menu page, select Interface Status, select an interface type from the drop-down list box, and click Submit. The Interfaces Type page (Figure 5-20) is displayed. Select an interface type from the Interface type drop-down list box, and click Submit. The Interfaces Type page is displayed, showing the interfaces of the selected type for all resources being monitored by ISM.
There are many ways to access the Interface Operation Options page (Figure 5-21) in ISM.
Some of the ISM applications provide direct access to the command interface and list the commands that are specific to the resource currently being managed. When you are using the Interface Monitoring application pages in ISM, you can access pages that provide resource commands that are specific to managing interfaces.
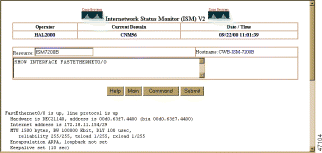
You can also run the show interface command for a selected interface on the Interfaces Type page (Figure 5-20) by clicking on a resource, clicking on Show Interface, and selecting a command. Figure 5-24 shows sample output for the show interface fastethernet 0/0 command:
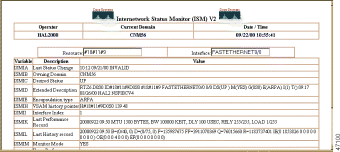
Step 2 Click on Display Interface Variables. The internal variables used by ISM to perform interface management are displayed on the ISM Interface Variables page (Figure 5-25). The information on this page is useful when you troubleshoot ISM operational problems.
To view history statistics for a particular interface in a resource:
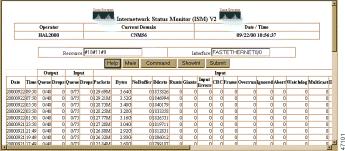
Step 2 Click on History. The history statistics records logged for the selected interface are displayed on the Statistics for Resource Interface page (Figure 5-26).
To view performance statistics for a particular interface in a resource:
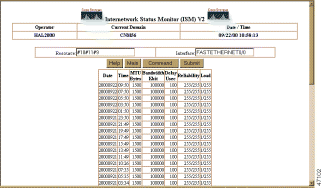
Step 2 Click on Performance. The performance statistic records logged for the selected interface are displayed on the Performance Statistics for Resource Interface page (Figure 5-27).
![]()
![]()
![]()
![]()
![]()
![]()
![]()
![]()
Posted: Sat Oct 7 16:22:48 PDT 2000
Copyright 1989-2000©Cisco Systems Inc.