|
|

This chapter explains how to use the ISM Resource Management Setup panels to specify the global CMCC management options for the ISM program. Pertinent information is in the following sections:
The options on the ISM Resource Management Setup panels apply to all routers that ISM manages. You can override the global setup options by defining router-specific CMCC options. For more information, see the "Specifying Administration Options for a CMCC Using the Standard Interface" section .
To enable ISM to monitor status and performance statistics for the CMCCs it discovers, use the ISM Resource Management Setup panel (Figure 6-3). CMCC management is disabled by default in ISM setup when ISM is first initialized.
 |
Note You must have ISM enable authority to enable CMCC monitoring or to modify other ISM rules. |
To enable ISM to monitor CMCCs, complete the following steps:
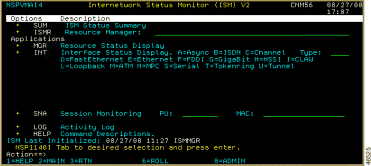
The ISM Administration menu panel (Figure 6-2) is displayed.

Step 2 Press Enter. The ISM Resource Management Setup—First Panel (Figure 6-3) is displayed.
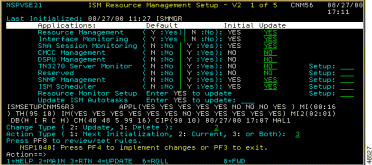
Step 3 In the CMCC Management option, type Y in the Update column. YES appears in the Update column beside the CMCC Management option.
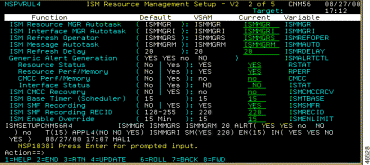
ISM uses the CPU Utilization and Free Memory thresholds that you enable on the ISM Resource Management Setup—Third Panel to determine the acceptable performance levels for discovered CMCCs on all routers. When these thresholds are exceeded, ISM issues a PERF alert if alert generation is enabled.
To enable CMCC alert generation for performance and memory thresholds and CMCC recovery, complete the following steps:
Step 2 In the CMCC Perf/Memory option, under Generic Alert Generation, type Yes.
Step 3 In the ISM CMCC Recovery option, type Yes.
To enable default CMCC monitoring thresholds for all routers, complete the following steps:
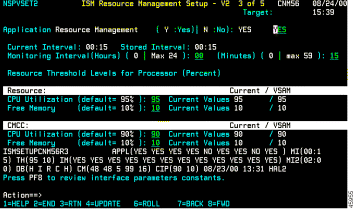
Step 2 To specify the maximum allowable CPU utilization percentage, type a value in the CPU Utilization option.
ISM issues a PERF alert for the CMCC when the CPU utilization exceeds the specified percentage.
ISM issues a generic alert in NetView's NPDA hardware monitor application if the CMCC Perf/Memory alert option on the ISM Management Rules Setup panel is enabled.
Step 3 To specify the minimum allowable percentage of free memory, type a value in the Free Memory option.
ISM issues a PERF alert for the CMCC when the free memory percentage is below the specified percentage.
ISM issues a generic alert in NetView's NPDA hardware monitor application if the CMCC Perf/Memory alert option on the ISM Management Rules Setup panel is enabled.
To enable channel interface monitoring, complete the following steps:

Step 2 In the Channel option, type Y.
If you have not initialized ISM for the first time and want to change the CMCC history database ID, or if you want to change the number of records in the database for new resources, complete the following steps:
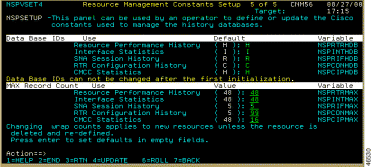
The default record counts allow for approximately 24 hours before the database record will wrap for a resource.
Step 2 When you have completed specifying the options, press PF4 (UPDATE).
To access the Cisco Mainframe Channel Connections panel, complete the following steps:
The Cisco Mainframe Channel Connections panel (Figure 6-9) is displayed.
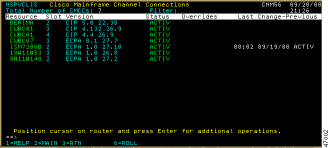
The Cisco Mainframe Channel Connections panel displays the following fields:
Field
| Description
|
| |
| |
| |
| |
| |
| |
| |
Step 2 Position the cursor on the router whose CMCC details you want to display and press Enter. The CMCC Detail Display panel (Figure 6-10) is displayed.
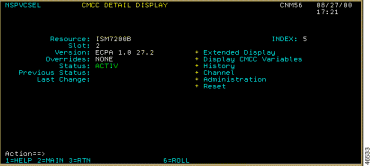
The CMCC Detail Display panel displays the following fields:
Field
| Description
|
| |
| |
| |
| |
| |
| |
| |
| |
| |
| |
| |
| |
| |
| |
| |
Step 3 Position the cursor on the Extended Display row and press Enter. The CMCC Extended Display panel (Figure 6-11) is displayed.
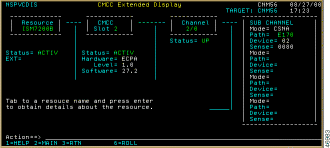
The CMCC Extended Display panel displays the following fields:
Field
| Description
|
| |
| |
| |
| |
| |
| |
| |
| |
| |
| |
| |
| |
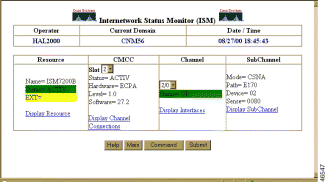
Step 4 (Optional) To access additional information about the Resource, Slot, Channel, or Subchannel, position the cursor in the box of the router that you want to view and press Enter. The corresponding ISM panel is displayed.
For example, if you press Enter while the cursor is in the Channel 2/0 box, the Interfaces Type panel (Figure 6-12) for channels is displayed.
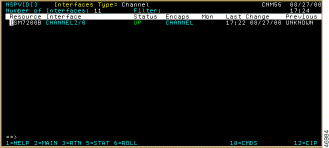
The Interfaces Type panel for channels displays the following fields:
Field
| Description
|
| |
| |
| |
| |
| |
| |
| |
| |
| |
| |
Step 5 (Optional) To view additional information about a router, select its name and press Enter.
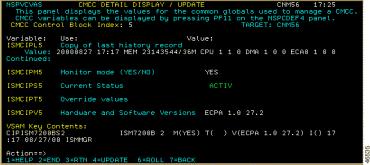
ISM uses internal management variables to perform CMCC management on a CMCC. You can view these internal variables, using the information to troubleshoot ISM problems.
To view CMCC management variables, on the CMCC Detail Display panel (Figure 6-10), position the cursor on Display CMCC Variables and press Enter. Two CMCC Control Block Variables panels (Figure 6-13 and Figure 6-14) are displayed.

To view the history of a CMCC, on the CMCC Detail Display panel (Figure 6-10), position the cursor on the History line and press Enter. The CMCC History panels (Figure 6-15 and Figure 6-16) are displayed.
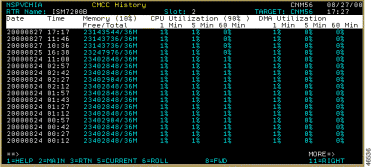

The CMCC History panels display the following fields:
Field
| Description
|
| |
| |
| |
| |
| |
| |
| |
| |
| |
| |
| |
| |
| |
| |
| |
| |
| |
| |
You can use the above information to troubleshoot ISM problems.
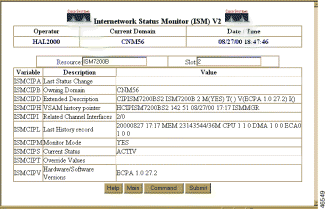
Press PF5 to display information about the controller card in the router. Figure 6-17 shows sample output for an SNMP-connected router.
If a history record contains an item that has exceeded a threshold, the record is highlighted in yellow and offset by one column.
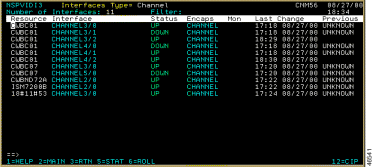
To view the channels that are on a specific router, position the cursor on the Channel option and press Enter. The channels that are known are displayed. Figure 6-18 shows sample output for router CWBCO1, a router with multiple CMCCs.

The Administration option appears on the CMCC Detail Display panel (Figure 6-10) if the operator is authorized to make changes. Position the cursor on the Administration option and press Enter. The ISM CMCC Administration panel (Figure 6-19) is displayed.
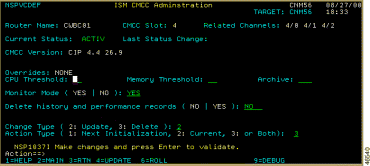
To override the established global thresholds for a particular router's CMCCs, specify individual thresholds on a per-router basis using the ISM CMCC Administration panel. To enable or disable CMCC monitoring and data archiving for a specific router, complete the following steps:
The notation C= with the specified percentage is displayed in the Overrides field. ISM will issue a PERF alert for the CMCCs on the selected router when the CPU utilization exceeds the specified percentage.
Step 2 To specify the minimum allowable percentage of free memory for the CMCCs on the selected router, enter a value (1% to 99%) in the Memory Threshold option.
The notation M= with the percentage that you specified is displayed in the Overrides field. ISM will issue a PERF alert for the CMCCs on the selected router when the free memory percentage is below the specified percentage.
Step 3 To enable or disable archiving of CMCC data, enter Yes or No in the Archive option.
Step 4 To enable or disable CMCC monitoring for the selected router, enter Yes or No in the Monitor Mode option.
Step 5 To remove history and performance records from the VSAM database for a specific router, enter Yes in the Delete history and performance records field.
Step 6 Press PF4 to save your changes.
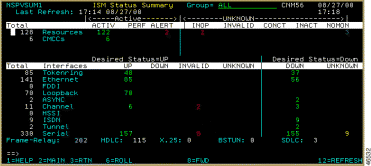
After you have enabled CMCC management for the routers, you can use one of the following procedures to monitor the status for discovered CMCCs on all routers:
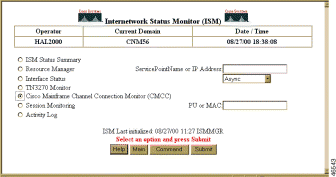
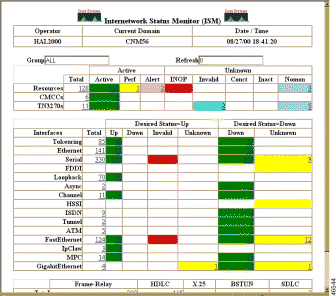
There are several ways to monitor the status of channel interfaces for routers. You can monitor the channel interface status either for all routers from the ISM main menu panel using the INT option (for a specific type of interface), or summarized with all other resources (for all interface types) from the ISM Status Summary panel. You can also monitor channels for a specific router by listing the CMCCs, selecting a router, and displaying that router's channel interfaces.
To monitor channel interfaces, on the ISM main menu (Figure 6-1), position the cursor on the Type field on the INT line, enter C, and press Enter. The Interfaces Type panel for channels (Figure 6-20) is displayed for all resources.
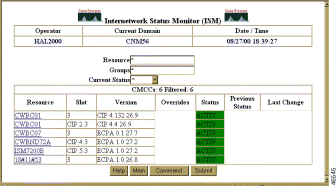
To display CMCC status for a specific router, tab to the resource and press PF12. The Cisco Mainframe Channel Connections panel (Figure 6-9) is displayed.
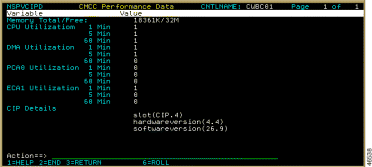
The CMCC hardware and software versions are displayed on several ISM panels:
The first dotted-decimal number is the hardware version, and the second-dotted decimal number is the software version. In the following example, 4.3 is the hardware version and 22.19 is the software version:
CIP 4.3 22.19
While there are many ways to access ISM's Router Command Interface, some ISM applications provide direct access to the command interface, and list the commands specific to the router currently being managed. When you use the CMCC Management application panels in ISM, you can access panels that provide router commands specific to managing CMCCs.
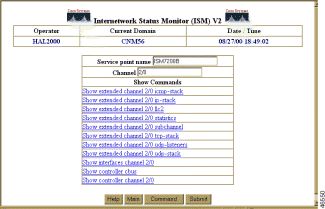
If a router supports the RUNCMD, you can use the CMCC and Channel Show Commands panel to run router show commands. To do so, complete the following steps:
Step 2 Position the cursor on Show Commands and press Enter. The CMCC and Channel Show Commands panel (Figure 6-21) is displayed, including the router control name and channel.
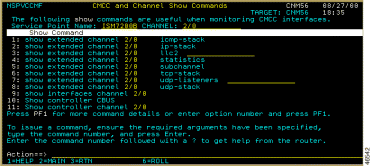
Step 3 To run a command, type the number that corresponds to the show command that you want to execute at the ISM command prompt, and press Enter.
To get command help from the router, type the number that corresponds to the show command followed by a ?, and press Enter.
You can access the Cisco Mainframe Channel Connections page from the ISM main menu or the ISM Status Summary page. To access the Cisco Mainframe Channel Connections page, complete the following steps:
Or, from the ISM Status Summary page (Figure 6-23), select Total CMCC.
The Cisco Mainframe Channel Connections page (Figure 6-24) is displayed.
The Cisco Mainframe Channel Connections page displays the following fields:
Field
| Description
|
| |
| |
| |
| |
| |
| |
| |
Step 2 Click on the router you want to display. The CMCC Status with Options page (Figure 6-25) is displayed.

The CMCC Status with Options page displays the following fields:
Field
| Description
|
| |
| |
| |
| |
| |
| |
| |
| |
| |
| |
| |
| |
| |
Step 3 Click on Extended Display to display the CMCC Extended Display page (Figure 6-26).
The CMCC Extended Display page displays the following fields:
Field
| Description
|
| |
| |
| |
| |
| |
| |
| |
| |
| |
| |
| |
| |
| |
Step 4 (Optional) To access additional information about the Resource, Slot, Channel, or Subchannel, click on the component to be viewed. The corresponding ISM page is displayed.
For example, if you click on Display Interfaces, the Interfaces Type=Channel page (Figure 6-27) is displayed.

The Interfaces Type=Channel page displays the following fields:
Field
| Description
|
| |
| |
| |
| |
| |
| |
| |
| |
| |
| |
| |
| |
| |
Step 5 To view additional information from the CMCC Extended Display page (Figure 6-26), perform one of the following steps:
ISM uses internal management variables to perform CMCC management on a CMCC. You can view these internal variables, using the information to troubleshoot ISM problems.
To view CMCC management variables, on the CMCC Status with Options (Figure 6-25) page, click on Display CMCC Variables to display the CMCC Variables page (Figure 6-28).
For a detailed description of the fields on this page, see the online help.
If a router supports the RUNCMD, you can issue router show commands when monitoring CMCC interfaces. To do so, complete the following steps:
Step 2 To run a command, click on the command.
|
Note To get command help from the router, click on the command and insert ? between the channel numbers (2/0) and the last operand. |
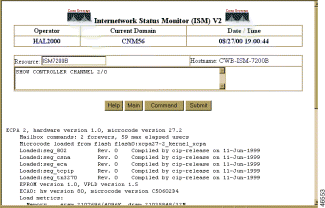
Figure 6-30 shows sample output for the show controller channel command:
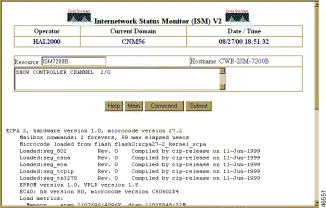
The show controller channel command displays all information about the CBUS controller card or controller channel on a Cisco router. This command lists the card's capabilities and reports any controller-related failures.
You can view the internal variables used by ISM to perform CMCC management on the CMCC shown in the CMCC Status with Options. This information is useful if you must troubleshoot an ISM operational problem.
To view CMCC management variables from the CMCC Status with Options page (Figure 6-25), click on History. The CMCC History page (Figure 6-31) is displayed.
The CMCC History page displays the following fields:
Field
| Description
|
| |
| |
| |
| |
| |
| |
| |
| |
| |
| |
| |
| |
| |
| |
| |
| |
| |
| |
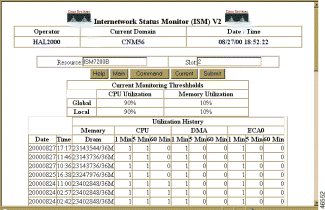
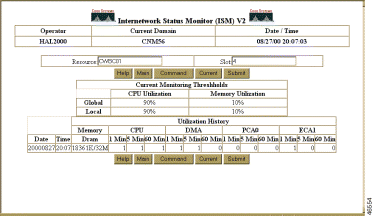
Click on Current to display information about the controller card in the router. Figure 6-32 shows sample output.
If the router is an SNMP-connected device, the data is collected using SNMP, as shown in Figure 6-33.
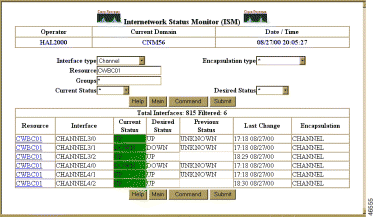
To view the router channels from the CMCC Status with Options page (Figure 6-25), select Channel. Figure 6-34 shows sample output for router CWB01, a router with multiple CMCCs.
After you have enabled CMCC management for the routers, you can use one of the following procedures to monitor the status for discovered CMCCs on all routers:

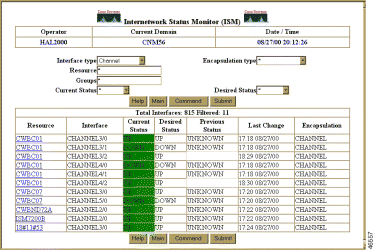
To monitor the channel interface status for all routers from the ISM main menu (Figure 6-22), select Interface Status, select a Channel from the drop-down list box, and click Submit. A list of all the channels is displayed, as shown in Figure 6-36.
![]()
![]()
![]()
![]()
![]()
![]()
![]()
![]()
Posted: Sat Oct 7 16:31:28 PDT 2000
Copyright 1989-2000©Cisco Systems Inc.