|
|

This chapter provides a detailed explanation of each window and dialog box in Cisco Hub/Ring Manager, and contains the following sections:
Dialog boxes and windows are organized alphabetically in each section.
The following tables provide a quick reference to commands. Use these tables to locate the command or function you want to perform; then refer to the corresponding section for information.
Use Table 3-1 to locate setup and configuration operations in this chapter.
| Operation | Description | Refer to Section |
|---|---|---|
| Hub/Ring Manager Application Setup | Changes parameters that control LAN polling mechanisms for Cisco Hub/Ring Manager stations. | Cisco Hub/Ring Manager Application Setup |
| Hub Manager | Sets polling parameters that control the Hub Manager application. | Hub Manager Parameters |
| Ring Manager | Sets polling parameters that control the Ring Manager application. | Ring Manager Parameters |
| Trap Manager | Adjusts parameters of the SNMP trapping mechanism and specifies the directory to store trap configuration files. | Trap Manager Parameters |
Use Table 3-2 to locate sections of this chapter that provide information on hub management operations.
| Operation | Description | Refer to Section |
|---|---|---|
| Hub Configuration | Displays the jumper settings and hardware and software revisions of the modules in a hub. | Hub Configuration |
| Summary File | Saves the Hub Configuration for all hubs in the map. | File |
| Attachment | Displays the logical attachment of devices to hub symbols. | Attaching Devices to the Router/Hub |
| Control Panel | Performs functions such as disconnect, reconnect, isolate, rejoin, reset, and Ethernet statistics. | Control Panel |
| Describe | Sets IP address, entities, and interfaces for a hub symbol. | Describe |
| Disable Polling | Disables the Hub Manager polling of all hubs. | Selective Application Polling |
| Enable Polling | Enables the Hub Manager polling of all hubs. | Selective Application Polling |
| Hub Manager Setup | Sets polling parameters for the Hub Manager application. | Cisco Hub/Ring Manager Application Setup |
| Identify | Identifies a selected symbol. | Identify Node |
Use Table 3-3 to locate sections of this chapter that provide information on ring management operations.
| Operation | Description | Refer to Section |
|---|---|---|
| All Rings | Displays the status of all rings detected in the map. | All Rings |
| Check (MAC-to-Port Mapping) | Displays the Check MAC-to-Port Mapping dialog box that verifies the consistency of a device's description. | MAC-to-Port Mapping |
| Customization | Enables and disables the autoremoval feature. | Ring Manager Customization |
| Disable Polling | Disables Ring Manager's polling of all hubs in the map. | Selective Application Polling |
| Enable Polling | Enables Ring Manager's polling of all hubs in the map. | Selective Application Polling |
| Event Filter | Filters the ring events displayed. | Event Filter |
| Identify | Identifies a selected MAC address. | Identify Node |
| Advanced Identify Node (Token Ring) | Displays error counters for Token Ring nodes. | Identify Node |
| Name | Assigns a device name to a MAC port address. | Name Settings |
| Ring Configuration | Displays all devices on a specified ring. | Ring Configuration |
| Ring Events | Displays ring events in real time. | Ring Events |
| Ring Manager Setup | Sets polling parameters for the Ring Manager application. | Cisco Hub/Ring Manager Application Setup |
| Ring Monitor | Displays ring information such as its status, Active Monitor, last beaconing, and error counters. | Ring Monitor |
| Ring Security | Locks the ring configuration and provides a list of prohibited devices. | Ring Security |
Use Table 3-4 to locate sections of this chapter that provide information on Ethernet management operations.
| Operation | Description | Refer to Section |
|---|---|---|
| Ethernet Statistics | Displays real-time, port-level statistical information. | Ethernet Management Operations |
| Ethernet Manager | Sets Ethernet statistics collection and file management parameters. | Ethernet Manager Parameters |
| Advanced Identify Node (Ethernet) | Displays partition information for Ethernet nodes. | Identify Node |
Use Table 3-5 to locate the sections of this chapter that provide information on various other operations.
| Operation | Description | Refer to Section |
|---|---|---|
| cmosip | Sets MIB variables in the SNMP agent for the control of IP parameters. | Using SNMP Manager |
| Manage/Unmanage | Allows you to enable and disable the polling of specified hubs. | Hub/Ring Object Manager |
This section describes setup and configuration operations, including modifying LAN polling mechanisms and timeouts for the network management PC, and enabling or disabling the polling of specified hubs or all hubs within a submap.
Use the Cisco Hub/Ring Manager Application Setup dialog box to change parameters that control LAN polling mechanisms and timeouts for Cisco Hub/Ring Manager applications on the network management PC. You can change these parameters according to the network load and the number of hubs being managed. Local time settings affect hubs designated as local in the Describe dialog box. Remote time settings affect hubs designated as remote in the Describe dialog box. Communications are usually more frequent with local hubs and less frequent with remote hubs in order to prevent network overload and reduce the cost of transmission.
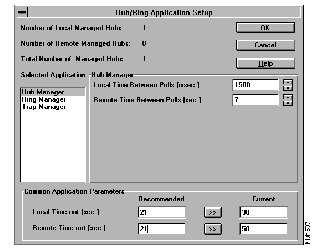
To configure Cisco Hub/Ring Manager parameters, from the Options menu select the Hub/Ring Application Setup command. The Hub/Ring Application Setup dialog box appears. (See Figure 3-1.) The fields of the Hub/Ring Application Setup dialog box are described in Table 3-6. Hubs are designated local or remote in the Location dialog box, which is reached from the Location command button in the Describe dialog box.
| Field | Description |
|---|---|
| Number of Local Managed Hubs | Displays the current number of hubs in the map that are designated as local (set in the Describe dialog box) and designated as managed (set in the Hub/Ring Object Manager dialog box). |
| Number of Remote Managed Hubs | Displays the current number of hubs in the map that are designated as remote (set in the Describe dialog box) and designated as managed (set in the Hub/Ring Object Manager dialog box). |
| Total Number of Managed Hubs | Displays the current number of hubs in the map that are designated as managed. This value is the sum of the number of local managed hubs and the number of remote managed hubs. |
| Selected Application | Allows you to select an application. Settings for the application appear in the fields on the right. |
| Common Application Parameters | Lists parameters that apply to all three Cisco Hub/Ring Manager polling applications. |
| Local Time-out | Shows the time (in seconds) that the management station waits for a hub response message through the LAN interface. When the timeout is exceeded and a response message has not arrived from the hub, the management station either tries to resend the message or records a LAN communication error. The value should be increased in a loaded LAN.1 |
| Remote Time-out | Shows the time (in seconds) that the management station waits for a hub response message through the LAN interface. When the time-out is exceeded, and a response message has not arrived from the hub, the management station either tries to resend the message or records a LAN communication error. The number should be increased in a remote network.2 |
| Recommended | Displays the recommended hub-response timeout setting. Click the arrow to copy this value into the Current field. This value cannot be edited. |
| Current | Displays the current hub-response timeout setting. Click the arrow to copy the Recommended value into this field. |
When you select Hub Manager from the Selected Application list box, the corresponding settings appear in the fields to the right, as shown in Figure 3-1 and listed in Table 3-7.
| Field | Description |
|---|---|
| Local Time Between Polls | Displays the time (in ms) between two consecutive Hub/Ring Manager pollings in the LAN. This value should reflect the number of hubs in the network. The default value is 3000. The recommended values are:
The local polling time should be significantly more frequent than the remote polling time.1 |
| Remote Time Between Polls | Displays the time (in seconds) between two consecutive Hub/Ring Manager pollings in the LAN. The default value is 7 seconds.1 |
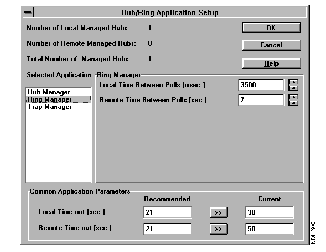
When you select Ring Manager from the Selected Application list box, the fields shown in Figure 3-2 and listed in Table 3-8 appear.
| Field | Description |
|---|---|
| Local Time Between Polls | Indicates the time (in ms) between two consecutive Ring Manager pollings in the LAN. This value should reflect the number of rings in the network. The default value is 3500. The recommended values are:
The default value is 3500 ms.1 |
| Remote Time Between Polls | Indicates the time (in seconds) between two consecutive Ring Manager pollings of remotely managed hubs in the LAN. The default value is 7 seconds.1 |
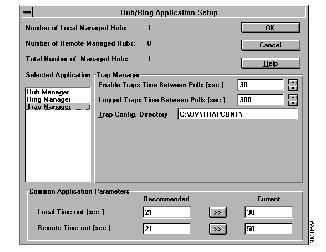
When you select Trap Manager from the Selected Application list box, the corresponding settings appear in the fields to the right, as shown in Figure 3-3 and listed in Table 3-9.
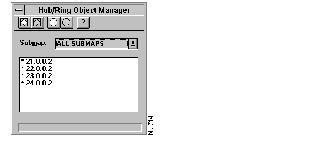
From the Hub/Ring Object Manager dialog box, you can perform selective management of specified hubs or all hubs in a submap.
To open the Hub/Ring Object Manager dialog box, from the Options menu select Hub/Ring Object Manager. The dialog box appears, as shown in Figure 3-4.
Submap objects and hub objects that are unmanaged remain unmanaged, even in subsequent Hub/Ring Manager sessions, until they are set to managed.
If a submap is unmanaged, the polling of all applications to all hubs in that submap is disabled. The managed or unmanaged status is not propagated to other submaps in the hierarchy. If you unmanage all hubs in a submap, they are no longer managed; however, all submaps within the submap remain managed.
You can also perform selective management functions in the following way:
Step 1 From your HP OpenView network map, select a submap object, hub, or ring object, then click the right mouse button to display its popup menu.
Step 2 From a submap object, select either Manage Submap or Unmanage Submap.
Step 3 From a hub or ring object, select either Manage Object or Unmanage Object.
Table 3-10 describes the fields in the Hub/Ring Object Manager dialog box.
You can choose which Hub/Ring Manager applications are active--that is, which applications should poll selected hubs in the map. In the Control menu, applications that are active have a checkmark next to their names. Each Hub/Ring Manager session starts with all Hub/Ring Manager applications active.
To deactivate an application, perform the following steps:
Step 1 From the Control menu, select the application that you want to disable--Ring Manager, Hub/Ring Trap Manager, or Hub Manager.
Ethernet Manager does not appear in this list, because it polls only when the Ethernet Statistics window is open.
Step 2 From the submenu, select Disable Polling.
The checkmark moves from Enable Polling to Disable Polling to indicate that the application is deactivated. To reenable the application, follow the same procedure and select Enable Polling.
This section describes management operations that apply to both Ethernet and Token Ring hubs.
Use the Asset Management command in the Control menu to view broad configuration information on your router/hub. Asset Management consists of two subcommands: Hub Configuration and Summary File.
Use the Hub Configuration command to view a list of hardware and software revisions and the state of all jumpers and DIP switches for each module installed in a selected hub.
To use the Hub Configuration command, perform the following steps:
Step 1 Select a hub object in your network map.
Step 2 From the Control menu, select Asset Management.
Step 3 Select Hub Configuration.
The Hub Configuration window appears.
The items shown in this window depend on the type of hub that is selected and the modules installed in it.
Step 4 To view the jumper and switch settings for a module, click on the box that indicates the slot in which the module is installed. The window expands to show relevant jumper and user settings for all Token Ring or Ethernet modules installed in the hub, as shown in Figure 3-5.
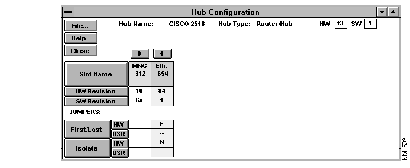
A dash (--) indicates that this setting is not available or is irrelevant. An empty jumper setting in the USR box indicates that the user has not overridden the hardware setting.
Table 3-11 describes the fields, command buttons, and other parameters of the Hub Configuration window.
The File... command opens the Save As dialog box, allowing you to save configuration information for all hubs in the map to a file.
The Attachment command under the HP OpenView Control menu displays the Hub Attachment dialog box. Use the Hub Attachment dialog box to associate mapped devices with router/hub ports or to associate the router component with the hub component.
Attachment establishes a graphical connection between LAN nodes and hub ports, and adds a corresponding entry to the HP OpenView database. It enables you to document your network topology by matching devices with hub ports. For example, when you click on a hub port in the Control Panel and select Identify from the popup menu, you see the IP address, MAC address, and map icon name of the attached device.
Attachment also aids in automatic configuration. If you attach the router portion of the router/hub, the Perform command button
in the Check MAC-to-Port Mapping dialog box automatically scans the database for devices attached to hub ports.
Attachment does not change the physical connections between nodes and ports. You can change physical connections only by plugging in and unplugging cables. Attachment also does not enable or disable nodes on the hub; to do that, use the Reconnect and Disconnect commands in the popup menu on the Control Panel.
To open the Hub Attachment dialog box, do one of the following:
The Hub Attachment dialog box appears, as shown in Figure 3-6. Table 3-12 describes the Hub Attachment dialog box fields and command buttons.
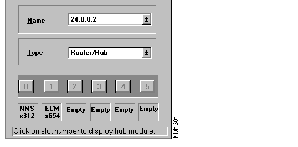
| Field or Command Button | Meaning |
|---|---|
| Name | Name of the object selected in the map. |
| Type | Type of map object, such as PC or router/hub. |
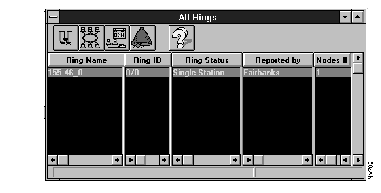
| Slot number | Click on a slot number to display the module installed in that slot. The NMS and hub modules are opened by default, as shown in Figure 3-7. You can move a module display by dragging on its name. |
| Attach (plus sign) | Attaches the selected items. |
| Detach (minus sign) | Detaches the selected items. |
| Deselect All (X icon) | Deselects all ports. |
| Identify (eyeglasses icon) | Opens the Identify Node dialog box. See the "Identify Node" section. |
| Open (opening folder icon) | Opens a new Hub Attachment dialog box for another object without closing the one that is open. |
The NMS module in slot 0 and the Ethernet or Token Ring module in slot 1 are displayed automatically, as shown in Figure 3-7 for an Ethernet module.

|  |
Slots with gray numbers cannot be opened and indicate one of the following:
If all module numbers are gray, there may be no communication with the hub.
Ports that are not attached have a black symbol consisting of two triangles pointing away from each other. Ports that are attached have a blue symbol consisting of two triangles pointing toward each other. To select a port for attachment, click on the port. The port's symbol changes to green. To deselect the port, click on it again, or click on the Deselect All icon in the Hub Attachment dialog box.
The Hub Attachment dialog box and the module displays associated with it are coded with matching colors, so that you can identify the modules belonging to each hub. These colors do not reflect the status of the port, slot, or hub.
To attach a router/hub port to a PC, perform the following steps:
Step 1 Select the router/hub in the network map and open its Hub Attachment dialog box.
Step 2 Click on the slot to display the module.
Step 3 Click on the port. The port's color changes to green.
Step 4 Select the PC object by clicking on it in the map. If necessary, you can drag the Hub Attachment dialog box and the module displays by their names to uncover the PC object.
Another way to select the PC object is to click on the Open button (opening folder icon) in the router/hub Hub Attachment dialog box. If a device is selected in the map, the Device Attachment dialog box for that device appears. If no device is selected, an Open dialog box appears. Select the device name or type from the lists in this dialog box and click OK. The Device Attachment dialog box appears.
Select the PC from the list in the Device Attachment dialog box, then click on the triangle symbol. The symbol changes to green.
Step 5 Click on the Attach icon in the Hub Attachment dialog box. The port symbol changes to blue.
Step 6 From the Control menu, select Sync. Attachment.
The PC icon on the map now changes color to indicate its status; this change can take up to several minutes, depending on your polling settings. The color coding is shown in Table 3-13.
If you attach a device to an occupied port, the device that was previously attached is detached automatically.
For proper operation of Cisco Hub/Ring Manager, the router component of the router/hub must be both physically connected and logically attached to a LAN segment.
In Token Ring environments, the TR port on the router component must be connected to port 1 on the Token Ring (LBM) module (or to port 2 if port 1 is set to EXT mode on a Cisco 2517). The Cisco Hub/Ring Manager package provides a cable for this purpose.
In Ethernet environments, the ETH port on the router component can be connected to any port on the Ethernet (ECM) module. It is usually connected to the nearest port.
Since the router component does not appear in the Hub Attachment dialog box, its TR or ETH port is represented as an ADJ LAN port on the network management processor system (NMS) module in slot 0.
To make this attachment, perform the following steps:
Step 1 Select the router/hub object in the network map and open its Hub Attachment dialog box.
Step 2 Click on slot 0 to display the NMS module.
Step 3 Click on the ADJ LAN port. The port's color changes to green.
Step 4 Click on the slot that holds the hub module.
Step 5 Click on the hub port to which the router component is connected. The port's color changes to green.
Step 6 Click on the Attach icon. Both port symbols change to blue.
After you have completed attaching devices, open the Control menu and select Sync. Attachment. The icon on the map for the attached device changes color to indicate its status. This change may take up to several minutes, depending on your polling settings.
To detach an object, follow the procedure for attachment, select the items to be detached, and click on the Detach icon. All selected map objects and ports are detached simultaneously.
The color of objects in the network map indicates their status. Table 3-13 describes the meaning of these colors.
The Control Panel provides a graphical representation of the router/hub and its installed modules. The screen is continuously updated to reflect any changes to the port, LED, or module.
To open the Control Panel, perform the following steps:
Step 1 From your network map, select a router/hub.
Step 2 From the Control menu, select Hub Manager, then select Control Panel.
Alternatively, select the router/hub in the network map, click the right mouse button to display the popup menu, and select Control Panel.
Figure 3-8 shows an example of a router/hub Control Panel.

From the router/hub Control Panel, you can perform the following functions:
From the Control Panel, you can select an individual port or an entire module. You can also perform other functions by clicking the hot spots shown in dotted boxes. When you click a hot spot, a popup menu appears from which you can apply commands related to the selected item.
Table 3-14 describes Control Panel hot spots and the commands available.
| Hot Spot | Available Commands |
|---|---|
| Dotted box under RESET on MANAGEMENT 2312 module | Resets the network management module (not the hub). |
| Dotted box around Router | Resets the router. |
| Dotted box around TOKEN RING 242 (Cisco 2517) | |
|
Dotted box around ETHERNET 654 |
|
|
Dotted box around TOKEN RING x292 |
|
|
Dotted box around WRAP (Cisco 2519) |
|
|
Dotted box around a port number |
|
|
Dotted box around a port number on TOKEN RING 242 |
|
LEDs and module names are color-coded in the Control Panel, as shown in Table 3-15, Table 3-16, and Table 3-17. The Control Panel for NMS modules reflects the actual status of the LEDs. Before performing disconnect, reconnect, isolate, rejoin, unpartition, or reset actions, use the Control Panel displays to verify that you have active communications.
| LED | Color | Meaning |
|---|---|---|
| RX | Green | A port is receiving. |
| RX | White | None of the ports are receiving. |
| COL | Green | A port has detected a collision. |
| COL | White | No collisions have been detected. |
| ISO | Green | Jumper is set to isolate mode. |
| ISO | White | Jumper is set to normal mode. |
| Port LEDs | Red | Port is partitioned. |
| Port LEDs | Magenta | Port is disconnected by the user. |
| Port LEDs | Green | Port is inserted. |
| Port LEDs | White | Port is not inserted. |
| LED | Color | Meaning |
|---|---|---|
| EXT | Green | Jumper for extension port is set to extension mode. |
| EXT | White | Jumper for extension port is set to lobe mode. |
| 16M LED | Green | Jumper is set to 16 Mb/sec. |
| 16M LED | White | Jumper is set to 4 Mb/sec. |
| ISOL | Red | Module is isolated because a hardware error occurred. |
| ISOL | Green | Jumper is set to isolate mode or normal mode, but no ports are inserted. |
| ISOL | White | Jumper is set to normal mode and at least one port is inserted. |
| Port LEDs | Yellow | Error in ring speed has been detected. |
| Port LEDs | Magenta | Port is disconnected by the user. |
| Port LEDs | Green | Port is connected and active. |
| Port LEDs | White | Port is connected but inactive. |
| Color | Meaning |
|---|---|
| Black | Jumper is set to normal mode. |
| Red | Module is isolated because a hardware error occurred, or no stations are inserted. |
| Magenta | The module has been isolated by a user action. |
This section discusses Ring Manager commands, windows, and dialog boxes.
Use the All Rings window to obtain information about all rings in the network, including a ring's name, ID, status, and number of nodes. In addition, the status bar in the lower right corner displays the current date and time.
If the All Rings window is minimized, double-click on the icon to maximize it. If the window is closed, open it by performing the following steps:
Step 1 From the Control menu, select Ring Manager.
Step 2 Select All Rings.
The All Rings window appears, as shown in Figure 3-9.
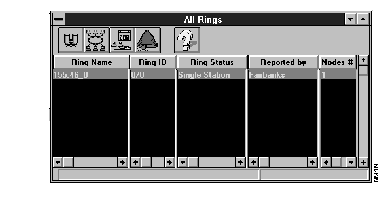
Table 3-18 explains the meaning of each color.
| Line Color | Status | Meaning |
|---|---|---|
| Green | Normal | The ring is operating normally. |
| Red | Beaconing | There is a serious problem on the ring, such as a failure in the cabling system, ring hubs, or circuitry of a node on the ring.
Localize the fault domain by checking the node address of the node that generated the beacon event and the nearest active upstream neighbor (NAUN). The fault lies in the cabling or ring hubs between these two nodes, or within one of the two nodes. Beaconing usually recovers after a fraction of a second. |
| Red | Excessive Errors | An isolated error has exceeded the second threshold. This indicates a problem on the ring that is seriously affecting its performance. |
| Yellow | Increasing Errors | An isolated error has exceeded the first threshold. This indicates a possible problem on the ring. |
| Cyan | Unknown | There is no communication with SNMP agents on the ring. |
| White | Unmanaged | All hubs monitoring this ring are unmanaged. |
Table 3-19 identifies and describes the fields and components of the All Rings window.
| Field or Component | Description |
|---|---|
| Ring Name | Displays the ring name that you assigned. The ring name is the text you entered in the Segment field of the Token Ring Interfaces dialog box reached from the Describe dialog box. If you leave the Segment field blank, Ring Manager uses the Token Ring interface address as the ring name, in the format subnet address_hex ring number (for example, 192.111.3_3F). |
| Ring ID | Shows the ring number in both hexadecimal and decimal format. |
| Ring Status | Indicates the overall ring status at a specified date and time. |
| Reported by | Indicates the hub or entity that supplied the status information. |
| Nodes # | Displays the number of nodes currently in the ring (Active Monitor + Standby Monitors). |
| Status Bar | Shows the current date and time in the lower right corner of the dialog box. |
| Ring Monitor (binoculars icon) | Opens the Ring Monitor window for the current ring. (See the "Ring Monitor" section.) |
| Ring Configuration (network icon) | Opens the Ring Configuration window for the current ring. (See the "Ring Configuration" section.) |
| Event Filter (joined stations) | Opens the Event Filter dialog box. (See the "Event Filter" section.) |
| Ring Events (bell icon) | Opens the Ring Events window for the current ring. (See the "Ring Events" section.) |
In some cases you may need to verify that information such as a device's name, MAC address, and location in the hub are consistent. You can view these values in the Check MAC-to-Port Mapping dialog box. You can also use the Check MAC-to-Port Mapping dialog box to correct inconsistencies, such as when the address of a device that was entered in the Describe dialog box does not match the address of the same device as determined by Ring Manager.
Ring Manager's ability to display information in the Check MAC-to-Port Mapping dialog box can be limited or unsuccessful, depending on the hub's configuration. You can display MAC-to-port mapping information only on rings where none of the active ports are set to extension mode.
To open the Check MAC-to-Port Mapping dialog box, shown in Figure 3-10, do one of the following:
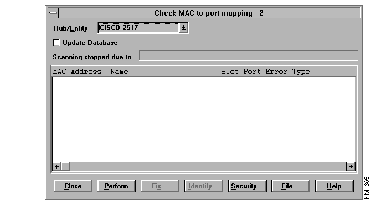
When you first view the Check MAC-to-Port Mapping dialog box, the list of mappings is empty. To display MAC-to-port mapping information, click Perform. If any inconsistencies appear, such as address information in the Describe dialog box not matching what Ring Manager found, a message reports the problem.
To update the database, click the Update Database checkbox, then click Perform. Whenever you update the database, select the Sync. Attachment command from the Control menu to update the Cisco Hub/Ring Manager database with information from the HP OpenView database.
Table 3-20 describes the fields and command buttons in the Check MAC-to-Port Mapping dialog box.
| Field or Command Button | Description |
|---|---|
| Hub/Entity | Click on the arrow to choose the device to be checked. |
| Update Database | When checked, updates the database with information retrieved by the Perform action. |
| Scanning stopped due to | Explains why the scanning action was terminated. |
| MAC Address | Displays the MAC address of a device as determined by the Check MAC-to-Port Mapping dialog box. |
| Name | Displays the device name associated with the specified MAC address. |
| Slot | Identifies the slot occupied by the inserted device. |
| Port | Identifies the port to which the device is attached. |
| Error Type | Specifies the type of error that was detected: objects do not match, ports and slots do not match, hubs do not match, or MAC addresses do not match. |
| Perform | Scans the database for MAC-to-port mapping information. |
| Fix | Corrects discrepancies or errors found by the scanning action. |
| Identify | Opens the Identify Node dialog box. (See the "Identify Node" section.) |
| Security... | Opens the Security dialog box. (See the "Ring Security" section.) |
| File... | Prints the contents of the dialog box to a file with the indicated name. |
From the Check MAC-to-Port Mapping dialog box, you can open the Mapping Inconsistency dialog box to correct any discrepancies, such as an addressing mismatch, by performing the following steps:
Step 1 Select the line you want to correct.
Step 2 Click Fix.
The Mapping Inconsistency dialog box appears, as shown in Figure 3-11.
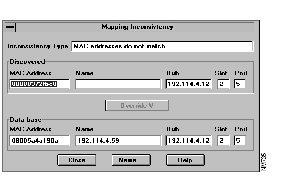
Table 3-21 describes the fields and command buttons in the Mapping Inconsistency dialog box.
| Field or Command Button | Description |
|---|---|
| Inconsistency Type | Specifies the type of inconsistency found for this device, as determined by the scanning action. |
| Discovered | Specifies the MAC address, name, hub, port, and slot found for this device, as determined by the scanning action. |
| Database | Specifies the MAC address, name, hub, port, and slot for this device, as recorded in the database. |
| Override | Replaces the device's information in the database with the details discovered by the scanning action. |
| Name | Opens the MAC Name Settings dialog box to correct any inconsistencies in the name given to the device. (See the "Name Settings" section.) |
At times you may want to automate certain Ring Manager functions. For example, you might want Ring Manager to automatically remove nodes if they attempt to enter a locked ring. The Customization dialog box allows you to set up this kind of automated action. The preferences that you set up apply to all Cisco router/hub SNMP agents that manage Token Ring ports in the network.
To display the Customization dialog box, perform the following steps:
Step 1 From the Control menu, select Ring Manager.
Step 2 Select Customization.
The Ring Manager Customization dialog box appears, as shown in Figure 3-12.
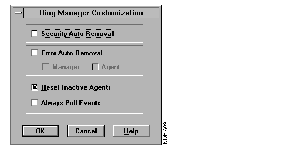
Table 3-22 describes the fields in the Ring Manager Customization dialog box.
Use the Event Filter dialog box to filter events that appear in the Ring Events window.
To open the Event Filter dialog box, perform the following steps:
Step 1 From the Control menu, select Ring Manager.
Step 2 Select Event Filter.
Another way to open the Event Filter dialog box is to perform the following steps:
Step 1 From the All Rings dialog box, select a ring.
Step 2 Click on the Event Filter icon.
The Event Filter dialog box is shown in Figure 3-13.
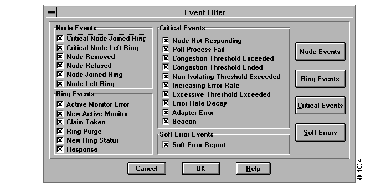
Events that are selected appear in the Ring Events window (the event log). By default, all events are selected. To select or deselect any event, click on the box next to the event. Events can be selected or deselected individually or by groups. To select or deselect an entire group, click on the appropriate group command button: Node Events, Ring Events, Critical Events, or Soft Error Events.
Use the Name Settings dialog box to assign a device name to a MAC address. The names listed in the dialog box are taken from the list of all devices in the current map. The MAC addresses listed are taken from the selected ring configuration.
Hubs and bridges are not listed. Use the Describe dialog box, rather than the Name Settings dialog box, to assign a MAC address to hubs and bridges. To open the Name Settings dialog box, perform the following steps:
Step 1 From the Control menu, select Ring Manager.
Step 2 From the Ring Manager menu, select the Ring Configuration command.
The Ring Configuration window appears.
Step 3 In the Ring Configuration window, select a device and click the Name command button (pages with writing).
The Name Settings dialog box appears, as shown in Figure 3-14.
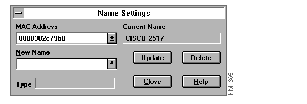
Table 3-23 describes the fields and command buttons in the Name Settings dialog box.
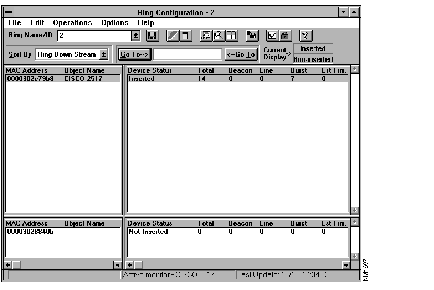
The Ring Configuration window lists devices configured on a specified ring, including their MAC address and status.
The list is divided into two sections. The upper section contains all active nodes on the selected ring. The lower section includes all devices that were previously active on the ring, but are not active at the time of the display.
To open the Ring Configuration window, perform the following steps:
Step 1 From the All Rings window, select a ring.
Step 2 Click on the Ring Configuration icon.
The Ring Configuration window appears, as shown in Figure 3-15.
You can also open the Ring Configuration window by doing one of the following:
Table 3-24 describes the commands in the Ring Configuration window menu bar. All commands except Field Display can also be performed by command buttons.
Table 3-25 describes the fields and command buttons in the Ring Configuration window.
| Menu | Command | Description |
|---|---|---|
| File | Export... | Saves the contents of the window to a file. |
| Edit | Non Inserted Devices | Deletes the selected node or all non-inserted nodes from the list of non-inserted devices. |
| Field Display... | Opens the Field Display dialog box to set the fields that are displayed in the windows on the right side of the Ring Configuration window. From the Field Display dialog box, you can open the Sequence dialog box to set the sequence of the displayed fields. | |
| Operations | Name... | Opens the Name Settings dialog box for the selected device. (See the "Name Settings" section.) |
| Identify... | Opens the Identify Node dialog box for the selected device. | |
| Monitor | Toggles between monitored and unmonitored status for the selected device. When a device is monitored, status changes are reported in the Ring Events window as Critical Node Joined (or Left) Ring. | |
| Options | Refresh | Updates the Ring Configuration window. |
| Check... | Opens the Check MAC-to-Port Mapping dialog box. (See the "MAC-to-Port Mapping" section.) | |
| Security... | Opens the Security dialog box. (See the "Ring Security" section.) |
| Field or Command Button | Description |
|---|---|
| Ring Name/ID | Identifies the ring whose configuration is displayed. Click the down arrow to display a list of available rings. If you entered a name for the ring in the Segment field of the Describe dialog box, a list of ring names appears. Otherwise, a list of ring interface addresses appears. |
Selects the order in which devices are sorted. | |
| Go To | Enter a full or partial name or MAC address in the text box. To locate a device whose name or address begins with the specified string, click the Go To button on the left; for a device whose name or address ends with the string, click the Go To button on the right. The search is not case-sensitive. |
| Inserted/Non-inserted | In the default display, the upper section of the window lists all active nodes inserted in the selected ring. The lower section lists devices that are non-inserted (previously active but not currently inserted). You can drag the separator bar to show only inserted devices or only non-inserted devices. The Inserted/Non-inserted area indicates whether inserted or non-inserted devices or both are shown. |
| MAC Address | Displays the MAC addresses of adapters inserted in the ring, accurate up to the time in the Last Update field. |
| Object Name | Displays the name of the specified device. |
Describes the state of each device in the ring, accurate up to the time in the Last Update field:
| |
Lists the number of errors of each type that have been detected while the Ring Events window is open. To update the counters even when the Ring Events window is closed, enable Always Poll Events in the Customization dialog box. You can reset these counters either with the Reset command in the Ring Monitor window or by clicking Reset in the Advanced Identify dialog box. | |
| Status line | The status line at the bottom of the window identifies the active monitor and the time of the last update. |
| Export (diskette icon) | Saves the contents of the window to a file. |
| Delete (torn paper icon) | Deletes the selected non-inserted node from the list of non-inserted devices. |
| Delete All (trash can icon) | Deletes all non-inserted nodes from the list of non-inserted devices. |
| Identify (eyeglasses icon) | Opens the Identify Node dialog box for the selected device. (See the "Identify Node" section.) |
| Monitor/Do Not Monitor (magnifying glass icon) | Toggles between monitored and unmonitored status for the selected device. When a device is monitored, status changes are reported in the Ring Events window. |
| Name Settings (pages icon) | Opens the Name Settings dialog box for the selected device. (See the "Name Settings" section.) |
| Refresh (binoculars icon) | Updates the Ring Configuration window. |
| Check (checkmark icon) | Opens the Check MAC-to-Port Mapping dialog box. (See the "MAC-to-Port Mapping" section.) |
| Security (padlock icon) | Opens the Security dialog box. (See the "Ring Security" section.) |
The Ring Events window provides a view of all Token Ring events and MAC frames on the network in chronological order (except for events you have filtered with the Event Filter dialog box).
To open the Ring Events window, perform the following steps:
Step 1 From the Control menu, select Ring Manager.
Step 2 Select All Rings.
The All Rings window appears.
Step 3 From the All Rings window, select a ring and click on the Ring Events icon (the bell).
The Ring Events window appears, as shown in Figure 3-16.
Another way to open the Ring Events window is to click Events from the Ring Monitor window.
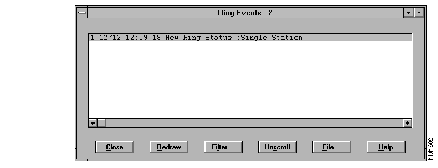
Events are displayed in real time, showing the event number, time of occurrence, event name, and MAC address and name of the device. The events are filtered according to your selection in the Event Filter dialog box.
Error counts in the Ring Configuration window are updated only while the Event window is active or when the Always Enable Polling feature is enabled in the Customize dialog box.
Table 3-26 describes the fields and command buttons in the Ring Events window.
| Field or Command Button | Description |
|---|---|
| Close | Closes the window. Error counts in the Ring Configuration window are not updated when this window is closed. |
| Redraw | Updates the Ring Events window after you change the event filters. |
| Filter... | Opens the Events Filter dialog box to filter the events. (See the "Event Filter" section.) Click Redraw to update the window with the new filters. |
| Scroll/Unscroll | Toggles between Scroll and Unscroll. Click Scroll to scroll through the events. The cursor automatically scrolls to the latest events as they are added to the window. Click Unscroll to disable scrolling and enable the screen to be updated with new events. The cursor remains on the selected event even when new events are added to the window. |
| File... | Copies the contents of the window to the selected file. The file remains open and logs ring events until the Ring Event window is closed. The size of the log file is set in the System Initialization file (OVWIN.INI) under Ring Manager and can be manually edited. The default is 60 KB. |
The Ring Monitor window provides information about the ring, including ring status, Active Monitor, number of nodes in the ring, last beaconing state, and error counts. Information displayed is accurate as of the time shown below the title bar.
To open the Ring Monitor window, perform the following steps:
Step 1 From the Control menu, select Ring Manager.
Step 2 Select Ring Monitor.
The Ring Monitor window appears, as shown in Figure 3-17.
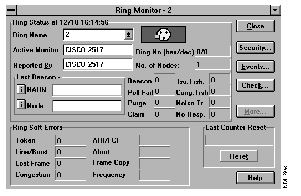
Table 3-27 describes the fields and command buttons of the Ring Monitor window.
| Field or Command Button | Description |
|---|---|
Displays the ring status at the specified date and time. Ring status is indicated by the color of the ring icon (colored face) as follows:
The face shown in the ring icon changes according to the ring color. | |
| Ring Name | Displays the name or ID of the ring. The ring name is set in the Describe dialog box for the ring or discovered by Ring Manager. If Ring Manager discovers a ring, it uses a combination of the subnet address and ring number as the ring name (for example, 192.114.4_3F). |
| Ring No. (hex/dec) | Displays the ring number, as discovered by Ring Manager, in hexadecimal and decimal format. |
| Active Monitor | Displays the MAC address or name of the Active Monitor at the specified time. |
| Reported By | Displays the name of the hub or entity that supplied the status information. |
| No. of Nodes | Displays the number of nodes on the ring (Standby Monitors plus Active Monitor) at the specified time. |
| Last Beacon | Displays the type of the last detected beacon and the nodes between which beaconing was located. Click on the i command button to identify the node. |
Displays the number of errors detected on this ring since the reporting agent was activated, and since the counters were last reset:
| |
| Opens the Security window for the specified ring. (See the "Ring Security" section.) | |
| Events... | Opens the Ring Events window for the current ring. (See the "Ring Events" section.) |
| Check... | Opens the Check MAC-to-Port Mapping window for the current ring. (See the "MAC-to-Port Mapping" section.) |
Opens the lower portion of the window (as shown in Figure 3-17) to display additional information on the number of soft errors detected on the ring since the reporting agent was activated. These errors are of the following types: For information about soft errors, see the "Overview" chapter. | |
| Last Counter Reset | Time at which error counters for the agent reporting on this ring were last reset. |
| Reset | Resets error counts for the agent reporting on the ring. Does not reset the counters in the reporting agent, only the counts kept by Ring Manager. These include global counters as well as error counters for each device (MAC address) on the ring. |
Use the security feature to lock the ring configuration according to the last Check operation or an import file with MAC-address-to-port mapping. The security function provides you with a list of all prohibited devices. Offenders remain on the list until you use the Permission dialog box to give them permission to enter the ring.
To open the Security dialog box displayed in Figure 3-18, do one of the following:
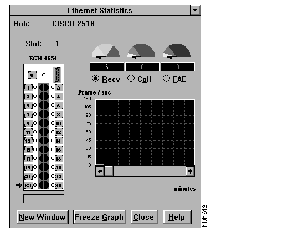
Table 3-28 describes the fields and command buttons in the Security dialog box.
| Field or Command Button | Description |
|---|---|
| Hub/Entity | Specifies a router/hub for security. The Violating Devices window displays the names of devices that can be configured for security. If you do not select a device, Hub/Ring Manager interprets the first device in the list as the specified violating device. Click the selection arrow to specify the router/hub to be configured for security. |
| Last Check | Displays the time you last checked MAC-address-to-port mapping. |
| Device | Click the selection arrow to specify the address of the connected device that you want to configure for security. To learn the address of the device, click on the i box to display the Identify Node window. (See the "Identify Node" section.) |
| Add | Adds the selected device to the list of untouchable devices. |
| Untouchable Devices | Lists devices that cannot be removed or not allowed. Error Auto Removal must be set to Manager in the Ring Manager Customization dialog box. The default is for all network management (NMS) modules to be listed as untouchable devices. |
| Delete | Removes an untouchable device from the list. |
| Lock by Physical Mapping | Locks the ring configuration according to the physical mapping information saved in the database during the last Check operation. |
| Lock by Import | Locks the ring configuration according to an import file. Only devices appearing in the import file are allowed to enter the ring. To load an import file, click Import (described later in this table). |
| Violating Devices | This section contains a list of all offending devices, including MAC address, name, and the slot, port, and hub through which they are connected. |
| File... | Saves the contents of the dialog box to a file. |
| Lock/Unlock | Toggles between Lock and Unlock. When Unlock is displayed, you are in lock mode, and users cannot change the MAC-to-port configuration. Click Unlock to change to unlocked mode.
When the Security Auto Removal feature is enabled in the Ring Manager Customization dialog box, a user who attempts to change a locked configuration is automatically removed from the ring. A list of removed users appears in the Security dialog box with violation status. When the Security Auto Removal feature is disabled, users violating the locked configuration are able to enter the ring, but are still listed as violators. When Lock is displayed, you are in unlocked mode, and users can change the ring configuration without restriction, including hub port and MAC address of their computing device. To lock the configuration, click Lock. |
| Check... | Opens the Check MAC-to-Port Mapping dialog box. See the "MAC-to-Port Mapping" section for more information. |
| Import... | Loads an import file. Click Import and enter the import file name. To have the ring configuration locked according to this file, check the Lock by Import box. The import process automatically adds new objects to the map. Attachment information (hub name, hub type, slot, and port) is updated and overrides the existing information. Any errors that occur during the import process are logged in the System Log file (OVWIN.LOG or OVI2.LOG). |
| Clear | Clears the MAC-to-port mapping database created by an import file. |
| Remove | Removes the selected device from the ring. The removal is valid until the device attempts to reinsert into the ring. |
| Allow/Do Not Allow | Toggles between Allow and Do Not Allow. When Do Not Allow is displayed, the selected device is allowed to enter the ring. Click Do Not Allow to prevent it from entering the ring. When a device is not allowed, a Remove command is sent each time it enters the ring. When Allow is displayed, the selected device is currently not allowed to enter the ring. Click on Allow to allow it to enter the ring. |
| Permit | Gives a device permission to enter the ring. When you select the device and click Permit, the Permission dialog box appears, as shown in Figure 3-19. After a device is permitted to enter the ring with this command, its status is updated in the Ring Configuration window. |
The Permit button both updates the locked ring configuration in order to allow a device to enter the ring, and performs the Allow operation on the device. The Permission dialog box is shown in Figure 3-19.
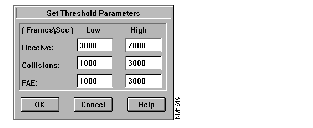
Table 3-29 describes the fields in the Permission dialog box.
Ethernet Manager provides a graphical display of network activity.
The Ethernet Statistics window displays real-time, port-level statistical information. To open this window, select the router/hub in the network map and open its Control panel, as explained earlier in the "Control Panel" section. Click on a port and select Eth Statistics from the popup menu.
The Ethernet Statistics window appears, as shown in Figure 3-20. Table 3-30 explains the displays and command buttons in this window.
Use Ethernet Manager to set parameters for the graphical displays of network activity shown in the Ethernet Statistics window.
Ethernet Manager provides three functions: Set Threshold Parameters, Set Statistics Graph Scale, and Ethernet Statistics File Management. To modify parameters for one of these functions, from the Control menu, select Ethernet Manager, then select the function. Each function has its own dialog box.
The Set Threshold Parameters dialog box, shown in Figure 3-21, defines alert thresholds at the network level for three types of events: receive events, collisions, and frequency alignment errors (FAE). You can set low and high thresholds in frames/sec. The fields in this dialog box are described in Table 3-31.

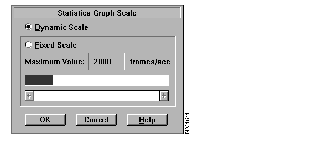
The Set Statistics Graph Scale dialog box, shown in Figure 3-22, sets the vertical scale for the Ethernet Statistics window in frames/sec. The option buttons in this dialog box are described in Table 3-32.
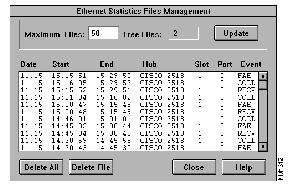
Graphical information displayed in the Ethernet Statistics window is saved in files for future retrieval. Three files are created, one for each event type, for each port for which a window is open. A file is full after the window has been running for approximately 10 to 15 minutes, and contains approximately 630 bytes of data. Statistical files are in binary format and can be retrieved by selecting a port and an event type in the Ethernet Statistics window, clicking the Freeze Graph command button, and scrolling through the display.
The Ethernet Statistics File Management dialog box, shown in Figure 3-23, is designed for advanced management of statistical files. You do not normally need to change any of the settings in this dialog box, which are described in Table 3-33. Ethernet Manager automatically manages the files and deletes the oldest ones as required.
 | Caution Do not use Windows or DOS to delete statistical files from the hard disk. Instead, use the Delete command in this dialog box. |

This section explains Describe operations.
Use the Describe command to view and modify configuration information about a node or device. For a hub symbol, you can view its name, notepad, physical location, LAN adapter address, network administrator telephone number, segment number, and TCP/IP address.
There are two types of Describe dialog boxes. The Describe dialog box described in this section applies to router/hub objects.
The Router/Hub Describe dialog box, shown in Figure 3-24, appears whenever you do one of the following:
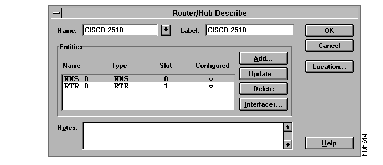
Table 3-34 describes the fields and command buttons in the Router/Hub Describe dialog box.
| Field or Command Button | Description |
|---|---|
| Name | Specifies the name of the hub for which the information is displayed. This name may contain up to 15 alphanumeric characters, including spaces, and is always displayed in uppercase. |
| Label | Specifies an abbreviated name of up to eight characters that is displayed on the submap, computer, or component symbol in your map. The label is automatically taken from the Name field; it cannot be edited and is always displayed in uppercase letters. |
| Entities | Lists the entities in the specified device. Double-clicking on a name opens its Interfaces dialog box. Entities are independent CPUs that contain SNMP agents to collect and relay information on the object. The entities listed are supported by the selected hub. The default is an NMS entity in slot zero (0). |
| Name | Lists the names of the entities for this object. The names are listed in the format type_number. Type refers to the type of device, such as NMS or RTR. Numbers are sequential, starting with zero. Names are assigned automatically and cannot be altered. The entity with number zero (for example, NMS_0) performs all hub management functions. |
Specifies the two types of entities:
| |
| Identifies the slot in the hub in which the entity is installed. Options are 0 and 1. Slot 0 is the lower slot andphysically contains the NMS module; this slot is assigned by default to the NMS entity. Slot 1 contains the Token Ring (LBM) or Ethernet (ECM) module; this slot is assigned by default to the RTR entity. | |
| Configured | Indicates whether the entity has been configured (triangle) or not configured (dash). This symbol changes only after you exit and reenter the Describe dialog box. |
| Notes | Allows you to enter text. For example, you might want to record line speed, room location, or when preventive maintenance was last performed. |
| Add... | Displays the Add New Entity dialog box, which allows you to add a new entity to the list of entities supported by the selected hub. |
| Update... | Modifies entity information for the specified device. In the Entities box, select an entity, then click Update to change its type or slot while retaining all other parameters. Click OK to confirm your changes and return to the Describe dialog box. |
| Delete | Deletes the selected entity from the list of entities supported. |
| Interfaces... | Displays the Interfaces dialog box. From the entities box, select an entity, then click Interfaces. The Router/Hub Interfaces dialog box appears, as shown in Figure 3-25 and described in Table 3-35. |
Displays a dialog box in which you can enter the object's building number, wiring closet, rack number, and remote or local location. This information is optional.
|
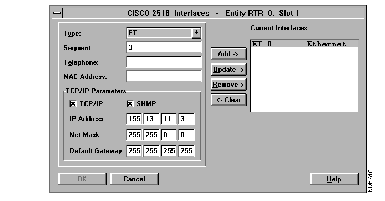
Table 3-35 describes the fields and command buttons in the Router/Hub Interfaces dialog box.
This section discusses other operations of Cisco Hub/Ring Manager for Windows.
HP OpenView for Windows provides a special dialog box, called SNMP Manager, that you can use to get and set MIB variables in the SNMP agent.
To open the HP OpenView SNMP Query dialog box, perform the following steps:
Step 1 From your network map, click on a router/hub object.
Step 2 From the Control menu, click SNMP Manager.
Step 4 From the Query list, select cmosip.ovq.
The cmosip.ovq file contains a query for an SNMP action. The HP OpenView SNMP Query dialog box appears with the relevant variables, as shown in Figure 3-26. After making any changes to the MIB variables, reset the agent through the control panel or the appropriate SNMP variable.
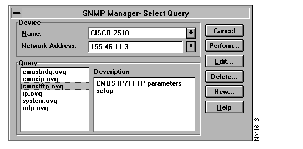
For more information on this dialog box, refer to the HP OpenView Windows User's Guide. For more information on these MIB variables, refer to the appendix "MIB Group and Trap Descriptions."
The Identify Node dialog box provides information on an occupied port of the router/hub. From the Identify Node dialog box, you can only view information; you cannot alter any of the text fields.
To open the Identify Node dialog box, perform the following steps:
Step 1 From your network map, select a router/hub.
Step 2 From the Control menu, select Control Panel. The graphical representation of the router/hub appears.
Another way to open the Control Panel is to click the right mouse button on the router/hub object and select Control Panel from the popup menu.
Step 3 Point to an occupied port (one showing a green light) on the router/hub, then click the left mouse button and select Identify.
The Identify Node dialog box appears, as shown in Figure 3-27.
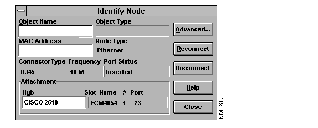
You can also open the Identify Node dialog box by performing one of the following operations:
Table 3-36 describes the fields and command buttons in the Identify Node dialog box.
The Advanced Identify Node dialog box is different for Ethernet and Token Ring. Figure 3-28 shows the Advanced Identify Node (Ethernet) dialog box.
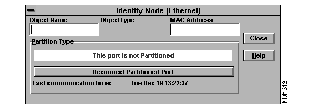
Table 3-37 describes the fields and command buttons in the Advanced Identify Node (Ethernet) dialog box.
Figure 3-29 shows the Advanced Identify Node (Token Ring) dialog box.
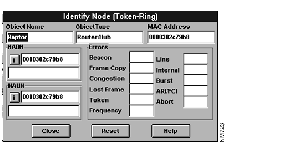
Table 3-38 describes the fields in the Advanced Identify Node (Token Ring) dialog box.
|
|