Table Of Contents
Managing Probes
Viewing Probes
Adding Probes
Editing Probes
Viewing HTTP Probes
General Tab
Expected Status Tab
Header Details Tab
Adding HTTP Probes
Editing HTTP Probes
Viewing FTP Probes
General Tab
Expected Status Tab
Adding FTP Probes
Editing FTP Probes
Viewing SMTP Probes
General Tab
Expected Status Tab
Adding SMTP Probes
Editing SMTP Probes
Viewing TELNET Probes
General Tab
Expected Status Tab
Adding TELNET Probes
Editing TELNET Probes
Viewing TCP Probes
Adding TCP Probes
Editing TCP Probes
Viewing UDP Probes
Adding UDP Probes
Editing UDP Probes
Viewing ICMP Probes
Adding ICMP Probes
Editing ICMP Probes
Viewing Script Probes
Adding Script Probes
Editing Script Probes
Managing Probes
CVDM-CSM lets you monitor real servers and server farms using probes to determine if the real servers are operational. CVDM-CSM supports a variety of probe types that monitor real servers, such as HTTP, FTP, SMTP, TELNET, TCP, UDP, ICMP and Script probes.
You can configure probes by specifying the probe name and type. After configuring a probe, you must associate it with a server farm for the probe to take effect. You can associate single or multiple probes with a server farm. All servers in the server farm receive probes of the probe types that are associated with that server farm. You can associate one or more probe types with a server farm.
If a real server fails to reply after a specified number of consecutive retries, you will be notified and CVDM-CSM will adjust the incoming connections accordingly. Probes will continue to monitor failed servers until they become active again.
To support a more flexible health-probing functionality, you can upload and execute Toolkit Command Language (TCL) scripts on the CVDM-CSM. You can create a script probe that the CVDM-CSM periodically executes for each real server in any server farm associated with a probe. Depending upon the exit code of such a script, the real server is considered healthy, suspect, or failed. Probe scripts test the health of a real server by creating a network connection to the server, sending data to the server, and checking the response.
This section contains the following topics:
• Viewing Probes
• Adding Probes
• Editing Probes
• Viewing HTTP Probes
• Viewing FTP Probes
• Viewing SMTP Probes
• Viewing TELNET Probes
• Viewing TCP Probes
• Viewing UDP Probes
• Viewing ICMP Probes
• Viewing Script Probes
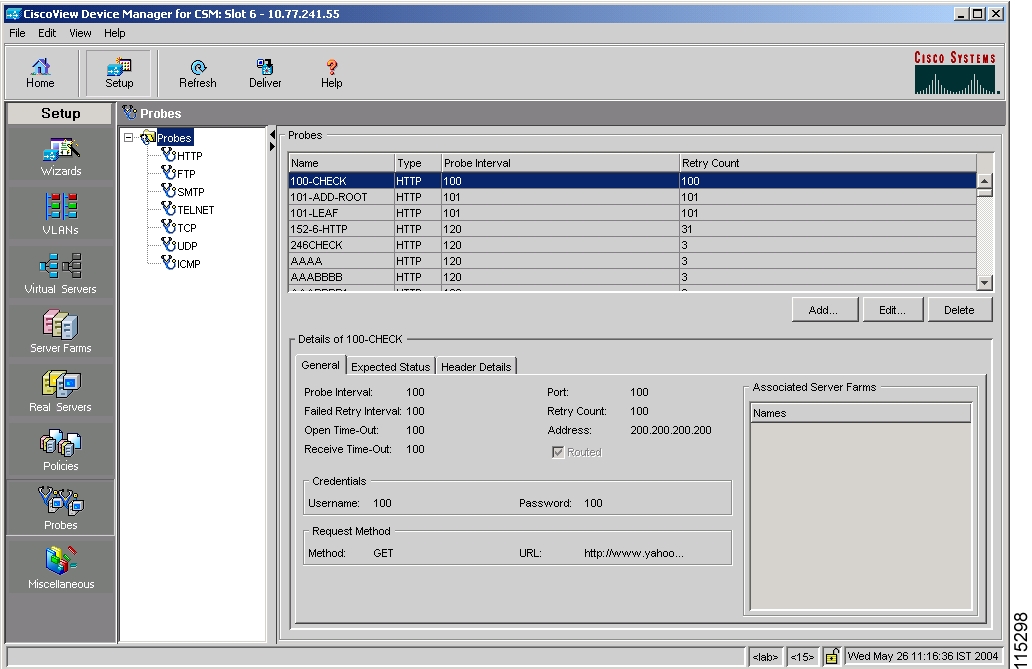
Viewing Probes
Figure 10-1 Probes Page
You can view information about all probes on the device.
Step 1 Click Setup from the task bar.
Step 2 Click Probes in the Setup pane. The Probes dialog box appears, displaying the following columns.
Column
|
Action/Description
|
Name
|
Name of the probe.
|
Type
|
Type of probe. The different types are HTTP, FTP, SMTP, TELNET, TCP, UDP, ICMP, and Script.
|
Probe Interval
|
Time (in seconds) between the probes.
|
Retry Count
|
Number of probe attempts to wait for before marking a server as failed.
|
Details
|
The details of the selected probe appear.
|
From this dialog box, you can do the following:
•Click Add to add probes. For more information, see Adding Probes.
•Click Edit to add probes. For more information, see Editing Probes.
•Select a probe, then click Delete to delete it.
Related Topics
• Viewing HTTP Probes
• Viewing FTP Probes
• Viewing SMTP Probes
• Viewing TELNET Probes
• Viewing TCP Probes
• Viewing UDP Probes
• Viewing ICMP Probes
• Viewing Script Probes
Adding Probes
Step 1 Click Setup from the task bar.
Step 2 Click Probes in the Setup pane. A table with details of all configured probes appears.
Step 3 Click Add. The Add Probes dialog box appears.
In the Type field, choose the type of probe which you want to add. The fields in the pane change according to the type of probe.
Possible probe types are:
•HTTP
•FTP
•SMTP
•TELNET
•TCP
•UDP
•ICMP
•Script
Related Topics
• Adding HTTP Probes
• Adding FTP Probes
• Adding SMTP Probes
• Adding TELNET Probes
• Adding TCP Probes
• Adding UDP Probes
• Adding ICMP Probes
• Adding Script Probes
Editing Probes
Step 1 Click Setup from the task bar.
Step 2 Click Probes in the Setup pane. A table with details of all configured probes appears.
Select the probe that you wish to modify and click Edit. The Edit Probes dialog box appears. The fields in the pane change according to the type of probe.
Step 3 In the Edit Probe pane, the field Type shows the type of probe. The fields in the pane change according to the type of probe.
Possible probe types are:
•HTTP
•FTP
•SMTP
•TELNET
•TCP
•UDP
•ICMP
•Script
Related Topics
• Editing HTTP Probes
• Editing FTP Probes
• Editing SMTP Probes
• Editing TELNET Probes
• Editing TCP Probes
• Editing UDP Probes
• Editing ICMP Probes
• Editing Script Probes
Viewing HTTP Probes
An HTTP probe establishes an HTTP connection to a real server, sends an HTTP request, and then verifies the response.
Step 1 Click Setup from the task bar. Click Probes in the Setup pane.
Step 2 Select Probes > HTTP in the object selector. The HTTP Probes dialog box appears, displaying the following columns:
Column
|
Action/Description
|
Name
|
Name of the probe.
|
Probe Interval
|
Time (in seconds) between the probes.
|
Retry Count
|
Number of probe attempts to wait for before marking a server as failed.
|
More information about the selected probe appears at the bottom of the table. The following sections describe the types of information available:
• General Tab
• Expected Status Tab
• Header Details Tab
General Tab
When you click the General tab, the following information appears:
Column
|
Action/Description
|
Details
|
Probe Interval
|
Number of seconds to wait between probes, from the end of the previous probe to the beginning of the next probe.
|
Port
|
Decimal TCP/UDP port number or port name.
|
Failed Retry Interval
|
Time (in seconds) before retrying a failed server.
|
Retry Count
|
Number of probes to wait before marking a server as failed.
|
Open Timeout
|
Maximum time in seconds to wait for a TCP connection.
|
Address
|
IP address of the real server.
|
Receive Timeout
|
Maximum time in seconds to wait for a reply from the real server.
|
Routed
|
Displays the check box status, selected or deselected.
Specifies that the probe is routed according to the CVDM-CSM routing table.
|
Credentials
|
Username
|
Name that appears in the HTTP header.
|
Password
|
Password that appears in the HTTP header.
|
Associated Server Farms
|
Name
|
Server Farm associated with the probe.
All servers in the server farm receive probes of the types that are associated with that server farm.
You can associate one or more probe types with a server farm.
|
Request Method
|
Method
|
Specifies either of the following methods for the probe request:
•get—The probe directs the server to get this page.
•head—The probe directs the server to get only the header for this page.
|
URL
|
Specifies the URL.
|
Expected Status Tab
When you click the Expected Status tab, you can configure status codes to expect from the HTTP probe. A table appears with the following information:
Column
|
Action/Description
|
Minimum Value
|
Minimum status code in a range. There will be only a single status code if a maximum number is not specified.
Note You cannot add overlapping status codes. The range should be outside what you have already added.
|
Maximum Value
|
Maximum status code in a range.
Note You cannot add overlapping status codes. The range should be outside what you have already added.
|
•Click Add to add the minimum and maximum expected status.
•Select a probe and click Delete to delete the probe.
Header Details Tab
When you click the Header Details tab, the following information appears:
Column
|
Action/Description
|
Name
|
Name of the header being defined.
|
Value
|
Content for the header.
|
From this dialog box, you can do the following:
•Click Add to add HTTP probes. For more information, see "Adding HTTP Probes" section.
•Click Edit to edit an HTTP probe. For more information, see "Editing HTTP Probes" section.
•Select a HTTP probe, then click Delete to delete the probe.
Adding HTTP Probes
Step 1 Click Setup from the task bar. Click Probes in the Setup pane.
Step 2 Select Probes > HTTP in the object selector.
Step 3 Click Add. The Add Probe dialog box appears, displaying the following columns.
Column
|
Action/Description
|
Name
|
Enter the name of the probe.
|
Type
|
The type of probe. Here it will be HTTP.
|
Port
|
Enter the decimal TCP/UDP port number or port name.
|
Retry Count
|
Enter the number of probe attempts to wait for before marking a server as failed.
|
Probe Interval
|
Enter the time (in seconds) between the probes.
|
Failed Retry Interval
|
Enter the time (in seconds) before retrying a failed server.
|
Open Timeout
|
Enter the maximum time (in seconds) to wait for a TCP connection.
|
Receive Timeout
|
Enter the maximum time (in seconds) to wait for a reply from the real server.
|
Address
|
Enter the IP address of the real server.
|
Routed
|
If this check box is selected, it implies that CVDM-CSM routes this probe according to its routing table.
|
User Credentials
|
Username
|
Enter the name that appears in the HTTP header.
|
Password
|
Enter the password that appears in the HTTP header.
|
Request Method
|
Method
|
Specifies either of the following methods for the probe request:
•get—The probe directs the server to get this page.
•head—The probe directs the server to get only the header for this page.
|
URL
|
Specify the URL.
|
Expected Status
|
Minimum Value
|
Enter the minimum status code in a range. There will be only a single status code if a maximum number is not specified.
Note You cannot add overlapping status codes. The range should be outside what you have already added.
|
Maximum Value
|
Enter the maximum status code in a range.
Note You cannot add overlapping status codes. The range should be outside what you have already added.
|
Header Name and Value
|
Name
|
Click Add, then enter the name for the header being defined.
|
Value
|
Enter the content for the header.
|
From this dialog box, you can do the following:
•Under Expected Status:
–Click Add to add the minimum and maximum expected status.
–Select a probe and click Delete to delete the probe.
•Under Header Name and Value:
–Click Add to add the header name and values of the probe.
–Select a range and click Delete to delete the values.
Editing HTTP Probes
Step 1 Click Setup from the task bar. Click Probes in the Setup pane.
Step 2 Select Probes > HTTP in the object selector.
Step 3 Click Edit. The Edit Probe dialog box appears, displaying the following columns.
Column
|
Action/Description
|
Name
|
Name of the probe.
|
Type
|
Type of probe. Here it will be HTTP.
|
Port
|
Enter the decimal TCP/UDP port number or port name.
|
Retry Count
|
Enter the number of probe attempts to wait for before marking a server as failed.
|
Probe Interval
|
Enter the time (in seconds) between the probes.
|
Failed Retry Interval
|
Enter the time (in seconds) before retrying a failed server.
|
Open Timeout
|
Enter the maximum time (in seconds) to wait for a TCP connection.
|
Receive Timeout
|
Enter the maximum time (in seconds) to wait for a reply from real server.
|
Address
|
Enter the IP address of the real server.
|
Routed
|
If this check box is selected, it implies that CVDM-CSM routes this probe according to its routing table.
|
User Credentials
|
Username
|
Enter the name that appears in the HTTP header.
|
Password
|
Enter the password that appears in the HTTP header.
|
Request Method
|
Method
|
Specifies either of the following methods for the probe request:
•get—The probe directs the server to get this page.
•head—The probe directs the server to get only the header for this page.
|
URL
|
Specify the URL.
|
Expected Status
|
Minimum Value
|
Enter the minimum status code in a range. There will be only a single status code if a maximum number is not specified.
Note You cannot add overlapping status codes. The range should be outside what you have already added.
|
Maximum Value
|
Enter the maximum status code in a range.
Note You cannot add overlapping status codes. The range should be outside what you have already added.
|
Header Name and Value
|
Name
|
Click Add, then enter the name for the header being defined.
|
Value
|
Enter the content for the header.
|
From this dialog box, you can do the following:
•Under Expected Status:
–Click Add to add the minimum and maximum expected status.
–Select a probe and click Delete to delete the probe.
•Under Header Name and Value:
–Click Add to add the header name and values of the probe.
–Select a range and click Delete to delete the values.
Viewing FTP Probes
Step 1 Click Setup from the task bar. Click Probes in the Setup pane.
Step 2 Select Probes > FTP in the object selector. The FTP probes dialog box appears, displaying the following columns:
Column
|
Action/Description
|
Name
|
Name of the probe.
|
Probe Interval
|
Time (in seconds) between the probes.
|
Retry Count
|
Number of probe attempts to wait for before marking a server as failed.
|
More details about the selected probe appear at the bottom of the table. These are of two types:
• General Tab
• Expected Status Tab
General Tab
When you click the General tab, the following information appears:
Column
|
Action/Description
|
Port
|
Decimal TCP/UDP port number or port name.
|
Retry Count
|
Number of probe attempts to wait for before marking a server as failed.
|
Probe Interval
|
Time (in seconds) between the probes.
|
Failed Retry Interval
|
Time (in seconds) before retrying a failed server.
|
Open Timeout
|
Maximum time (in seconds) to wait for a TCP connection.
|
Receive Timeout
|
Maximum time (in seconds) to wait for a reply from the real server.
|
Associated Server Farms
|
Name
|
Server Farm associated with the probe.
All servers in the server farm receive probes of the probe types that are associated with that server farm.
You can associate one or more probe types with a server farm.
|
Expected Status Tab
When you click the Expected Status tab, you can configure status codes to expect from the HTTP probe. A table appears with the following information:
Column
|
Action/Description
|
Minimum Value
|
Minimum status code in a range. There will be only a single status code if max-number is not specified.
Note You cannot add overlapping status codes. The range should be outside what you have already added.
|
Maximum Value
|
Maximum status code in a range.
Note You cannot add overlapping status codes. The range should be outside what you have already added.
|
•Click Add to add the minimum and maximum expected status.
•Select a probe and click Delete to delete the probe.
From this dialog box, you can do the following:
•Click Add to add FTP probes. For more information, see "Adding FTP Probes" section
•Click Edit to edit a FTP probes. For more information, see "Editing FTP Probes" section.
•Select a FTP probe, then click Delete to delete the probe.
Adding FTP Probes
Step 1 Click Setup from the task bar. Click Probes in the Setup pane.
Step 2 Select Probes > FTP in the object selector.
Step 3 Click Add. The Add Probe dialog box appears, displaying the following columns.
Column
|
Action/Description
|
Name
|
Enter the name of the probe.
|
Type
|
Displays the type of probe. Here it will be FTP.
|
Probe Interval
|
Enter the time (in seconds) between the probes.
|
Failed Retry Interval
|
Enter the time in seconds before retrying a failed server.
|
Open Timeout
|
Enter the maximum time (in seconds) to wait for a TCP connection.
|
Receive Timeout
|
Enter the maximum time (in seconds) to wait for a reply from real server.
|
Port
|
Enter the decimal TCP/UDP port number or port name.
|
Retry Count
|
Enter the number of probe attempts to wait for before marking a server as failed.
|
Expected Status
|
Minimum Value
|
Click Add. Enter the minimum status code in a range. There will be only a single status code if a maximum number is not specified.
Note You cannot add overlapping status codes. The range should be outside what you have already added.
|
Maximum Value
|
Enter the maximum status code in a range.
Note You cannot add overlapping status codes. The range should be outside what you have already added.
|
From this dialog box, you can do the following:
•Click Add to add expect status details by adding the minimum and maximum expect status..
•Select a probe and click Delete to delete the probe.
Editing FTP Probes
Step 1 Click Setup from the task bar. Click Probes in the Setup pane.
Step 2 Select Probes > FTP in the object selector.
Step 3 Click Edit. The Edit Probe dialog box appears, displaying the following columns:
Column
|
Action/Description
|
Name
|
The name of the probe.
|
Type
|
Type of probe. Here it will be FTP.
|
Probe Interval
|
Enter the time (in seconds) between the probes.
|
Failed Retry Interval
|
Enter the time (in seconds) before retrying a failed server.
|
Open Timeout
|
Enter the maximum time (in seconds) to wait for a TCP connection.
|
Receive Timeout
|
Enter the maximum time (in seconds) to wait for a reply from real server.
|
Port
|
Enter the decimal TCP/UDP port number or port name.
|
Retry Count
|
Enter the number of probe attempts to wait for before marking a server as failed.
|
Expected Status
|
Minimum Value
|
Click Add. Modify the minimum status code in a range. There will be only a single status code if a maximum number is not specified.
Note You cannot add overlapping status codes. The range should be outside what you have already added.
|
Maximum Value
|
Modify the maximum status code in a range.
Note You cannot add overlapping status codes. The range should be outside what you have already added.
|
From this dialog box, you do the following:
•Click Add to add the minimum and maximum expected status.
•Select a probe and click Delete to delete the probe.
Viewing SMTP Probes
Step 1 Click Setup from the task bar. Click Probes in the Setup pane.
Step 2 Select Probes > SMTP in the object selector. The SMTP Probe dialog box appears, displaying the following columns.
Column
|
Action/Description
|
Name
|
Name of the probe.
|
Probe Interval
|
Time (in seconds) between the probes.
|
Retry Count
|
Number of probe attempts to wait for before marking a server as failed.
|
More details about the selected probe appear at the bottom of the table when you select the two tabs. These are of two types:
• General Tab
• Expected Status Tab
From this dialog box, you can do the following:
•Click Add to add SMTP probes. For more information, see "Adding SMTP Probes" section.
•Click Edit to edit a SMTP probe. For more information, see "Editing SMTP Probes" section.
•Select a SMTP probe, then click Delete to delete the probe.
General Tab
When you click the General tab, the following information appears:
Column
|
Action/Description
|
Probe Interval
|
Time (in seconds) between the probes.
|
Port
|
Decimal TCP/UDP port number or port name.
|
Failed Retry Interval
|
Time (in seconds) before retrying a failed server.
|
Retry Count
|
Number of probe attempts to wait for before marking a server as failed.
|
Open Timeout
|
Maximum time (in seconds) to wait for a TCP connection.
|
Receive Timeout
|
Maximum time (in seconds) to wait for a reply from the real server.
|
Associated Server Farms
|
Name
|
Server Farm associated with the probe.
All servers in the server farm receive probes of the probe types that are associated with that server farm.
You can associate one or more probe types with a server farm.
|
Expected Status Tab
When you click the Expected Status tab, you can configure status codes to expect from the HTTP probe. A table appears with the following information:
Field
|
Action/Description
|
Minimum Value
|
Minimum status code in a range. There will be only a single status code if a maximum number is not specified.
Note You cannot add overlapping status codes. The range should be outside what you have already added.
|
Maximum Value
|
Maximum status code in a range.
Note You cannot add overlapping status codes. The range should be outside what you have already added.
|
From this dialog box, you can do the following:
•Click Add to add the minimum and maximum expected status.
•Select a probe and click Delete to delete the probe.
Adding SMTP Probes
Step 1 Click Setup from the task bar. Click Probes in the Setup pane.
Step 2 Select Probes > SMTP in the object selector.
Step 3 Click Add. The Add Probe dialog box appears, displaying the following columns:
Column
|
Action/Description
|
Name
|
Enter the name of the probe.
|
Type
|
Specifies the type of probe. Here it will be SMTP.
|
Probe Interval
|
Enter the time (in seconds) between the probes.
|
Failed Retry Interval
|
Enter the time (in seconds) before retrying a failed server.
|
Open Timeout
|
Enter the maximum time (in seconds) to wait for a TCP connection.
|
Receive Timeout
|
Enter the maximum time (in seconds) to wait for a reply from real server.
|
Port
|
Enter the decimal TCP/UDP port number or port name.
|
Retry Count
|
Enter the number of probe attempts to wait for before marking a server as failed.
|
Expected Status
|
Minimum Value
|
Click Add. Enter the minimum status code in a range. There will be only a single status code if a maximum number is not specified.
Note You cannot add overlapping status codes. The range should be outside what you have already added.
|
Maximum Value
|
Enter the maximum status code in a range.
Note You cannot add overlapping status codes. The range should be outside what you have already added.
|
From this dialog box, you can do the following:
•Click Add to add expect status details by adding the minimum and maximum expect status.
•Select a probe and click Delete to delete the probe.
Editing SMTP Probes
Step 1 Click Setup from the task bar. Click Probes in the Setup pane.
Step 2 Select Probes > SMTP in the object selector.
Step 3 Click Edit. The Edit Probe dialog box appears, displaying the following columns:
Column
|
Action/Description
|
Name
|
Name of the probe.
|
Type
|
Type of probe. Here it will be SMTP.
|
Probe Interval
|
Enter the time (in seconds) between the probes.
|
Failed Retry Interval
|
Enter the time (in seconds) before retrying a failed server.
|
Open Timeout
|
Enter the maximum time (in seconds) to wait for a TCP connection.
|
Receive Timeout
|
Enter the maximum time (in seconds) to wait for a reply from the real server.
|
Port
|
Enter the decimal TCP/UDP port number or port name.
|
Retry Count
|
Enter the number of probe attempts to wait for before marking a server as failed.
|
Expected Status
|
Minimum Value
|
Click Add. Enter the minimum status code in a range. There will be only a single status code if a maximum number is not specified.
Note You cannot add overlapping status codes. The range should be outside what you have already added.
|
Maximum Value
|
Enter the maximum status code in a range.
Note You cannot add overlapping status codes. The range should be outside what you have already added.
|
From this dialog box you can do the following:
•Click Add to add the minimum and maximum expected status.
•Select a probe and click Delete to delete the probe.
Viewing TELNET Probes
Step 1 Click Setup from the task bar. Click Probes in the Setup pane.
Step 2 Select Probes > TELNET in the object selector. The TELNET Probe dialog box appears, displaying the following columns.
Column
|
Action/Description
|
Name
|
Name of the probe.
|
Probe Interval
|
Time interval (in seconds) between the probes.
|
Retry Count
|
Number of probe attempts to wait for before marking the server as failed.
|
More details about the selected probe appear at the bottom of the table when you select the to tabs. These are of two types:
• General Tab
• Expected Status Tab
From this dialog box, you can do the following:
•Click Add to add TELNET probes. For more information, see "Adding TELNET Probes" section.
•Click Edit to edit a TELNET probe. For more information, see "Editing TELNET Probes" section.
•Select a TELNET probe, then click Delete to delete the probe.
General Tab
When you click the General tab, the following information appears:
Field
|
Action/Description
|
Probe Interval
|
Time (in seconds) between the probes.
|
Port
|
Decimal TCP/UDP port number or port name.
|
Failed Retry Interval
|
Time (in seconds) before retrying a failed server.
|
Retry Count
|
Number of probe attempts to wait for before marking a server as failed.
|
Open Timeout
|
Maximum time (in seconds) to wait for a TCP connection.
|
Receive Timeout
|
Maximum time (in seconds) to wait for a reply from the real server.
|
Associated Server Farms
|
Name
|
Server Farm associated with the probe.
All servers in the server farm receive probes of the probe types that are associated with that server farm.
You can associate one or more probe types with a server farm.
|
Expected Status Tab
When you click the Expected Status tab, you can configure status codes to expect from the HTTP probe. A table appears with the following information:
Column
|
Action/Description
|
Minimum Value
|
Minimum status code in a range. There will be only a single status code if a maximum number is not specified.
Note You cannot add overlapping status codes. The range should be outside what you have already added.
|
Maximum Value
|
Maximum status code in a range.
Note You cannot add overlapping status codes. The range should be outside what you have already added.
|
From this dialog box, you can do the following:
•Click Add to add the minimum and maximum expected status.
•Select a probe and click Delete to delete the probe.
Adding TELNET Probes
Step 1 Click Setup from the task bar. Click Probes in the Setup pane.
Step 2 Select Probes > TELNET in the object selector.
Step 3 Click Add. The Add Probe dialog box appears, displaying the following columns:
Column
|
Action/Description
|
Name
|
Enter the name of the probe.
|
Type
|
Displays the type of probe. Here it will be TELNET.
|
Probe Interval
|
Enter the time (in seconds) between the probes.
|
Failed Retry Interval
|
Enter the time (in seconds) before retrying a failed server.
|
Open Timeout
|
Enter the maximum time (in seconds) to wait for a TCP connection.
|
Receive Timeout
|
Enter the maximum time (in seconds) to wait for a reply from real server.
|
Port
|
Enter the decimal TCP/UDP port number or port name.
|
Retry Count
|
Enter the number of probe attempts to wait for before marking a server as failed.
|
Expected Status
|
Minimum Value
|
Click Add. Enter the minimum status code in a range. There will be only a single status code if a maximum number is not specified.
Note You cannot add overlapping status codes. The range should be outside what you have already added.
|
Maximum Value
|
Enter the maximum status code in a range.
Note You cannot add overlapping status codes. The range should be outside what you have already added.
|
From this dialog box, you can do the following:
•Click Add to add expect status details by adding the minimum and maximum expect status.
•Select a probe and click Delete to delete the probe.
Editing TELNET Probes
Step 1 Click Setup from the task bar. Click Probes in the Setup pane.
Step 2 Select Probes > TELNET in the object selector.
Step 3 Click Edit. The Edit Probe dialog box appears, displaying the following columns:
Column
|
Action/Description
|
Name
|
Name of the probe.
|
Type
|
Type of probe. Here it will be TELNET.
|
Probe Interval
|
Time (in seconds) between the probes.
|
Failed Retry Interval
|
Enter the time (in seconds) before retrying a failed server.
|
Open Timeout
|
Enter the maximum time (in seconds) to wait for a TCP connection.
|
Receive Timeout
|
Enter the maximum time (in seconds) to wait for a reply from real server.
|
Port
|
Enter the decimal TCP/UDP port number or port name.
|
Retry Count
|
Enter the number of probe attempts to wait for before marking a server as failed.
|
Expected Status
|
Minimum Value
|
Click Add. Enter the minimum status code in a range. There will be only a single status code if a number is not specified.
Note You cannot add overlapping status codes. The range should be outside what you have already added.
|
Maximum Value
|
Enter the maximum status code in a range.
Note You cannot add overlapping status codes. The range should be outside what you have already added.
|
From this dialog box, you can do the following:
•Click Add to add the minimum and maximum expected status.
•Select a probe and click Delete to delete the probe.
Viewing TCP Probes
Step 1 Click Setup from the task bar. Click Probes in the Setup pane.
Step 2 Select Probes > TCP in the object selector. The TCP Probes dialog box appears, displaying the following columns:
Column
|
Action/Description
|
Name
|
Name of the probe.
|
Interval
|
Time (in seconds) between the probes.
|
Retry Count
|
Number of probe attempts to wait for before marking a server as failed.
|
More details about the selected probe appear at the bottom of the table.
Column
|
Action/Description
|
Probe Interval
|
Time (in seconds) between the probes.
|
Port
|
Decimal TCP/UDP port number or port name.
|
Failed Retry Interval
|
Time (in seconds) before retrying a failed server.
|
Retry Count
|
Number of probe attempts to wait for before marking a server as failed.
|
Open Timeout
|
Maximum time (in seconds) to wait for a TCP connection.
|
Receive Timeout
|
Maximum time (in seconds) to wait for a reply from real server.
|
Associated Server Farms
|
Name
|
Server Farm associated with the probe.
All servers in the server farm receive probes of the probe types that are associated with that server farm.
You can associate one or more probe types with a server farm.
|
From this dialog box, you can do the following:
•Click Add to add TCP probes. For more information, see "Adding TCP Probes" section.
•Click Edit to edit a TCP probe. For more information, see "Editing TCP Probes" section.
•Select a TCP probe, then click Delete to delete the probe.
Adding TCP Probes
Step 1 Click Setup from the task bar. Click Probes in the Setup pane.
Step 2 Select Probes > TCP in the object selector.
Step 3 Click Add. The Add Probe dialog box appears, displaying the following columns:
Column
|
Action/Description
|
Name
|
Enter the name of the probe.
|
Type
|
Type of probe. Here it will be TCP.
|
Probe Interval
|
Enter the time (in seconds) between the probes.
|
Failed Retry Interval
|
Enter the time (in seconds) before retrying a failed server.
|
Open Timeout
|
Enter the maximum time (in seconds) to wait for a TCP connection.
|
Port
|
Enter the decimal TCP/UDP port number or port name.
|
Retry Count
|
Number of probe attempts to wait for before marking a server as failed.
|
Editing TCP Probes
Step 1 Click Setup from the task bar. Click Probes in the Setup pane.
Step 2 Select Probes > FTP in the object selector.
Step 3 Click Edit. The Edit Probe dialog box appears, displaying the following columns:
Column
|
Action/Description
|
Name
|
Name of the probe.
|
Type
|
Type of probe. Here it will be TCP.
|
Probe Interval
|
Enter the time (in seconds) between the probes.
|
Failed Retry Interval
|
Modify the time (in seconds) before retrying a failed server.
|
Open Time- Out
|
Modify the maximum time (in seconds) to wait for a TCP connection.
|
Port
|
Modify the decimal TCP/UDP port number or port name.
|
Retry Count
|
Number of probe attempts to wait for before marking a server as failed.
|
Viewing UDP Probes
Note You cannot view UDP probes in the following IOS versions: 12.1(13)E, 12.2(14)SY and 12.2(14)SX1.
You must configure an ICMP probe in addition to a UDP probe for any given server. The UDP probe requires ICMP because the UDP probe will be unable to detect when a server has gone down or has been disconnected.The CSM uses the ICMP Unreachable message to determine if the UDP application is not reachable. If there is no ICMP Unreachable reply in the receive timeout, the CSM assumes that the probe is operating correctly.
Step 1 Click Setup from the task bar. Click Probes in the Setup pane.
Step 2 Select Probes > UDP in the object selector. The UDP probes window appears, displaying the following columns:
Column
|
Action/Description
|
Name
|
Name of the probe.
|
Probe Interval
|
Time (in seconds) between the probes.
|
Retry Count
|
Number of probe attempts to wait for before marking a server as failed.
|
More details about the selected probe appear at the bottom of the table with the following information:
Column
|
Action/Description
|
Probe Interval
|
Time (in seconds) between the probes.
|
Port
|
Decimal TCP/UDP port number or port name.
|
Failed Retry Interval
|
Time (in seconds) before retrying a failed server.
|
Retry Count
|
Number of probe attempts to wait for before marking a server as failed.
|
Receive Timeout
|
Maximum time (in seconds) to wait for a reply from real server.
|
Associated Server Farms
|
Name
|
Server Farm associated with the probe.
All servers in the server farm receive probes of the probe types that are associated with that server farm.
You can associate one or more probe types with a server farm.
|
From this dialog box, you can do the following:
•Click Add to add UDP probe. For more information, see "Adding UDP Probes" section.
•Click Edit to edit a UDP probe. For more information, see "Editing UDP Probes" section.
•Select a UDP probe, then click Delete to delete the probe.
Adding UDP Probes
Step 1 Click Setup from the task bar. Click Probes in the Setup pane.
Step 2 Select Probes > UDP in the object selector.
Step 3 Click Add. The Add Probe dialog box appears, displaying the following columns:
Column
|
Action/Description
|
Name
|
Enter the name of the probe.
|
Type
|
Type of probe. Here it will be UDP.
|
Probe Interval
|
Enter the time (in seconds) between the probes.
|
Failed Retry Interval
|
Enter the time (in seconds) before retrying a failed server.
|
Receive Time-Out
|
Enter the maximum time (in seconds) to wait for a reply from real server.
|
Port
|
Enter the decimal TCP/UDP port number or port name.
|
Retry Count
|
Number of probe attempts to wait for before marking a server as failed.
|
Editing UDP Probes
Step 1 Click Setup from the task bar. Click Probes in the Setup pane.
Step 2 Select Probes > UDP in the object selector.
Step 3 Click Edit. The Edit Probe dialog box appears, displaying the following columns:
Column
|
Action/Description
|
Name
|
Name of the probe.
|
Type
|
Type of probe. Here it will be UDP.
|
Probe Interval
|
Enter the time (in seconds) between the probes.
|
Failed Retry Interval
|
Enter the time (in seconds) before retrying a failed server.
|
Receive Timeout
|
Enter the maximum time (in seconds) to wait for a reply from the real server.
|
Port
|
Enter the decimal TCP/UDP port number or port name.
|
Retry Count
|
Number of probe attempts to wait for before marking a server as failed.
|
Viewing ICMP Probes
An ICMP probe sends an ICMP echo (for example, ping) to the real server, and then verifies the response.
Step 1 Click Setup from the task bar. Click Probes in the Setup pane.
Step 2 Select Probes > ICMP in the object selector. The ICMP probes window appears, displaying the following columns:
Column
|
Action/Description
|
Name
|
Name of the probe.
|
Probe Interval
|
Time (in seconds) between the probes.
|
Retry Count
|
Number of probe attempts to wait for before marking a server as failed.
|
More details about the selected probe appear at the bottom of the table with the following information.
Column
|
Action/Description
|
Probe Interval
|
Time (in seconds) between the probes.
|
Retry Count
|
Number of probe attempts to wait for before marking a server as failed.
|
Failed Retry Interval
|
Time (in seconds) before retrying a failed server.
|
Address
|
The IP address of the probes.
|
Receive Timeout
|
Maximum time in seconds to wait for a reply from real server.
|
Routed
|
Displays the check box status, selected or deselected.
Specifies that the probe is routed according to the CSM routing table.
|
Associated Server Farms
|
Name
|
Server Farm associated with the probe.
All servers in the server farm receive probes of the probe types that are associated with that server farm.
You can associate one or more probe types with a server farm.
|
From this dialog box, you can do the following:
•Click Add to add ICMP probes. For more information, see "Adding ICMP Probes" section.
•Click Edit to edit an ICMP probe. For more information, see "Editing ICMP Probes" section.
•Select a ICMP probe, then click Delete to delete the probe.
Adding ICMP Probes
Step 1 Click Setup from the task bar. Click Probes in the Setup pane.
Step 2 Select Probes > ICMP in the object selector.
Step 3 Click Add.The Add Probe dialog box appears, displaying the following columns:
Column
|
Action/Description
|
Name
|
Enter the name of the probe.
|
Type
|
Type of probe. Here it will be ICMP.
|
Probe Interval
|
Enter the time (in seconds) between the probes.
|
Failed Retry Interval
|
Enter the time (in seconds) before retrying a failed server.
|
Receive Time-Out
|
Enter the maximum time (in seconds) to wait for a reply from real server
|
Retry Count
|
Enter the number of probe attempts to wait for before marking a server as failed.
|
Address
|
Enter the IP address of the real server.
|
Routed
|
Select the check box to specify that the CVDM-CSM route the probe according to its routing table.
|
Editing ICMP Probes
Step 1 Click Setup from the task bar. Click Probes in the Setup pane.
Step 2 Select Probes > ICMP in the object selector.
Step 3 Click Edit. The Edit Probe dialog box appears, displaying the following columns.
Column
|
Action/Description
|
Name
|
Name of the probe.
|
Type
|
Type of probe. Here it will be ICMP.
|
Probe Interval
|
Enter the time (in seconds) between the probes.
|
Failed Retry Interval
|
Enter the time in seconds before retrying a failed server.
|
Receive Timeout
|
Enter the maximum time in seconds to wait for a reply from real server
|
Retry Count
|
Enter the number of probe attempts to wait for before marking a server as failed.
|
Address
|
Enter the IP address of the real server.
|
Routed
|
Select the check box to specify that the CVDM-CSM route the probe according to its routing table.
|
Viewing Script Probes
Probe scripts test the health of a real server by creating a network connection to the server, sending data to the server, and checking the response.
To support a more flexible health-probing functionality, you can upload and execute Toolkit Command Language (TCL) scripts on the CVDM-CSM. You can create a script probe that the CVDM-CSM periodically executes for each real server in any server farm associated with a probe.
Step 1 Click Setup from the task bar. Click Probes in the Setup pane.
Step 2 Select Probes > Script in the object selector. The Script Probes dialog box appears, displaying the following columns:
Column
|
Action/Description
|
Name
|
Name of the probe.
|
Probe Interval
|
Time (in seconds) between the probes.
|
Retry Count
|
Number of probe attempts to wait for before marking a server as failed.
|
More details about the selected probe appear at the bottom of the table.
Column
|
Action/Description
|
Probe Interval
|
Time (in seconds) between the probes.
|
Port
|
Decimal TCP/UDP port number or port name.
|
Retry Count
|
Number of probe attempts to wait for before marking a server as failed.
|
Failed Retry Interval
|
Time (in seconds) before retrying a failed server.
|
Receive Time-Out
|
Maximum time (in seconds) to wait for a reply from real server.
|
Open Time- Out
|
Maximum time (in seconds) to wait for a TCP connection.
|
Associated Health Script
|
The health-monitoring script associated with the probe.
|
Script Arguments
|
The arguments of the script.
|
From this dialog box, you can do the following:
•Click Add to add Script probes. For more information, see "Adding Script Probes" section.
•Click Edit to edit an Script probe. For more information, see "Editing Script Probes" section.
•Select a Script probe, then click Delete to delete the probe.
Adding Script Probes
Step 1 Click Setup from the task bar. Click Probes in the Setup pane.
Step 2 Select Probes > Script in the object selector.
Step 3 Click Add. The Add Probe dialog box appears, displaying the following columns:
Field
|
Action/Description
|
Name
|
Enter the name of the probe.
|
Type
|
Type of probe. Here it will be Script.
|
Probe Interval
|
Enter time (in seconds) between the probes.
|
Failed Retry Interval
|
Enter the time (in seconds) before retrying a failed server.
|
Open Timeout
|
Enter the maximum time (in seconds) to wait for a TCP connection.
|
Receive Timeout
|
Maximum time (in seconds) to wait for a reply from real server.
|
Port
|
Enter the decimal TCP/UDP port number or port name.
|
Retry Count
|
Enter the number of probe attempts to wait for before marking a server as failed.
|
Health Script
|
Click  and select one of the following: and select one of the following:
•Select Health Script—Opens the Select Health Script dialog box and allows you to select from a list of health scripts.
•Clear Health Script—Allows you to clear the field.
|
Script Arguments
|
The arguments of the script. You can add upto 5 arguments for the script.
|
Editing Script Probes
Step 1 Click Setup from the task bar. Click Probes in the Setup pane.
Step 2 Select Probes > Script in the object selector.
Step 3 Click Edit. The Edit Probe dialog box appears, displaying the following columns.
Column
|
Action/Description
|
Name
|
Enter the name of the probe.
|
Type
|
Type of probe. Here it will be Script.
|
Probe Interval
|
Enter time (in seconds) between the probes.
|
Failed Retry Interval
|
Enter the time (in seconds) before retrying a failed server.
|
Open Timeout
|
Enter the maximum time (in seconds) to wait for a TCP connection.
|
Port
|
Enter the decimal TCP/UDP port number or port name.
|
Receive Timeout
|
Enter the maximum time (in seconds) to wait for a reply from real server.
|
Retry Count
|
Enter the number of probe attempts to wait for before marking a server as failed.
|
Health Script
|
Click and select one of the following:
•Select Health Script—Opens the Select Health Script dialog box and allows you to select from a list of health scripts.
•Clear Header Map—Allows you to clear the field.
|
Script Arguments
|
The arguments of the script. You can add upto 5 arguments for the script.
|