|
|

Table Of Contents
Designing Networks with Cisco MetroPlanner
2.1 Launching Cisco MetroPlanner
2.1.2 Loading and Unloading Networks
2.1.4 Importing a Cisco MetroPlanner 2.5 Project
2.2 Setting Cisco MetroPlanner Options
2.2.1 Setting the Graphical Display
2.2.2 Setting the Default Platform Values
2.2.3 Setting the Default Project Values
2.2.4 Setting the Fiber Type Default Values
2.2.5 Defining Third-Party DWDM Interfaces
2.2.6 Updating the Restricted Equipment List
2.2.9 Resetting the Default Layout
2.3.4 Creating a Point-to-Point Demand
2.3.5 Creating a Protected Ring Demand
2.3.8 Adding Notes to a Project
2.5.1 Viewing the Summary Report
2.5.2 Saving the NE Update File
2.5.3 Viewing the Installation Parameters
2.5.4 Viewing Internal Connections
2.5.5 Viewing the Traffic Matrix Report
2.5.7 Viewing the Link Availability Report
2.5.9 Viewing Wavelength Routing
2.5.10 Viewing Report Differences
2.6.1 Editing Project Parameters
2.6.2 Editing Network Parameters
2.6.5 Creating a Maintenance Center
2.6.6 Editing a Point-to-Point Demand
2.6.9 Deleting a Traffic Demand
2.6.10 Editing Fiber Span Parameters
2.7 Managing the Network Design
2.7.1 Creating a Copy of the Network
2.7.2 Creating a Network in the Install State
2.7.3 Creating an Upgrade Network
2.7.4 Unlocking Parameters in the Network Design
2.8.1 Viewing BoM Report Totals
2.8.2 Generating a Network BoM
2.8.4 Generating a Spare Parts Report
2.9.1 Creating a New Price List
2.9.3 Loading and Unloading Price Lists
2.9.4 Updating a Price List from CCO
2.9.7 Viewing Maintenance Contracts
Designing Networks with Cisco MetroPlanner
Cisco MetroPlanner provides you with numerous tools for customizing the software, creating and analyzing networks, and creating a bill of materials (BoM). You can use Cisco MetroPlanner to perform the following tasks:
•
Launching Cisco MetroPlanner
•
Note
http://java.sun.com/j2se/1.4.2/download.html2.1 Launching Cisco MetroPlanner
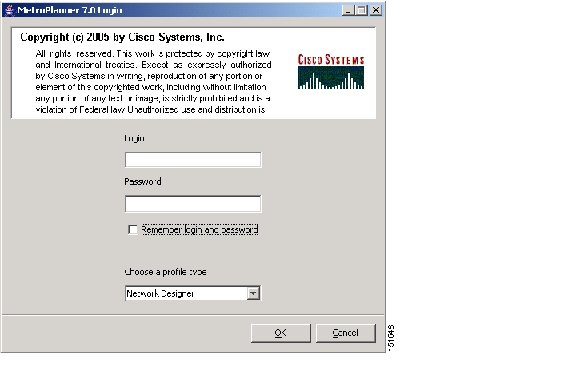
Use the following procedure to launch Cisco MetroPlanner Release 7.0:
Note
Step 1
Figure 2-1 Cisco MetroPlanner 7.0 Login Dialog Box
Step 2
Step 3
Cisco MetroPlanner provides three chances for you to enter the correct password. The first two times you enter an incorrect password, Cisco MetroPlanner displays an "Incorrect Password or Login. Please try again" error message. After a third failed attempt, Cisco MetroPlanner exits with the error message: "Failed to provide correct password or login, exiting application."
Step 4
Step 5
•
•
For more information on profiles and the capabilities they offer, see Table 2-4.
Step 6
2.1.1 Opening a Project
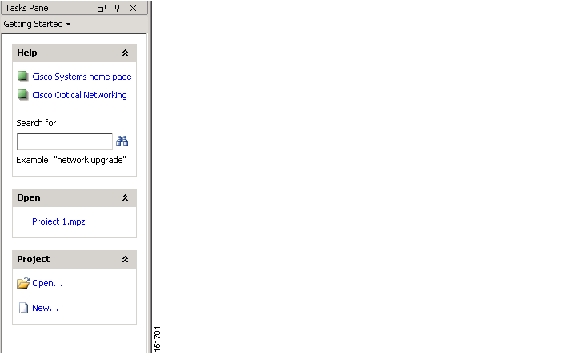
Use the following procedure to open an existing Cisco MetroPlanner project. To create a new project, see the "Creating a Project" section.
Step 1
Step 2
Figure 2-2 Opening a Project from the Tasks Pane
Step 3
2.1.2 Loading and Unloading Networks
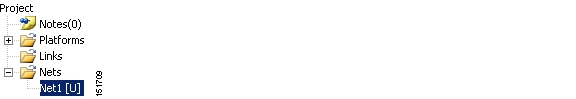
Each network in a project requires memory. To save memory, when Cisco MetroPlanner opens a project, all networks are in the Unloaded state. An unloaded network appears in the Project Explorer with a "U" next to the network identifier ( Figure 2-3). To load an unloaded network, double-click on the network folder in the Project Explorer, or right-click the network and choose Load from the shortcut menu.
Figure 2-3 Unloaded Network in the Project Explorer
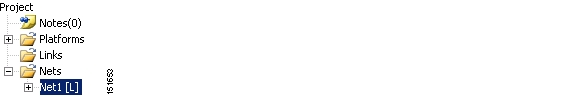
A loaded network appears in the Project Explorer with an "L" next to the network identifier ( Figure 2-4). To unload a loaded network, right-click the network icon in the Project Explorer and choose Unload from the shortcut menu.
Figure 2-4 Loaded Network in the Project Explorer
2.1.3 Saving a Project
Use the following procedure to save a project:
Step 1
•
•
•
Step 2
2.1.4 Importing a Cisco MetroPlanner 2.5 Project
Use the following procedure to import a Cisco MetroPlanner 2.5 project:
Step 1
Step 2
Step 3
2.1.5 Closing a Project
Use the following procedure to close a Cisco MetroPlanner project:
Step 1
Step 2
Step 3
Step 4
2.2 Setting Cisco MetroPlanner Options
Cisco MetroPlanner provides numerous options for customizing the tool and the design.
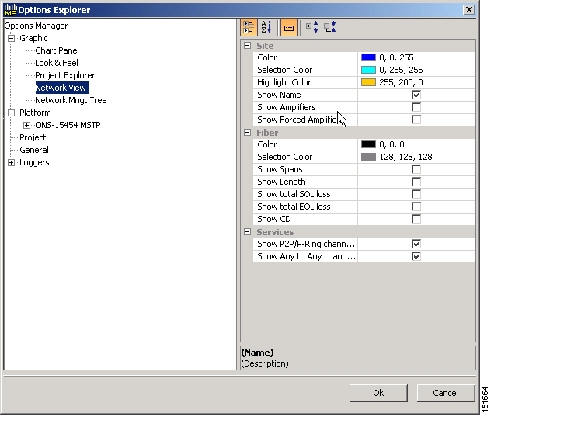
2.2.1 Setting the Graphical Display
Use the following procedure to set the Cisco MetroPlanner graphical display:
Step 1
Step 2
Figure 2-5 Options Explorer Dialog Box
Step 3
Step 4
•
•
•
Step 5
•
–
–
–
–
•
–
–
–
–
–
–
–
•
Figure 2-6 Duct Details Shown on the NtVw Net# Tab
Step 6
•
•
–
–
Step 7
2.2.2 Setting the Default Platform Values
Use the following procedure to establish the default traffic mapping, dense wavelength division multiplexing (DWDM) design, and default layout settings for a particular platform and system release. The default settings will appear during project creation.
Step 1
Step 2
Step 3
•
•
•
•
Step 4
•
•
–
–
–
Step 5
•
•
•
Step 6
•
•
Step 7
2.2.3 Setting the Default Project Values
Use the following procedure to set the default project settings and repair time. These defaults will appear during project creation.
Step 1
Step 2
•
•
•
•
•
Step 3
Step 4
Step 5
2.2.4 Setting the Fiber Type Default Values
Use the following procedure to set the fiber type default values. The changes do not apply to the current project. After setting the values for the fiber types, you must export the database changes to a file and then import the file. For more information, see the "Exporting a File" section and the "Importing a File" section.
Step 1
Note
Step 2
Step 3
•
•
•
•
•
Step 4
Step 5
•
•
•
•
•
•
•
•
•
•
Step 6
Step 7
2.2.5 Defining Third-Party DWDM Interfaces
Cisco MetroPlanner allows you to define a third-party DWDM interface to be used in project creation. Once you define third-pary DWDM interfaces, you can choose them when creating traffic demands.
Note
Use the following procedure to define a third-party DWDM interface:
Step 1
Note
Step 2
Step 3
Step 4
•
•
•
•
Step 5
Step 6
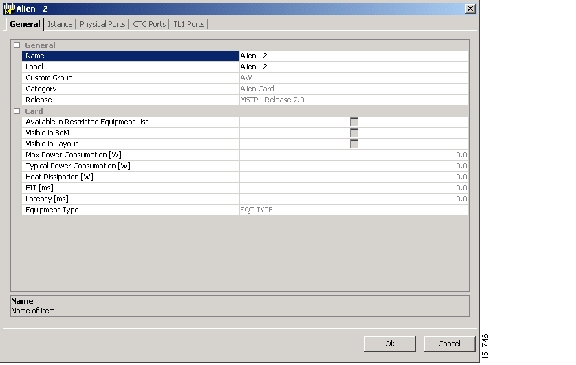
Step 7
Figure 2-7 Alien Card Dialog Box
Step 8
•
•
Step 9
•
•
•
•
•
•
•
Step 10
The CTC Ports and TL1 Ports tabs are not applicable for third-party interfaces.
Step 11
Step 12
Step 13
Step 14
•
•
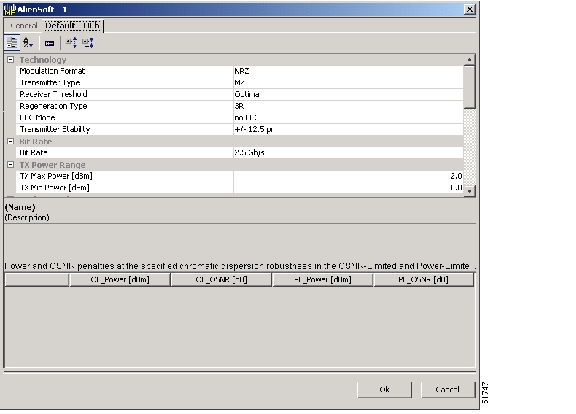
Step 15
Figure 2-8 Alien Software Dialog Box
Step 16
•
•
–
–
–
–
–
–
•
•
–
–
•
–
–
–
–
–
•
–
–
•
•
•
•
–
–
–
–
F-P(PL) and F-OSNR(PL) are evaluated in the PL working region, while F-P(OL) and F-OSNR(OL) are evaluated in the OL working region of the curve with the dispersion margins added.
Figure 2-9 Interface Operative Area
Table 2-1 lists the supported combinations for 40-Gbs third party interfaces.
Table 2-2 lists the supported combinations for 10-Gbs third party interfaces.
Table 2-3 lists the supported combinations for 2.5-Gbs third party interfaces.
Step 17
2.2.6 Updating the Restricted Equipment List
Use the following procedure to modify the restricted equipment list, which contains a list of parts that Cisco MetroPlanner cannot use when designing the network. Restricted equipment list changes apply when you create a new project, however you can also update a current project with the changes.
Step 1
Step 2
Step 3
Step 4
Step 5
Step 6
a.
b.
c.
d.
e.
2.2.7 Exporting a File
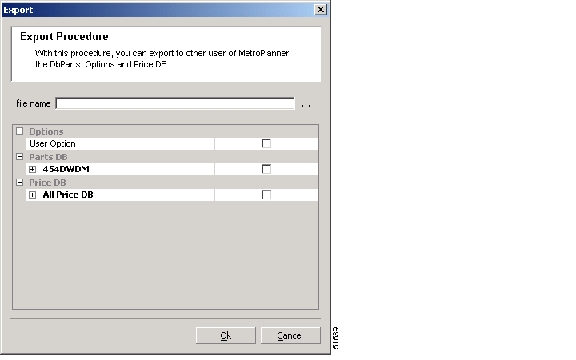
Use the following procedure to export user options, price lists, maintenance contracts, and the parts database files. The Export command creates a ZIP file that includes all of the created files.
Step 1
Figure 2-10 Export Dialog Box
Step 2
Step 3
•
•
•
Step 4
2.2.8 Importing a File
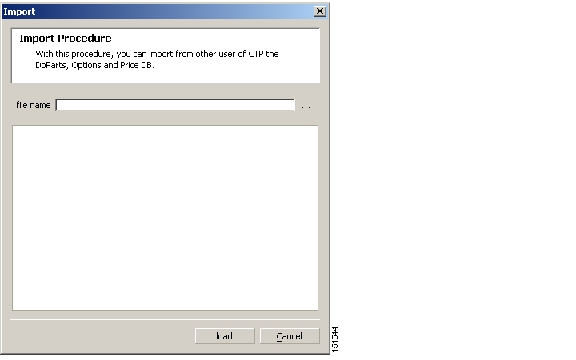
Use the following procedure to import user options, price lists, maintenance contracts, and the parts database files. You can import a ZIP file of multiple exported items or an individual TXT file.
Step 1
Figure 2-11 Import Dialog Box
Step 2
Step 3
Step 4
•
•
•
Step 5
Step 6
2.2.9 Resetting the Default Layout
Your graphical layout settings are saved when you exit Cisco MetroPlanner. The next time that you launch Cisco MetroPlanner, the layout appears as it did upon exiting. The default graphical layout includes items such as whether the panes are visible and/or docked, etc.
To return to the Cisco MetroPlanner default layout, choose Default Layout from the View menu. To restore the user modified layout, choose My Default View from the View menu.
2.2.10 Adding Plug-ins
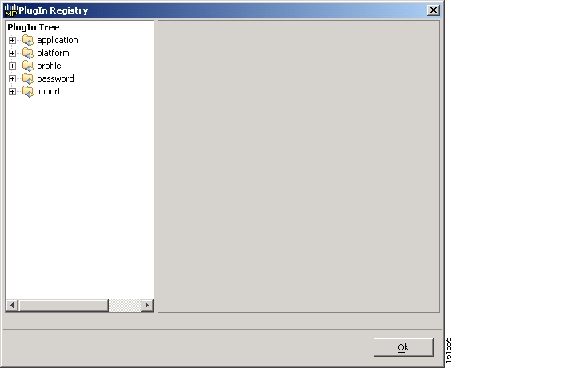
Use the following procedure to add plug-ins to Cisco MetroPlanner. Plug-ins are released separately from Cisco MetroPlanner. Using plug-ins, you can customize the released version of Cisco MetroPlanner.
Step 1
Step 2
Step 3
Step 4
Figure 2-12 PlugIn Registry Dialog Box
Step 5
Step 6
Step 7
Step 8
Step 9
2.2.11 Managing Plug-ins
Use the following procedure to view and manage plug-ins. For information about adding plug-ins, see "Adding Plug-ins" section.
Step 1
Step 2
Step 3
•
–
–
–
–
–
–
•
–
–
–
•
Step 4
•
•
Step 5
Step 6
Step 7
2.2.12 Adding User Profiles
A user profile is a set of privileges used for running Cisco MetroPlanner. Each profile offers different capabilities. Cisco MetroPlanner is packaged with the Network Designer and Base Network Designer profiles, but you can add other user profile types.
Table 2-4 lists the privileges that differ between the Network Designer and the Base Network Designer user profiles. For all other commands and options, the two user profiles have the same privileges.
Use the following procedure to add a user profile to Cisco MetroPlanner:
Step 1
Step 2
2.2.13 Running a Script
Use the following procedure to run a script. A script is a sequence of commands in a BSH file format that is used to provide additional Cisco MetroPlanner capabilities. Cisco provides scripts to help you customize your Cisco MetroPlanner software.
Step 1
Step 2
2.3 Creating a Project
A project consists of a single network or multiple networks that you analyze and compare. In a project, you can have multiple copies of a single network with the same customer input data, but use different options in each to investigate multiple solutions.
Use the following procedure to create a single network in a project. A new network is in the Design state. For more information about the different network states, see the "Managing the Network Design" section.
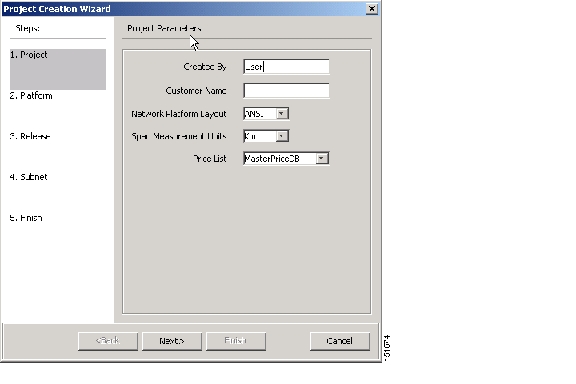
Step 1
Figure 2-13 Project Creation Wizard
Step 2
•
•
•
•
•
Step 3
Step 4
Step 5
Step 6
•
•
•
•
•
•
•
•
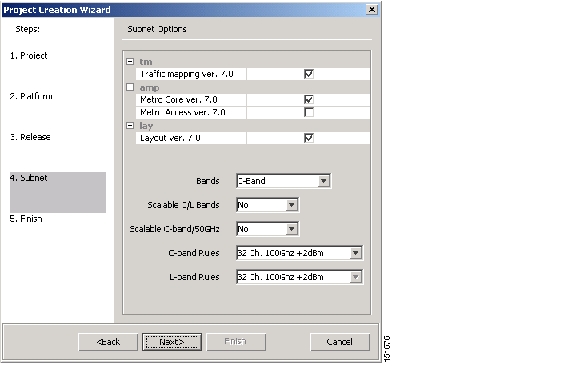
Figure 2-14 Project Creation Wizard Subnet Page
Step 7
Step 8
•
•
Step 9
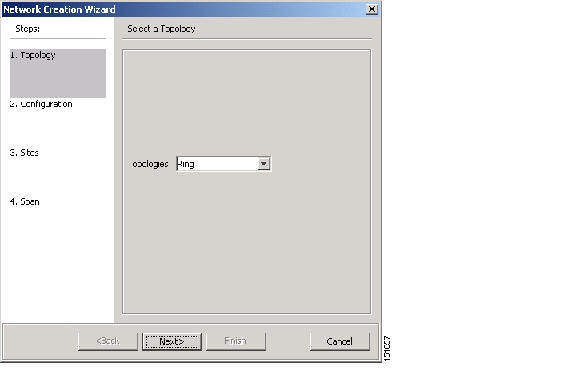
Figure 2-15 Network Creation Wizard Topology Page
Step 10
Step 11
•
–
–
–
•
•
•
•
•
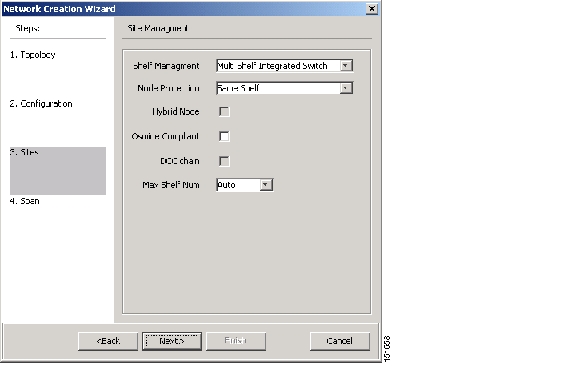
Figure 2-16 Network Creation Wizard Site Management Page
Step 12
Step 13
•
•
•
•
•
Note
•
•
•
•
•
•
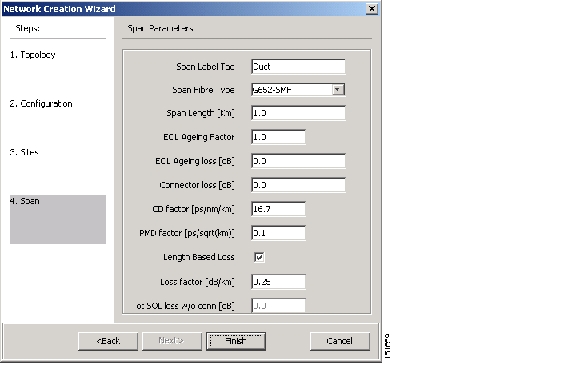
Figure 2-17 Network Creation Wizard Span Parameters Page
Step 14
2.3.1 Adding Sites
Use the following procedure to add new sites to an existing network. A site is a customer premise location where any equipment can be co-located in a rack within a building.
Note
Step 1
Step 2
Step 3
•
•
•
•
Step 4
2.3.2 Deleting Sites
Use the following procedure to delete sites from a network. You can delete a site if the site is in the Unlocked state and does not have a traffic demand set up on it.
Step 1
Step 2
Step 3
2.3.3 Adding Fiber Spans
Use the following procedure to manually add fiber spans between sites. A fiber span consists of a pair of fibers (one transmit and one receive) between two sites. A span is represented by a fiber duct in the NetView Net# tab. Within a fiber duct, more than one fiber pair can exist.
Step 1
Step 2
Step 3
For the first span, the source site is set as East and the destination site is set as West. Cisco MetroPlanner automatically adjusts East and West for additional spans.
2.3.4 Creating a Point-to-Point Demand
Use the following procedure to add a point-to-point traffic demand:
Step 1
Step 2
Step 3
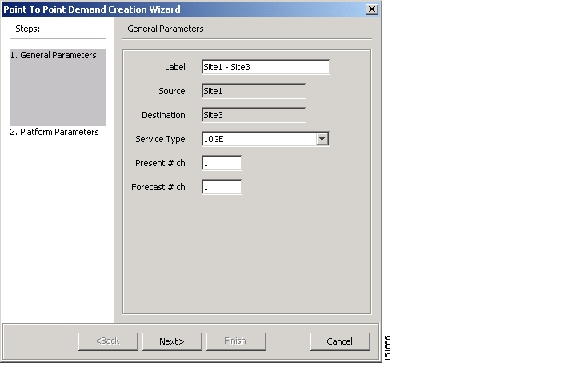
Figure 2-18 Point to Point Demand Creation Wizard
Step 4
•
•
•
•
•
•
Step 5
Step 6
•
•
–
–
–
•
Step 7
•
•
•
•
Step 8
Step 9
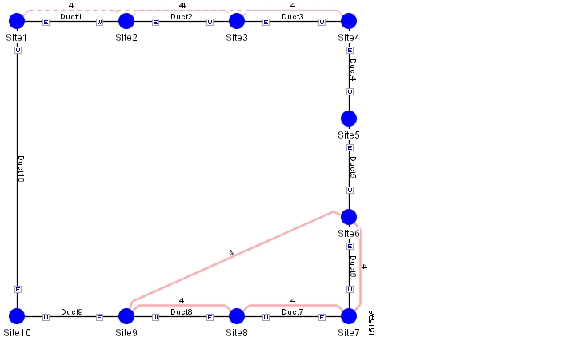
The demand appears in the NtVw Net# tab. A demand is a solid line when selected and a dotted line when not selected. The line has a number above it that indicates the number of channels that are present. Figure 2-19 shows a selected point-to-point demand with five channels between Sites 1 and 2.
Note
Figure 2-19 Point-to-Point Demand Between Two Sites
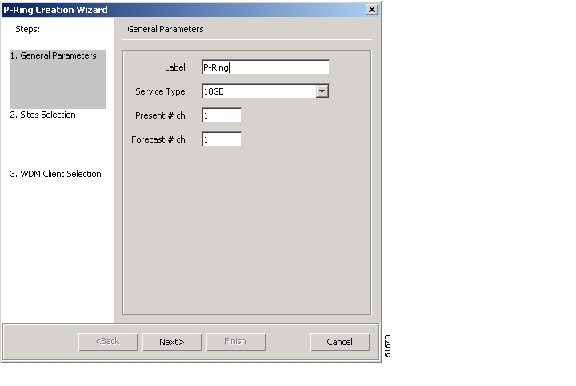
2.3.5 Creating a Protected Ring Demand
Use the following procedure to create a P-ring traffic demand.
Step 1
Step 2
Figure 2-20 P-Ring Creation Wizard
Step 3
•
•
•
•
Step 4
Step 5
Step 6
Step 7
Step 8
•
•
•
•
Step 9
Step 10
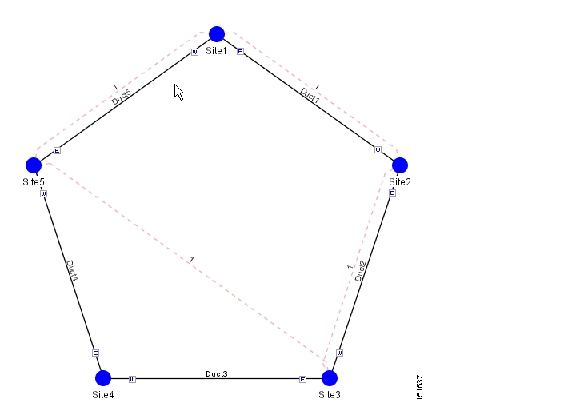
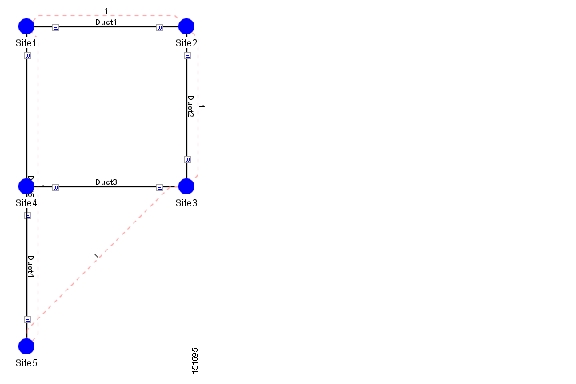
The demand appears in the NtVw Net# tab. A demand is a solid line when selected and a dotted line when not selected. The line has a number above it that indicates the number of channels present. Figure 2-21 shows a selected one-channel P-ring between Sites 1, 2, 3, and 5 with an optical bypass of Site 4.
Note
Figure 2-21 P-Ring Demand
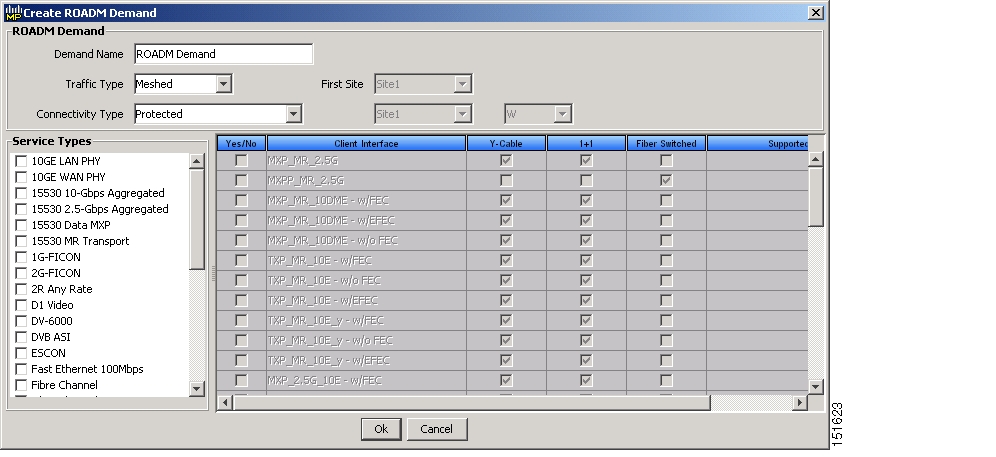
2.3.6 Creating a ROADM Demand
Use the following procedure to create ROADM traffic groups and demands:
Step 1
Step 2
Step 3
Step 4
Step 5
Step 6
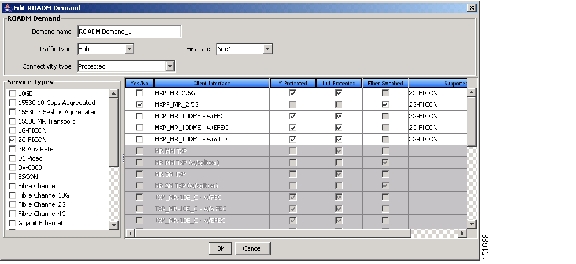
Figure 2-22 Create ROADM Demand Dialog Box
Step 7
Step 8
Step 9
Step 10
Step 11
Step 12
Step 13
•
•
•
•
•
•
You can select more than one client interface to support the same service type. By default, Cisco MetroPlanner checks the best client interface to support each service.
Step 14
2.3.7 Deleting a Network
To delete a network from a project, in the Network Mgmt Tree tab click the network and choose Delete from the Tasks Pane. You cannot delete a network if it is the only network in a project.
2.3.8 Adding Notes to a Project
Use the following procedure to add a note to any item in the Project Explorer. Each network has a Notes folder in the Project Explorer. After you have created a note, it appears in the Notes folder for that particular network.
Step 1
Step 2
Step 3
Step 4
Step 5
2.3.9 Deleting Notes
Use the following procedure to delete a note from any item in the Project Explorer:
Step 1
Step 2
Step 3
2.4 Analyzing the Network
After you have created the desired sites, fiber spans, and service demands, you must analyze the network to determine network performance. The network must be in the Design, Install, or Upgrade state before you can analyze it. Cisco MetroPlanner automatically optimizes the design and summarizes the optical transmission performance. If there are problems with the design, Cisco MetroPlanner lists the problems and descriptions in the Analyzer Messages pane.
Use the following procedure to analyze the network:
Step 1
Step 2
The MetroPlanner analyzer status window appears to indicate the progress. The Cisco MetroPlanner analysis status bar indicates when the network analysis is complete.
Step 3
Step 4
Note
2.5 Viewing Network Reports
Cisco MetroPlanner provides the reports listed in Table 2-7. Report availability depends on whether a network has been analyzed or whether it is in the Install or Upgrade state. Reports are also available by site. See Table 2-7 for report availability details.
For more information on the Bill of Materials report, see the "Generating a BoM" section. In addition, you can compare the following reports using the Reports Diff tool: Bill of Material, Internal Connections, and Installation Parameters.
To complete the procedures in this section, you must have a project open and the network(s) loaded. See the "Opening a Project" section and the "Loading and Unloading Networks" section.
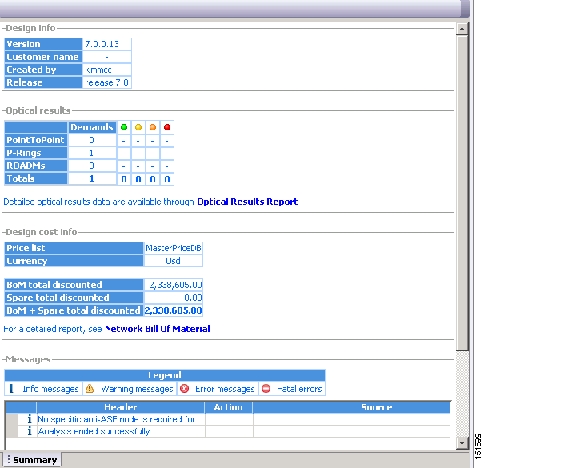
2.5.1 Viewing the Summary Report
The Summary report summarizes design information, optical results, design cost, and analyzer messages. You can view it before or after you analyze a network. It automatically appears when you analyze a network. Use the following procedure to view the report at another time:
Step 1
•
•
Step 2
Figure 2-23 Summary Tab
Table 2-8 lists the categories in the Summary tab and their descriptions.
2.5.2 Saving the NE Update File
After Cisco MetroPlanner calculates the installation parameters, you can create a configuration file in XML format for each site in the network. This file can be directly imported to a site using the NE Update feature in CTC. CTC uses this file to preprovision a node.
Cisco MetroPlanner generates one text file for each site in the network in the Cisco MetroPlanner installation folder. Each file is named with the site name string by default. File data format and the list of reported installation parameters depend on the system release selecteded for the designed network. You generally save this file after you analyze an Install network.
Use the following procedure to save the NE Update file:
Step 1
Step 2
Step 3
Note
Step 4
Step 5
Step 6
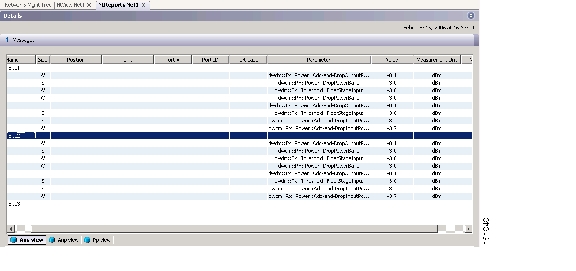
2.5.3 Viewing the Installation Parameters
The Installation Parameters reports shows the values to be set (provisioned) at installation time on each site in the network. These parameters are exported when you save the NE Update file and are used to automatically provision a node using CTC.
Use the following procedure to view the installation parameters after a network has been analyzed:
Step 1
•
•
Step 2
Figure 2-24 ANS View Subtab in the Installation Parameters Tab
Table 2-9 describes the columns on the ANS view tab of the Installation Parameters report.
Step 3
Step 4
Step 5
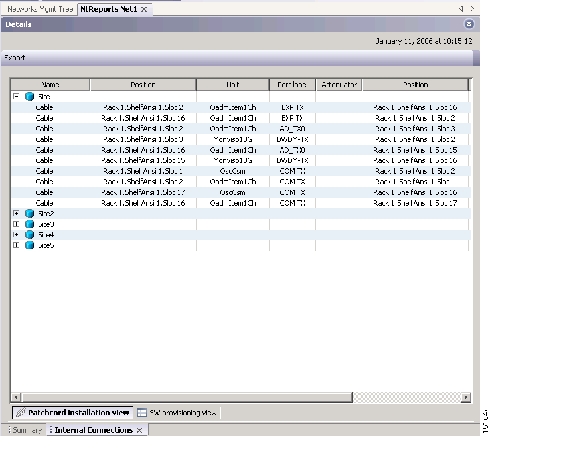
2.5.4 Viewing Internal Connections
Use the following procedure to view the network internal connections after a network has been analyzed.
You can also use this procedure to view the patchcord connections between transponders and the Y-Cable Protection FlexLayer modules. The Y-Cable Protection FlexLayer position is defined using the rack and shelf number. The slots are numbered from left to right on each of the four FlexLayer modules that can be placed in a shelf.
Step 1
Step 2
Figure 2-25 Internal Connections Tab
Table 2-12 lists the columns in the Internal Connections tab and their descriptions. Click a columns to sort the table information by that column.
•
•
Step 3
Step 4
2.5.5 Viewing the Traffic Matrix Report
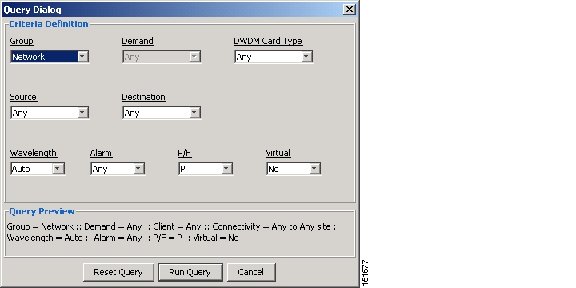
The Traffic Matrix report displays the point-to-point, P-ring, and ROADM channel data. Use the following procedure to view the traffic matrix report:
Step 1
•
•
Step 2
Step 3
Figure 2-26 Query Dialog
Step 4
Step 5
•
•
•
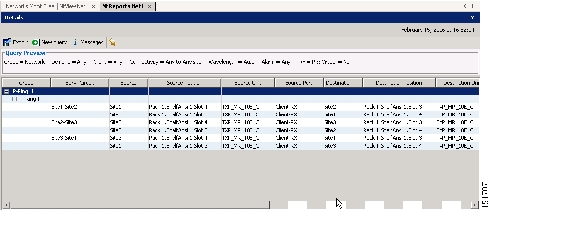
Figure 2-27 Traffic Matrix Tab
Each row in the tab shows the performance of one optical path. Table 2-18 describes the information in the columns. The Traffic Matrix report displays separate rows for the TX and RX direction of the optical channels.
Step 6
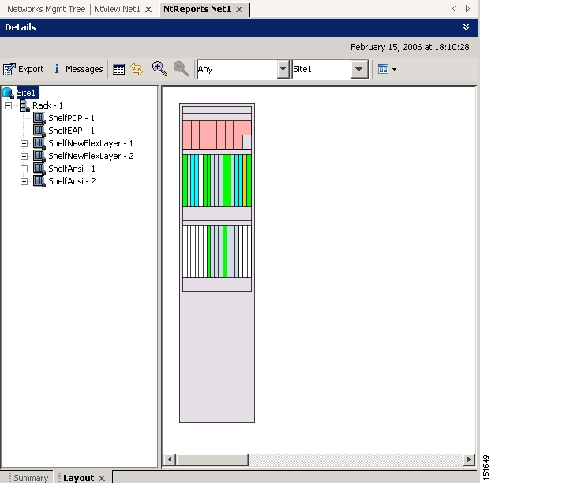
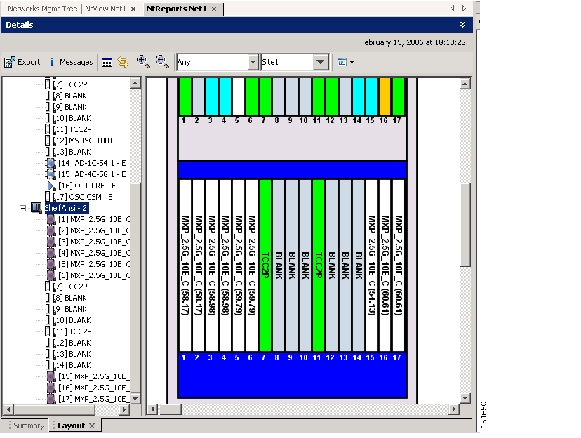
2.5.6 Displaying the Layout
Use the following procedure to view a graphical representation of each site in an analyzed network:
Step 1
•
•
Step 2
Figure 2-28 Layout Report (Rack View)
Step 3
Step 4
Step 5
Figure 2-29 Layout Report (Shelf View)
Step 6
•
•
•
•
•
•
Click Close to close the Details dialog box.
Step 7
•
•
•
•
Step 8
Step 9
Step 10
Step 11
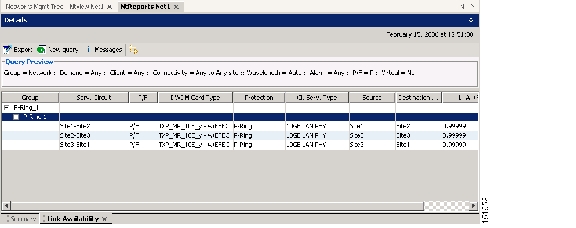
2.5.7 Viewing the Link Availability Report
Cisco MetroPlanner determines link availability based on circuit failure rate and time to repair. Use the following procedure to view the Link Availability report:
Step 1
•
•
Step 2
Step 3
Step 4
Step 5
•
•
•
Figure 2-30 Link Availability Report
Each row in the tab shows the performance of one optical path. Table 2-16 describes the information in the columns.
Step 6
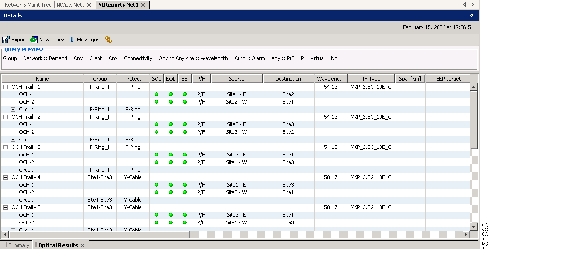
2.5.8 Viewing Optical Results
Use the following procedure to view the optical results of the network that you created and analyzed:
Step 1
•
•
Step 2
Step 3
Step 4
Step 5
•
•
•
Figure 2-31 Optical Results Tab
Each row in the tab shows the performance of one optical path. Table 2-18 describes the information in the columns.
Step 6
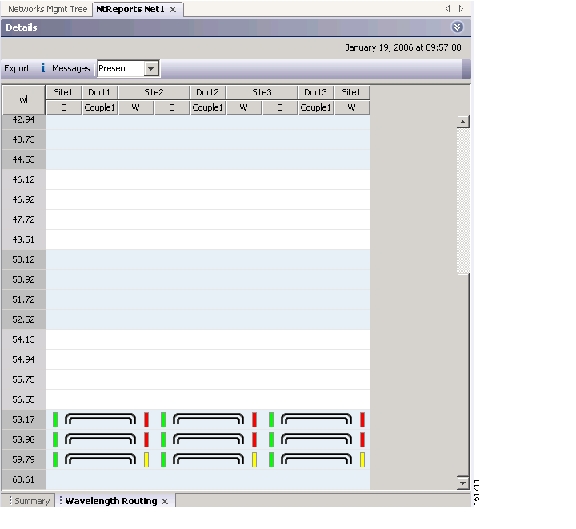
2.5.9 Viewing Wavelength Routing
Use the following procedure to view the wavelength routing map for an analyzed network:
Step 1
Step 2
Figure 2-32 Wavelength Routing Tab
Step 3
Table 2-19 describes the information in the columns.
Step 4
Step 5
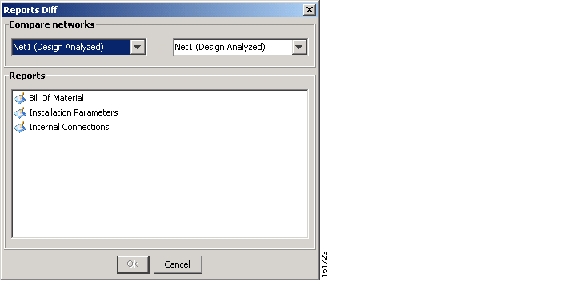
2.5.10 Viewing Report Differences
You can compare the BoM, Internal Connections, and Installation Parameters reports for two networks. This is useful to see the differences between a baseline network and an Install or Upgrade network.
•
•
•
Use the following procedure to compare networks:
Step 1
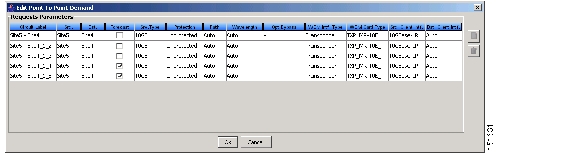
Figure 2-33 Reports Diff Dialog Box
Step 2
Step 3
•
•
•
Step 4
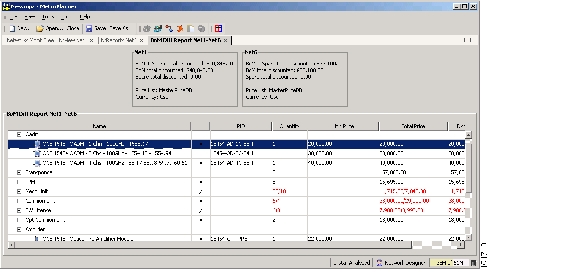
Figure 2-34 shows the BoM Diff report.
Figure 2-34 BOM Diff Report
The upper section of the BoM Diff Report tab displays the following information for each network:
•
•
•
•
•
•
Table 2-20 describes the information in the BoM Diff report columns. Click a column to sort the table information by that column.
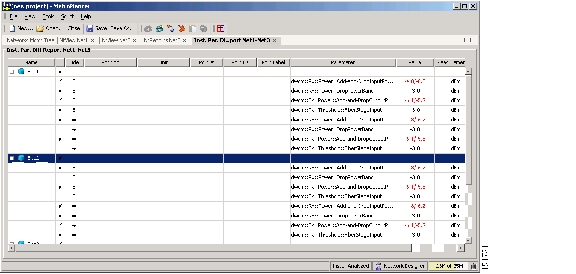
Figure 2-35 shows the Installation Parameters Diff report.
Figure 2-35 Installation Parameters Diff Report
Table 2-21 describes the columns on Installation Parameters Diff report. Click a column to sort the table information by that column.
Differences between networks appear in red and in the following format: baseline network value/final network value.
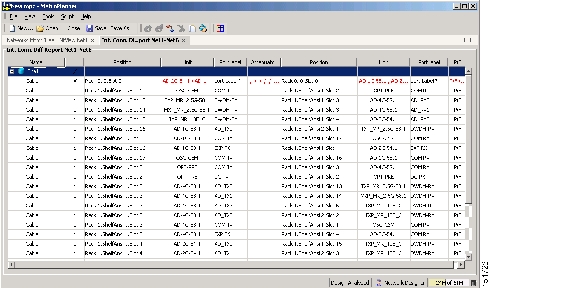
Figure 2-25 shows the Internal Connections Diff report.
Figure 2-36 Internal Connections Diff Report
Table 2-22 lists the columns in the Internal Connections Diff report and their descriptions. Click a column to sort the table information by that column.
Differences between networks appear in red and in the following format: baseline network value/final network value.
2.6 Editing a Project
Cisco MetroPlanner allows you to edit the a project either before or after network analysis. Error messages that occur during network analysis often cannot be resolved until you edit one or more network components.
To complete the procedures in this section, you must have a project open and the network(s) loaded. See the "Opening a Project" section and the "Loading and Unloading Networks" section.
2.6.1 Editing Project Parameters
Use the following procedure to edit project parameters:
Step 1
Step 2
•
•
•
•
•
2.6.2 Editing Network Parameters
Use the following procedure to edit network parameters:
Step 1
Step 2
•
•
•
•
•
•
•
•
•
•
•
•
•
•
•
2.6.3 Editing Site Parameters
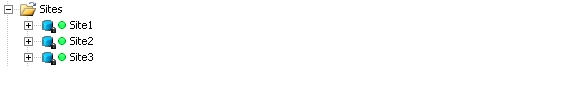
Editing the site parameters allows you to make changes to the current site configuration. A site folder in the Project Explorer displays the interface node information. Figure 2-37 shows a site in the Project Explorer before network analysis.
Figure 2-37 Site in the Project Explorer
A site folder for an analyzed network design also contains the following items, many of which you can edit:
•
•
•
•
•
•
•
Use the following procedure to edit site parameters:
Step 1
Step 2
Step 3
•
•
•
•
–
–
–
–
•
•
•
–
–
–
•
•
•
•
•
•
–
–
–
–
–
–
–
–
•
–
–
–
–
–
–
•
Step 4
Step 5
a.
•
•
•
•
•
b.
•
•
•
c.
Step 6
•
•
–
–
2.6.4 Deleting a Site
Use the following procedure to delete an existing site from the network design:
Step 1
Step 2
Step 3
2.6.5 Creating a Maintenance Center
Use the following procedure to add maintenance centers that will supply your network with spare parts in the event of a failure. This feature helps your customer determine the quantity of spares that should be purchased, depending on the number of maintenance centers and their availability. Maintenance centers appear in the Maintenance Center folder under a site in the Project Explorer.
Step 1
Step 2
Step 3
Step 4
•
•
Step 5
2.6.6 Editing a Point-to-Point Demand
Use the following procedure to edit a point-to-point demand:
Step 1
Step 2
Figure 2-38 Edit Point to Point Demand Dialog Box
Step 3
•
•
•
•
•
•
•
•
•
•
Step 4
Step 5
Step 6
2.6.7 Editing a P-Ring Demand
Use the following procedure to change the distribution of services in a P-ring service demand:
Step 1
Step 2
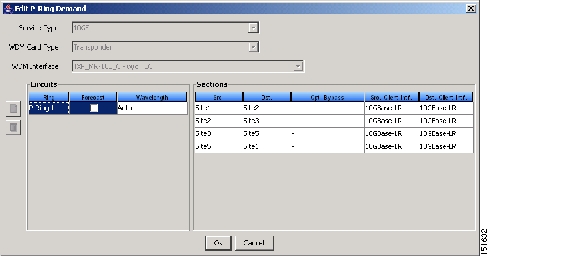
Figure 2-39 Edit P-Ring Demand Dialog Box
Step 3
•
•
•
In the Circuits area of the Edit P-Ring Demand dialog box, complete the following as needed:
•
•
•
In the Sections area of the Edit P-Ring Demand dialog box, complete the following as needed:
•
•
•
•
•
Step 4
Step 5
Step 6
2.6.8 Editing a ROADM Demand
Use the following procedure to change the distribution of services in a ROADM service demand:
Step 1
Step 2
Figure 2-40 Edit ROADM Demand Dialog Box
Step 3
Step 4
Step 5
Step 6
Step 7
•
•
•
•
•
•
You can select more than one client interface to support the same service type. By default, Cisco MetroPlanner checks the best client interface to support each service.
Step 8
2.6.9 Deleting a Traffic Demand
A traffic demand must be in the Unlocked state before you can delete it. Use the following procedure to delete a traffic demand:
Step 1
Step 2
Step 3
2.6.10 Editing Fiber Span Parameters
Using the Properties pane, you can manage a fiber span, a fiber pair, and individual fibers. A fiber pair consists of two different fibers (clockwise and counter-clockwise). Table 2-24 lists the properties that you can modify for a fiber span, pair, or fiber.
Use the following procedure to edit fiber span parameters:
Step 1
Step 2
•
•
•
Step 3
•
•
•
•
•
•
•
•
•
•
•
•
Step 4
•
Note
•
•
•
2.6.11 Deleting a Fiber Span
Use the following procedure to delete a fiber span from the network design:
Step 1
Step 2
Step 3
2.6.12 Arranging Sites
Sites can be arranged into four different configurations. Use the following procedure to arrange the sites into a configuration or to move all of the sites so that they appear in the Cisco MetroPlanner window:
Step 1
Step 2
•
•
Figure 2-41 Ellipse Shape
•
Figure 2-42 Square Shape
•
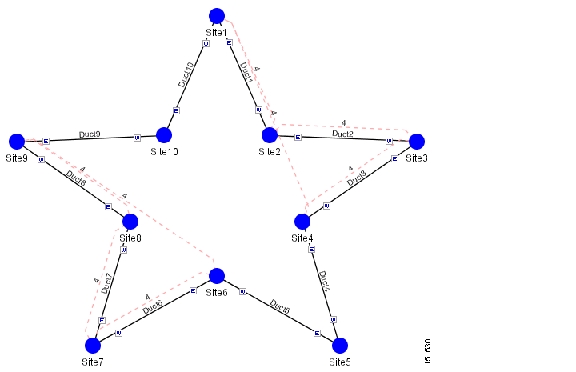
Figure 2-43 Snake Shape
•
Figure 2-44 Double Ring Shape
2.7 Managing the Network Design
After creating and analyzing a network design, you must prepare the design for installation at a customer site. After a network has been installed, you can reanalyze to correct any problems.
Network designs have several possible states:
•
•
•
•
•
•
•
To complete the procedures in this section, you must have a project open and the network(s) loaded. See the "Opening a Project" section and the "Loading and Unloading Networks" section.
2.7.1 Creating a Copy of the Network
To create a copy of a network in any state, right-click the network and choose Copy from the shortcut menu. A new copy appears in the Network Mgmt Tree tab.
2.7.2 Creating a Network in the Install State
Use the following procedure to create a network in the Install state:
Step 1
Step 2
Step 3
Step 4
Step 5
Note
Step 6
2.7.3 Creating an Upgrade Network
In an Upgrade network, you can perform the following tasks:
•
•
•
•
•
•
In an Upgrade network, you can force certain installation parameters:
•
•
•
•
You cannot change the following parameters when in Upgrade state:
•
•
•
•
•
•
Use the following procedure to put a network in the Upgrade state:
Step 1
Step 2
Step 3
Step 4
Step 5
Note
2.7.4 Unlocking Parameters in the Network Design
The Locked state occurs when you did not set (force) any value for a parameter and instead chose Auto. During network analysis, Cisco MetroPlanner assigns a value for each parameter set with Auto and puts them in the Locked state. The Locked state indicates that the next time the network is analyzed, the analyzer cannot change the value. Locking a site forces the presence or absence of all preamplifiers, boosters, add/drop filters, and DCU cards required by the site/network as a result of running the analyzer previously. Locked elements are indicated by a closed padlock icon in the Project Explorer ( Figure 2-45).
Figure 2-45 Locked Sites in the Project Explorer View
To unlock network components to edit parameters, right-click the desired element in the Project Explorer and choose Unlock from the shortcut menu.
2.8 Generating a BoM
You can generate a BoM when a network is in the Install or Upgrade state, or after you have successfully analyzed your network design. The price database selected during project creation is used to generate the BoM.
To complete the procedures in this section, you must have a project open and the network(s) loaded. See the "Opening a Project" section and the "Loading and Unloading Networks" section.
2.8.1 Viewing BoM Report Totals
Use the following procedure to view the BoM report totals:
Step 1
Step 2
The upper section of the BoM tab (in the Net view, Site view, and Spare subtabs) displays the following information:
•
•
•
•
•
•
Step 3
Step 4
Step 5
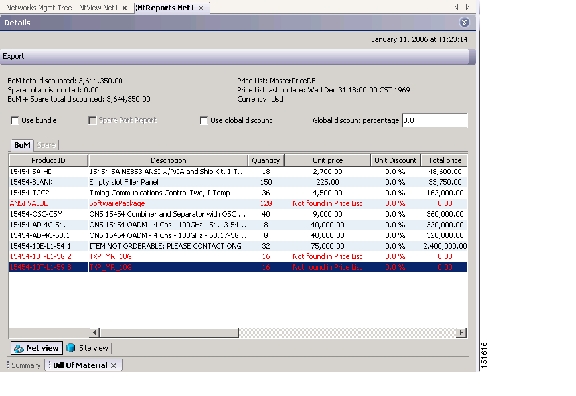
2.8.2 Generating a Network BoM
Use the following procedure to generate a BoM for the network:
Step 1
Step 2
Figure 2-46 Bill of Material Tab, Net View Subtab
Table 2-25 describes the Net view subtab columns. See the "Viewing BoM Report Totals" section for for a description of the data, check boxes, and fields at the top of the window.
Step 3
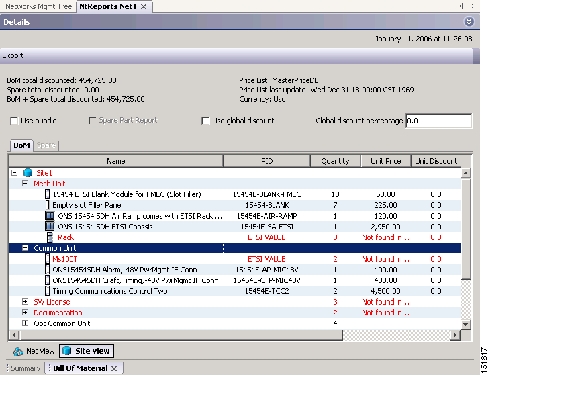
2.8.3 Generating a Site BoM
A site BoM lists all of the hardware and software parts required for the system to work as designed at a given site. Use the following procedure to generate a BoM for a site:
Step 1
Step 2
Figure 2-47 Bill of Material Tab, Site View Subtab
Table 2-26 describes the Site view subtab columns. See the "Viewing BoM Report Totals" section for for a description of the data, check boxes, and fields at the top of the window.
Step 3
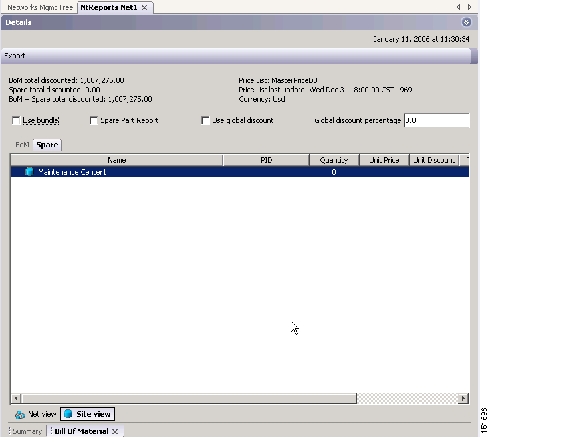
2.8.4 Generating a Spare Parts Report
After you generate the BoM, use the following procedure to determine the spare parts required by the network. If the network is in the Upgrade state, the report includes the parts required to support the implemented services and the new additional present services. To generate a spare parts report, you must associate a site with a maintenance center before network analysis. For more information, see the "Editing Site Parameters" section.
Step 1
Step 2
Figure 2-48 Bill of Material Tab, Spare Subtab
Table 2-27 describes the Spare subtab columns. See the "Viewing BoM Report Totals" section for for a description of the data, check boxes, and fields at the top of the window.
Step 3
2.8.5 Exporting a BoM
Use the following procedure to export the BoM to an external file in XML, Excel spreadsheet, HTML, or text format:
Step 1
Step 2
Step 3
Step 4
2.9 Managing the Price List
A price list is defined for each project and is used to generate a BoM. Cisco MetroPlanner can manage multiple price lists. You can even change a project price list after a project has been established. The Master Price list is the Global Price List in US dollars. You can download new price lists from Cisco Connection Online (CCO).
Only the selected price value is saved with a project; the actual price database is not saved with the project. When opening a saved project (for example, a project received from another designer), the associated price database might not be available. If this is the case, Cisco MetroPlanner notifies you that the Master Price list will be used.
To save memory, Cisco MetroPlanner automatically loads only the price list selected for the current project.
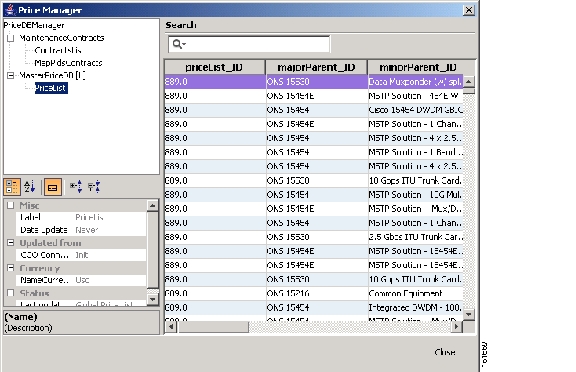
2.9.1 Creating a New Price List
Use the following procedure to download a price list from CCO:
Step 1
Figure 2-49 Price Manager Dialog Box
Step 2
Step 3
Step 4
Step 5
Step 6
Step 7
Step 8
Step 9
2.9.2 Viewing a Price List
Use the following procedure to view and filter a price list:
Step 1
The PriceDB Manager tree lists all of the created price lists. To save memory, Cisco MetroPlanner automatically loads only the price list selected for the current project (unless the user requests otherwise). An L indicates that the price list is loaded in memory and is available. A U indicates that a price list is currently not loaded in memory and is not available.
Step 2
Step 3
•
•
•
•
The price list displays the following columns:
•
•
•
•
•
•
•
•
•
•
–
–
–
–
•
Step 4
•
•
•
•
•
Step 5
Step 6
2.9.3 Loading and Unloading Price Lists
To save memory, Cisco MetroPlanner automatically loads only the price list selected for the current project. An "L" by a price list in the Price Manager dialog box indicates that the price list is loaded; a "U" in the Price Manager dialog box indicates that the price list is not loaded. Use the following procedure to load or unload price lists in Cisco MetroPlanner:
Step 1
Step 2
2.9.4 Updating a Price List from CCO
Use the following procedure to update a specified price list from CCO or from a local file. You can also update all price lists, even the lists that are not currently loaded.
Step 1
Step 2
Step 3
Step 4
Step 5
Step 6
Step 7
2.9.5 Copying a Price List
Use the following procedure to create a new price list by copying from an existing one. The new price list will have all of the attributes and values of the original price list (such as Updated By, Last Update, unit price, discounts, etc.).
Step 1
Step 2
Step 3
Step 4
2.9.6 Deleting a Price List
Use the following procedure to delete a price list. You cannot delete the Master Price List or a price list that is in use by a project.
Step 1
Step 2
Step 3
2.9.7 Viewing Maintenance Contracts
Use the following procedure to view maintenance contracts:
Step 1
Step 2
Step 3
Step 4
Step 5
![]()
![]()
![]()
![]()
![]()
![]()
![]()
![]()
Posted: Wed Jun 21 00:21:28 PDT 2006
All contents are Copyright © 1992--2006 Cisco Systems, Inc. All rights reserved.
Important Notices and Privacy Statement.