|
|

This chapter describes how to view system-level alarms for the Cisco ONS 15200 network using the Maintenance Manager application, including alarms specific to the selected Client Layer Interface Port (CLIP) module, all alarms recorded by the system, and all events recorded by the system.
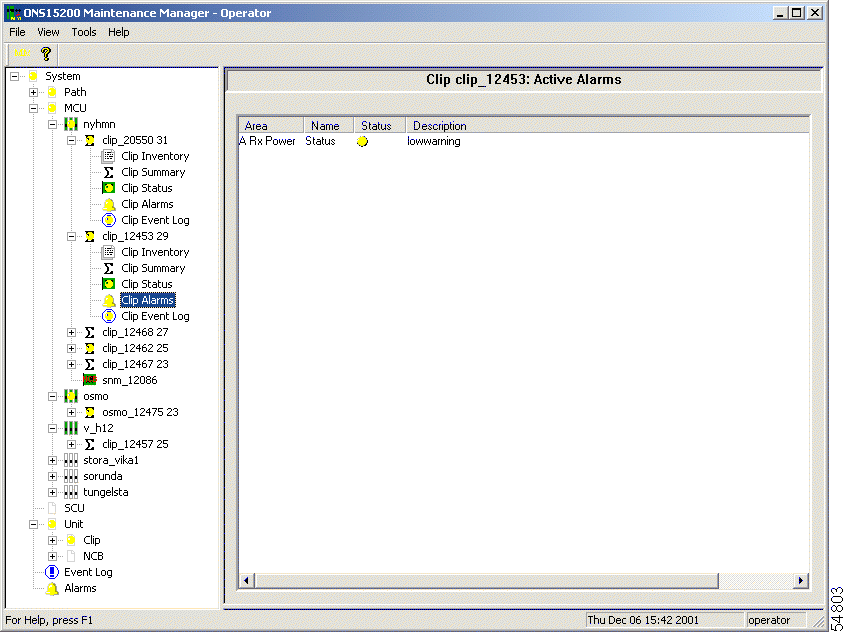
The Clip Active Alarms screen provides a list of active alarms for the selected CLIP module (Figure 4-1). This screen has four columns: Area, Name, Status, and Description. Table 4-1 describes each of the columns on the Clip Active Alarms screen and lists the possible values.
| Parameter | Definition |
|---|---|
Area | Displays the label under which the alarm occurs. In most cases this is the name of the parameter that generated the alarm. |
Name | Displays the type of alarm. |
Status | Displays the severity of the alarm:
|
Description | Displays the system descriptor for the alarm:
|

Table 4-2 describes the alarms that could appear in the Name column.
| Alarm Name (Area) | Definition | Alarm Type (Name) |
|---|---|---|
DWDM_ARXPOWER (protected channels only) | Indicates that the power input from the A-side of the ONS 15200 network is outside the acceptable power range. | Status |
DWDM_BRXPOWER (protected channels only) | Indicates that the power input from the B-side ONS 15200 network is outside the acceptable power range. | Status |
DWDM_RXPOWER (non-protected channels only) | Indicates that the power input from the ONS 15200 network is outside the acceptable power range. | Status |
DWDM_PELTIERCURRENT | Indicates that the Peltier current of the selected CLIP module is outside the acceptable power range. | Status |
DWDM_LASERTEMP | Indicates that the temperature of the laser transmitting to the ONS 15200 network is outside the acceptable temperature range. | Status |
CLIENT_RXPOWER | Indicates that the power input from the client equipment is outside the acceptable power range. | Status |
CLIENT_LASERTEMP | Indicates that the temperature of the laser transmitting to the client equipment is outside the acceptable temperature range. | Status |
CLIENT_LASERBIAS | Displays the value of the current component added to the modulation current in order to obtain a proper operating point for the laser. | — |
DWDM_LASERBIAS | Displays the value of the current component added to the modulation current in order to obtain a proper operating point for the laser. | — |
ENVIRON_BOARDTEMP | Indicates that the temperature on the surface of the CLIP module circuit board is outside the acceptable temperature range. | Status |
QPPA (protected channels only) | Indicates an error on the internal datacom link on the A side of the network. | — |
QPPB (protected channels only) | Indicates an error on the internal datacom link on the B side of the network. | — |
QPP (non-protected channels only) | Indicates an error on the network's internal datacom link. | — |
CAN | Indicates an error on the Control Area Network (CAN) bus. | — |
POWER1 | Indicates that the primary power input is outside the acceptable range. | Status |
POWER2 | Indicates that the secondary power input is outside the acceptable range. | Status |
Table 4-3 describes the alarm status parameters.
| Icon | Definition |
|---|---|
Yellow | Minor alarm or warning |
Red | Critical or Major alarm |
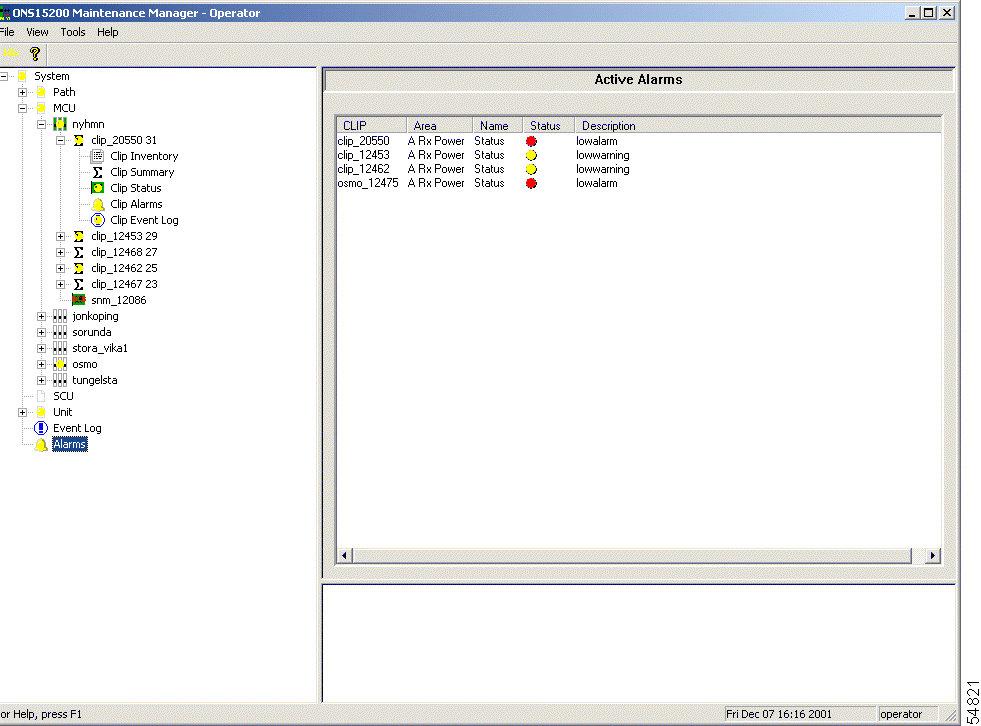
The System Active Alarms screen (Figure 4-2) displays alarms recorded for all modules installed on the network. The System Active Alarms screen has five columns: CLIP, Area, Name, Status, and Description. Table 4-4 describes the columns on the System Active Alarms screen and lists the possible values.

| Parameter | Definition |
|---|---|
CLIP | Displays the serial number of the CLIP module that generated the alarm. |
Area | Displays the label where the alarm occurs. In most cases this is the name of the parameter that generated the alarm. |
Name | Displays the type of alarm. |
Status | Displays the severity of the alarm:
|
Description | Displays the system descriptor for the alarm:
|
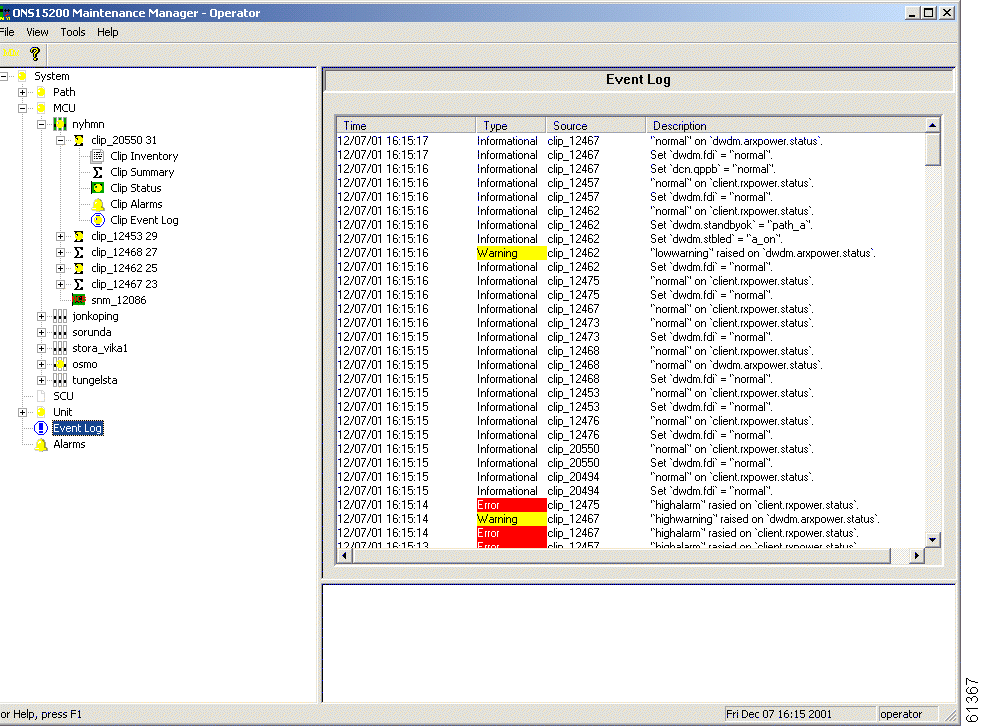
The system Event Log displays a list of events that have occurred in all modules included in the system (Figure 4-3).

The Message Handler Log displays error messages generated by the system (Figure 4-4). The Message Handler Log opens automatically when the Maintenance Manager program is launched.

![]()
![]()
![]()
![]()
![]()
![]()
![]()
![]()
Posted: Mon Jan 7 02:45:01 PST 2002
All contents are Copyright © 1992--2002 Cisco Systems, Inc. All rights reserved.
Important Notices and Privacy Statement.