|
|

The Cisco 6400 SCM Element Manager adds custom windows to the standard Cisco Element Manager Framework (EMF) system to improve management of the Cisco 6400 Universal Access Concentrator (UAC). For example, the Cisco 6400 Chassis Management window has four tabbed sections:
Each tab displays specific information about the current state of the system or allows you to change various settings on a Cisco 6400 UAC without using Cisco IOS commands. Multiple Element Managers can be installed on a single Cisco EMF server, therefore allowing multidevice management from a single system.
This chapter describes the Element Manager windows that appear in the Cisco 6400 Service Connection Manager (SCM). The Element Manager windows provide:
Each Element Management window consists of one or more tabs that display information or that allows you to configure the Cisco 6400 UAC hardware. A number of the Element Manager windows have a similar layout in terms of management functions. For example, the first tab across a number of the Element Manager windows displays fault information that can be used for troubleshooting problems that arise.
Table 5-1 displays the Element Manager windows that can be launched from each node or object type. For example, to manage the Cisco 6400 chassis, choose a relevant Manager, Site, Chassis, or NSP object, and right-click Cisco 6400 UAC > Manage > Chassis option.
 |
Note Cisco 6400 SCM also supports the NRP2 module. Unless otherwise noted, the NRP and NRP2 operate similarly. However, the NSP provides the following functions for the NRP2: image and file storage, system logging, console and Telnet access, and SNMPv3Proxy Forwarder. The NRP2 has no local image or file storage. The NSP stores the NRP2 images, system configuration files, ROM state information, and crash information on the PCMCIA disk on the NSP. The PCMCIA disk must be located in the NSP disk slot 0. |
| Objects (that can be selected) to Open the Window | |||||||||
| Cisco 6400 Element Manager Window/Task | Site | Shelf | Chassis | NSP | NRP | NRP ATM Port | Node Line Card (NLC) | Line Card ATM Port | Menu Options to Select to Open Window |
Cisco 6400 Chassis Management | Yes | Yes | Yes | No | No | No | No | No | Cisco 6400 UAC, Chassis, Manage, Chassis |
Capacity Monitoring | Yes | Yes | Yes | No | No | No | No | No | Cisco 6400 UAC, Chassis, Manage, PVC Usage |
SNMP Management | Yes | No | Yes | No | No | No | No | No | Cisco 6400 UAC, Chassis, Manage, SNMP Management |
Chassis Configuration | Yes | No | Yes | No | No | No | No | No | Cisco 6400 UAC, Chassis, Manage, Configuration |
Module Configuration | Yes | No | Yes | Yes | Yes | No | Yes | No | Cisco 6400 UAC, Module, Manage, Configuration |
Interface Configuration | Yes | No | Yes | Yes | Yes | Yes | Yes | Yes | Cisco 6400 UAC, Port, Manage, Configuration |
Cisco 6400 NSP Management | Yes | Yes | Yes | Yes | No | No | No | No | Cisco 6400 UAC, Module, Manage, NSP |
Cisco 6400 NRP Management | Yes | Yes | Yes | Yes | Yes | No | No | No | Cisco 6400 UAC, Module, Manage, NRP |
SSG Configuration | Yes | Yes | Yes | Yes | Yes | No | No | No | Cisco 6400 UAC, Module, Manage, SSG Configuration |
Cisco 6400 NRP Capacity Statistics | Yes | Yes | Yes | Yes | Yes | No | No | No | Cisco 6400 UAC, Module, Manage, NRP Capacity Statistics |
Cisco 6400 NRP ATM Port Management | Yes | Yes | Yes | Yes | Yes | Yes | No | Yes | Cisco 6400 UAC, Port, Manage, NRP ATM Port
|
| Objects (that can be selected) to Open the Window | |||||||||
| Cisco 6400 Element Manager Window/Task | Site | Shelf | Chassis | NSP | NRP | NRP ATM Port | Node Line Card (NLC) | Line Card ATM Port | Menu Options to Select to Open Window |
Cisco 6400 Line Card Management | Yes | Yes | Yes | Yes | No | No | Yes | No | Cisco 6400 UAC, Module, Manage, NLC |
Cisco 6400 Line Card ATM Port Management | Yes | Yes | Yes | Yes | No | No | Yes | Yes | Cisco 6400 UAC, Port, Manage, NLC ATM Port |
OAM Loopback | No | No | Yes | No | No | No | No | Yes | Cisco 6400 UAC, Port, Manage, Cisco OAMLoopback |
SONET APS | Yes | Yes | Yes | Yes | No | No | No | Yes | Cisco 6400 UAC, Port, Manage, SONET APS |
Module Performance | Yes | No | Yes | Yes | Yes | No | No | Yes | Cisco 6400 UAC, Module, Manage, Performance |
Interface Performance | Yes | No | Yes | Yes | Yes | Yes | Yes | Yes | Cisco 6400 UAC, Port, Manage, Performance |
Interface Status | Yes | No | Yes | Yes | Yes | Yes | Yes | Yes | Cisco 6400 UAC, Port, Manage, Status |
Command Log | Yes | No | Yes | Yes | Yes | No | No | No | Cisco 6400 UAC, Module, View, Command Log |
SysLog Message | Yes | No | Yes | Yes | NRP Yes NPR2 throughNSP | No | No | No | Cisco 6400 UAC, Module, View, System Log |
Management Information | Yes | Yes | Yes | No | No | No | No | No | Cisco 6400 UAC, Chassis or Module, Admin, Management Information |
IOS Image Download | Yes | No | Yes | Yes | NRP Yes NPR2 throughNSP | No | No | No | Cisco 6400 UAC, Module, Admin, IOS Image Download |
Configuration Backup/Restore | Yes | No | Yes | Yes | NRP Yes NPR2 throughNSP | No | No | No | Cisco 6400 UAC, Module, Admin, Configuration Backup/Restore |
Service Uplink Bandwidth Utilization | Launch from an appropriate Service Uplink object. | Cisco 6400 UAC, Subscriber Bandwidth Utilization
| |||||||
| Objects (that can be selected) to Open the Window | |||||||||
| Cisco 6400 Element Manager Window/Task | Site | Shelf | Chassis | NSP | NRP | NRP ATM Port | Node Line Card (NLC) | Line Card ATM Port | Menu Options to Select to Open Window |
Service, Subscriber Connection Bandwidth Utilization | Launch from an appropriate Connection object. | Cisco 6400 UAC, Bandwidth Utilization | |||||||
Telnet Session | No | No | Yes | Yes | NRP Yes NRP2 | Yes | Yes | Yes | Cisco 6400 UAC, Tools, Initiate Telnet Service |
Launch WebConsole | No | No | Yes | Yes | NRP Yes NRP2 | Yes | Yes | Yes | Cisco 6400 UAC, Tools, Launch Web Console |
This section identifies the:
This section is divided into a number of topics (for example, Fault Information, Status Information, and Configuration and Commissioning, Decommissioning). Each section provides a table that details the relevant chassis components, the Element Manager window you launch to view the appropriate window, and a pointer to the relevant section in this user guide for further details.
The Cisco 6400 SCM software allows you to configure and commission or decommission the components within a selected Cisco 6400 chassis. Table 5-2 details each of the Cisco 6400 UAC components that you can configure, the Element Manager window that you should open, and details of the tasks that you can perform. Table 5-1 details how to open each of the Element Manager windows.
Each module (that is, NSP, NRP, NRP2, or NLC) has a module management window where additional module configuration can be carried out either before or after commissioning the selected module. For example, you might want to configure parameters in the Cisco 6400 Line Card Management window before commissioning the NLC module using the Module Configuration window.
Each port interface (that is, NSP, NRP, NRP2, or NLC) has a port management window where you can perform additional port interface configuration either before or after commissioning the selected port interface. For example, you might want to configure parameters in the Cisco 6400 Line Card ATM Port Management window before commissioning the NLC interface port using the Interface Configuration window.
| Cisco 6400 UAC Component | Element Manager Window | Tasks | For Further Information |
Chassis | Cisco 6400 Chassis Management (Configuration tab) | Chassis, clock, alarm, temperature threshold, and power supply configuration. | |
Chassis Configuration (Configuration tab) | Validation parameters, clock and power supply configuration. Click Commission or Decommission to initiate subchassis discovery. Click Start to begin global performance logging. | ||
Chassis Configuration (Additional Descriptions tab) | Enter additional descriptions for identification purposes (for example, CLLI codes could be entered). | ||
Management Information | Configure system configuration and IOS/command line security information. | ||
NSP | Cisco 6400 NSP Management (Configuration tab) | System configuration, CLI password. | |
NRP and NRP2 | Cisco 6400 NRP Management (Configuration tab) | System configuration, CLI password. | |
NSP, NRP, and NRP2, or NLC | Module Configuration (Configuration tab) | Enter additional descriptions for the selected NSP, NRP, or NLC module for identification purposes (for example, CLLI codes could be entered). Commission or Decommission the selected NSP, NRP, or NLC module. | |
| |||
| Cisco 6400 UAC Component | Element Manager Window | Tasks | For Further Information |
SSG | Cisco 6400 SSG Configuration (SSG Configuration tab) | SSG, Layer 3 parameters, and local radius parameters. Configure or deconfigure the selected NRP-SSG parameters. | |
Cisco 6400 SSG Configuration (PPPoA Configuration tab) | PPPoA virtual template and PPPoA IP address pool. Configure or deconfigure the PPPoA parameters. | ||
Cisco 6400 SSG Configuration (PPPoA Configuration tab) | PPPoE virtual template and PPPoE IP address pool. Configure or deconfigure the PPPoE parameters. | ||
NRP ATM Port | Cisco 6400 NRP ATM Port Management (Configuration tab) | ATM port configuration and ILMI configuration | See the "Cisco 6400 NRP ATM Port Management Window" section. |
Cisco 6400 NRP ATM Port Management (More Configuration tab) | Information element transfer. | ||
NLC | Cisco 6400 Line Card Management (Line Card tab) | Configure administration status. | |
NLC ATM Port | Cisco 6400 Line Card ATM Port Management (Configuration tab) | ATM port configuration and ILMI configuration. | See the "Cisco 6400 Line Card ATM Port Management Window" section. |
Cisco 6400 Line Card ATM Port Management (More Configuration tab) | Information element transfer, general physical layer configuration, and DS1/E1/DS3/E3 physical layer configuration. | ||
Cisco Operation, Administration, and Maintenance Loopback (OAM Configuration tab) | Configure OAM loopback test parameters. | See the "Cisco Operation, Administration, and Maintenance Loopback Window" section. | |
Cisco Operation, Administration, and Maintenance Loopback (OAM Status tab) | View the results of an OAM loopback test. | ||
| Cisco 6400 UAC Component | Element Manager Window | Tasks | For Further Information |
NLC ATM Port (SONET APS) | SONET APS (Configuration tab) | Mode, BER threshold, and Switch command. | |
NSP, NRP, and NLC Interface Ports | Interface Configuration | Alias, administration status, link up/down trap enable, and supplementary information. Commission or decommission the selected NSP, NRP, or NLC port interface. |
The Cisco 6400 SCM software monitors and displays NSP and NRP system log messages. Table 5-3 details the information displayed on the Configuration Backup/Restore window. Table 5-1 details how to open the Configuration Backup/Restore window.
| Cisco 6400 UAC Component | Element Manager Window | Information Displayed | For Further Information |
Chassis, NSP, and NRP | Backup/Restore (Backup/Restore tab) | Configure a backup server. Initiate a backup or restore. Schedule a time for automatic backup/restore. |
 |
Note NRP2 configuration backup and restore functions are only done from the NSP. |
The Cisco 6400 SCM software monitors the Cisco 6400 UAC and specific components connected into the chassis for faults. The fault information obtained from the hardware displays across a number of Element Manager windows.
Table 5-4 details each of the Cisco 6400 UAC components that are monitored, the Element Manager window that you open to view the fault information, and details of the fault information that displays. See Table 5-1 for details of how to open the appropriate Element Manager windows.
| Cisco 6400 UAC Component | Element Manager Window | Information Displayed | For Further Information |
Chassis | Cisco 6400 Chassis Management (Faults tab) | The alarm information table displays Alarm Index, Alarm Source, Alarm Severity, Alarm Type, and Alarm Cut Off Status information. | |
NSP | Cisco 6400 NSP Management (Faults tab) | Last restart reason and last authentication failure address. | |
NRP and NRP2 | Cisco 6400 NRP Management (Faults tab) | Last restart reason and last authentication failure address. | |
NRP ATM Port | Cisco 6400 NRP ATM Port Management (Faults tab) | Transmitted message errors, detected message errors, and SSCOP errored PDUs. | See the "Cisco 6400 NRP ATM Port Management Window" section. |
Line Card ATM Port Management | Cisco 6400 Line Card ATM Port Management (Faults tab) | Errors (transmitted message errors, detected message errors, and PDU errors received through SSCOP), Sonet frame errors, and DS1/E1/E3 errors. | See the "Cisco 6400 Line Card ATM Port Management Window" section. |
The faults displayed in the Cisco 6400 Chassis Management window (Faults tab) also appear as alarms in the Event Browser application.
The Cisco 6400 SCM software monitors capacity statistics for NRP modules. The capacity statistics information that you obtain displays on the Cisco 6400 NRP Capacity Statistics window. Table 5-5 details each of the Cisco 6400 UAC components that are monitored, the Element Manager window that you open to view the capacity information, and details of the fault information that displays. See Table 5-1 for details of how to open the appropriate Element Manager windows.
| Cisco 6400 UAC Component | Element Manager Window | Information Displayed | For Further Information |
NRP and NRP2 | Cisco 6400 NRP Capacity Statistics (NRP Capacity tab) | Subscriber connections, service instance uplinks, multidomain service connections, and over-subscription management. | See the "Cisco 6400 NRP Capacity Statistics Window" section. |
 |
Note The capacity statistics for NRP modules are maintained internally by the Cisco 6400 SCM software; they are not derived directly from totals on the Cisco 6400 UAC. When services are provisioned or removed through Cisco IOS, then the Cisco 6400 SCM's information is incorrect. |
The Cisco 6400 SCM software monitors and displays status information about the Cisco 6400 UAC and specific components connected into the chassis. The information displays across a number of Element Manager windows. Table 5-6 details each of the Cisco 6400 UAC components that are monitored, the Element Manager window that you open to view the status information, and details of the status information displayed. Table 5-1 details how to open the appropriate Element Manager windows.
| Cisco 6400 UAC Component | Element Manager Window | Status Information Displayed | For Further Information |
Chassis | Cisco 6400 Chassis Management (Status tab) | Chassis, Power Supply 1, Power Supply 2, Temperature Threshold Configuration, and Facility Alarm status information. | |
NSP | Cisco 6400 NSP Management (Status tab) | NSP status, System Configuration File, Host Configuration File, and Network Configuration File. | See the "Cisco 6400 NSP Management Window" section for further details. |
NRP and NRP2 | Cisco 6400 NRP Management (Status tab) | NRP status, System Configuration File, Host Configuration File, and Network Configuration File. | |
NRP ATM Port | Cisco 6400 NRP ATM Port Management (Status tab) | ATM Port Status. | See the "Cisco 6400 NRP ATM Port Management Window" section. |
Line Card | Cisco 6400 Line Card Management (Line Card tab) | Operational status. | |
Line Card ATM Port Management | Cisco 6400 Line Card ATM Port Management (Status tab) | ATM port status and physical layer status. | See the "Cisco 6400 Line Card ATM Port Management Window" section. |
Interface Status | Interface Status | View interface details, last change details, and transmission details for a selected interface. |
The Cisco 6400 SCM software monitors the Cisco 6400 UAC and specific components connected into the chassis for inventory information. The inventory information obtained from the hardware displays across a number of Element Manager windows. Table 5-7 details the Cisco 6400 UAC components that are monitored, the Element Manager windows that you open to view the inventory information, and details the inventory information displayed. Table 5-1 details how to open each of the Cisco 6400 Chassis Management windows.
| Cisco 6400 UAC Component | Element Manager Window | Inventory Information Displayed | For Further Information |
Chassis | Cisco 6400 Chassis Management (Inventory tab) | Chassis and power supply. | |
NSP | Cisco 6400 NSP Management (Inventory tab) | System inventory. | |
NRP and NRP2 | Cisco 6400 NRP Management (Inventory tab) | System inventory. | |
NRP ATM Port | Cisco 6400 NRP ATM Port Management (Inventory tab) | Admin Address, ATM Address Type, and Physical Port Type. | See the "Cisco 6400 NRP ATM Port Management Window" section. |
Line Card | Cisco 6400 Line Card Management (Line Card tab) | Line card inventory information for the selected line card (that is, module type, serial number, max supported ports, module description, hardware and software versions). | |
Line Card ATM Port | Cisco 6400 Line Card ATM Port Management (Inventory tab) | Admin address, ATM address type, and physical port type. | See the "Cisco 6400 Line Card ATM Port Management Window" section. |
The Cisco 6400 SCM software monitors and displays performance information on the Cisco 6400 UAC and specific components connected into the chassis. The performance information displays across a number of Element Manager windows. Table 5-8 details the Cisco 6400 UAC components that are monitored, the Element Manager window that you open to view the performance information, and details of the information displayed. Table 5-1 details how to open each of the Element Manager windows.
| Cisco 6400 UAC Component | Element Manager Window | Performance Information Displayed | For Further Information |
Chassis | Service Uplink Bandwidth Utilization | Displays the receive and transmit percentage bandwidth utilization. | |
NSP, NRP, and NRP2 | Module Performance (Performance tab) | CPU usage. Start or stop performance logging on the selected module. | See the "Module Performance Window" section. |
NRP ATM Port | Cisco 6400 NRP ATM Port Management (Performance tab) | Transmitted, connections established or detected, and SSCOP. | See the "Cisco 6400 NRP ATM Port Management Window" section. |
Line Card ATM Port | Cisco 6400 Line Card ATM Port Management (Performance tab) | Transmitted, Connections Established, Detected, and SSCOP. | See the "Cisco 6400 Line Card ATM Port Management Window" section. |
Interface | Interface Performance (Performance (1) tab) | View general information and packets and octets statistics. Start or stop performance logging for a selected interface. | |
Interface Performance (Performance (2) tab) | View error statistics. |
Additional (historical) performance information is available from the Performance Manager application. Performance Manager allows you to view general and performance-specific attributes in one application and in a variety of formats (for example, graphs and tables). You can:
For further information, see "Performance Management and Historical Data Statistics".
The Cisco 6400 SCM software monitors and displays statistical information for the Line Card ATM Port (SONET APS). The information displays on a the SONET APS Element Manager window. Table 5-9 details the Element Manager window that you open to view the statistics information and details of the information that displays. Table 5-1 details how to open SONET APS Element Manager window.
| Cisco 6400 UAC Component | Element Manager Window | Statistics Information Displayed | For Further Information |
Line Card ATM Port (SONET APS) | SONET APS (Statistics tab) | Path, line, section, and operational. |
The Cisco 6400 SCM software allows you to download IOS configuration information from a specified TFTP server (either manually or automatically at a specified time and date). Table 5-10 details parameters that can be configured in the IOS Image Download window. Table 5-1 details how to open each of the IOS Image Download window.
| Cisco 6400 UAC Component | Element Manager Window | IOS Image Download Information Displayed | For Further Information |
NSP, NRP (Executed from NSP for NRP2) | IOS Image Download | Configure the TFTP server. Initiate a download. Schedule a time for automatic download. |
The Cisco 6400 SCM software allows you to configure SNMP management information and enable or disable trap generation for a selected chassis. Table 5-11 details parameters that can be configured in the SNMP Management window. Table 5-1 details how to open each of the IOS Image Download window.
| Cisco 6400 UAC Component | Element Manager Window | SNMP Management Information Displayed | For Further Information |
Chassis | SNMP Management | Configure community names, SNMP version details. configure trap generation. enable or disable trap generation. | See the "SNMP Management Window" section. |
 |
Note The NRP2 card has an internal IP address. If a dialog window displays an NSP IP address where an NRP2 object was selected, the NRP2's IP address displays the NSP's IP address. |
The Cisco 6400 SCM software monitors and displays command log information for the selected NSP and NRP in the Command Log window. The information displays across a number of Element Manager windows. Table 5-12 details the information displayed in the Command Log window. Table 5-1 details how to open the Command Log window.
| Cisco 6400 UAC Component | Element Manager Window | Information Displayed | For Further Information |
NSP, NRP | Command Log | Command log details table. Uptime at last save, uptime at last change, maximum table entries, and entries deleted from table. | See the "Command Log Window" section. |
 |
Note By default, each command log and system log message created by an NRP2 appears on the NSP as a local message. This message contains the slot number of the NRP2 that created the message. |
The Cisco 6400 SCM software monitors and displays NSP and NRP system log messages. Table 5-13 details the Element Manager windows that you should open to view the SysLog Messages and provides details the information displayed. Table 5-1 details how to open the SysLog Messages windows.
| Cisco 6400 UAC Component | Element Manager Window | Information Displayed | For Further Information |
NSP, NRP | SysLog Messages (SysLog Messages tab) | Displays a SysLog Message table. Also displays a SysLog Message Details panel (Messages Not Recorded, Messages Not Processed, Messages Deleted from Table, Notifications Sent, Maximum Table Entries, Maximum SysLog Severity, and Notifications Enabled). | See the "SysLog Messages Window" section. |
The Cisco 6400 Chassis Management window allows you to view and configure Fault, Status, Configuration, and Inventory information for a selected chassis.
To view the chassis management window, follow these steps.
Step 2 Right-click Cisco 6400 UAC > Chassis > Manage > Chassis option.
See Table 5-1 for information on which objects allow you to launch the Cisco 6400 Chassis Management window.
The Cisco 6400 Chassis Management window appears with the Faults tab displayed (Figure 5-1).
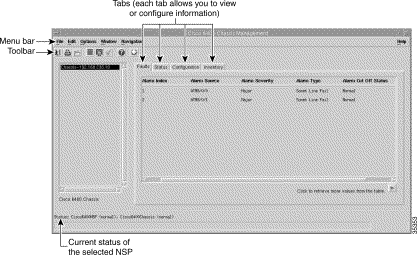
The Cisco 6400 Chassis Management window displays a number of Cisco 6400 SCM EM window aspects. A Cisco 6400 Chassis list displays at the left side of the window. This list is populated with all of the Cisco 6400 chassis available from your launch point.
The Cisco 6400 Chassis Management window is divided into four tabbed sections:
The Faults tab (see Figure 5-1) appears by default when the Cisco 6400 Chassis Management window appears. The Faults tab displays a log of alarms raised against the selected chassis. The following section describes the fields in this window.
The Alarm Information table displays the following information:
To view the Status tab, follow these steps:
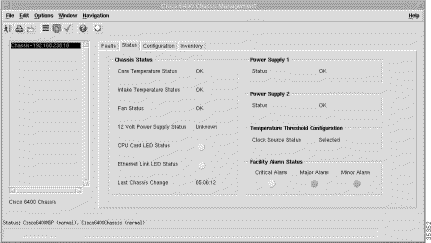
The Chassis Status panel (Figure 5-2) displays the following status information:
The Power Supply 1 panel (Figure 5-2) displays the status of power supply 1.
The Power Supply 2 panel (Figure 5-2) displays the status of power supply 2.
The Temperature Threshold Configuration panel displays the Clock Source Status. Notification signifies that the agent detects a change in the system clock source status. Notification is generated when the status value changes.
The Alarm Status panel displays the following status information:
To view the Configuration tab, follow these steps:
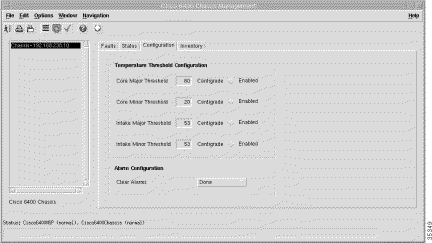
Step 2 Click the Configuration tab. The Cisco 6400 chassis configuration information appears (Figure 5-3).
Step 3 Configure the information using the menus and data entry boxes.
Step 4 Save the changes.
The Configuration panel (Figure 5-3) displays the following information:
The Temperature Threshold Configuration panel (Figure 5-3) allows you to view and configure the following information:
The Alarm Configuration panel (Figure 5-3) allows you to view and configure the Clear Alarms chassis configuration information. Clear Alarms allows you to specify whether to clear all, major, or minor alarm indications and reset the alarm contacts. You can set Clear Alarms to All, Minor, Major, Critical, or Done.
 |
Note When the Clear Alarms option is set, the alarm is still present in the table, but the alarm status displayed in the Alarm Cut Off Status column (displayed in the alarm table in the Faults tab) is set to Cut-Off. |
To view the Inventory tab, follow these steps:
Step 2 Click the Inventory tab. The Inventory tab appears (Figure 5-4).
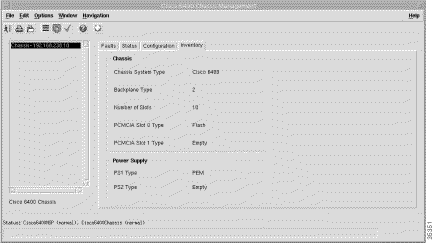
The Inventory tab displays the following information:
The Chassis panel (Figure 5-4) displays the following inventory information:
 |
Note For new NRP2 card, the PCMCIA disk must be in NSP disk slot 0. |
The Power Supply panel (Figure 5-4) displays the following inventory information:
The Cisco 6400 Chassis Capacity Monitoring window allows you to monitor the VPC/VCC allocation and maximize memory allocation for a selected Cisco 6400 Universal Access Concentrator (UAC).
To view the Monitoring window, follow these steps.
Step 2 Right-click Cisco 6400 UAC > Chassis > Manage > PVC Usage option.
The Cisco 6400 Chassis Capacity Monitoring window appears with the Chassis tab displayed (Figure 5-5).
The Permanent Virtual Connection (PVC) Management and Capacity Monitoring tool allows you to better manage your PVC bandwidth resources by providing the information required to monitor the VPC/VCC allocation and maximize memory allocation for the Cisco 6400 Universal Access Concentrator (UAC).
 |
Note The Management and Capacity Monitoring tool is only compatible with releases of Cisco IOS Release 12.1(4)DB and later that contain the show atm input-xlate-table and show atm input-xlate-table inuse commands for the NSP. Refer to the Cisco 6400 Software Configuration and Command Reference Guide for more information about ITT enhancements. |
The Input Translation Table is a hardware data structure used in the Cisco 6400 NSP for handling incoming cells. The ITT table consists of entries that are allocated in contiguous blocks for Virtual Circuit (VC) switching, and each block is dedicated to a Virtual Path Identifier (VPI) on an interface.
The entire NSP consists of a single ITT, which is organized in two banks of 32,000 entries each. This limits the use of large Virtual Channel Identifier (VCI) values and also limits the distribution of VCIs on VPIs as the number of VCs approaches 32,000. When an additional VC is added to a VPI that requires a larger block size than the current block, the current block is copied to a new larger block and the original block is freed. This leaves a series of small unused blocks.
As a result, ITT memory is fragmented. The ITT blocks grow to accommodate higher VCI values for a specific port or VPI, but ITT space is not returned unless the entire ITT is full.
ITT enhancements provide NSP functions to minimize fragmentation and enable the NSP to automatically determine the minimum ITT block size required to support the PVCs configured for each interface and VPI.
The Capacity Monitoring tool:
At the report phase, you can set a threshold value. If this value is exceeded, an alarm occurs. The alarm is logged to the Event Browser. The default threshold is set to the maximum value.
The PVC Usage feature is a menu option that allows you to display a window with information invoked from the Input Translation Table from Cisco IOS Release 12.1(4) DB operating software. The Cisco 6400 Chassis Management PVC Usage window displays two tabs:
To access or use the PVC Usage option, follow these steps:
Step 2 Right-click Cisco 6400 UAC > Chassis > Manage > PVC Usage option.
The Cisco 6400 Chassis Capacity Monitoring window appears with the Chassis tab selected (Figure 5-5).
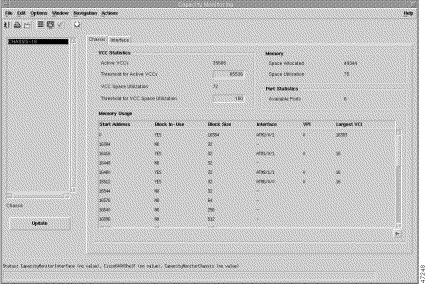
The Cisco 6400 Chassis Management Capacity Monitoring window displays a number of VCI statistics and port statistics (available ports) and a list of memory usage parameters. A Cisco 6400 chassis list box appears at the left side of the window. This list box is populated with all of the Cisco 6400 chassis available from your launch point.
To view the Chassis tab in the Capacity Monitoring window, follow these steps:
Step 2 Place the cursor on a relevant chassis, site, or shelf icon.
Step 3 Right-click Cisco 6400 UAC > Chassis > Manage > PVC Usage menu option to display the Chassis tab. The Capacity Monitoring window for the selected chassis appears.
The Chassis tab displays the following information:
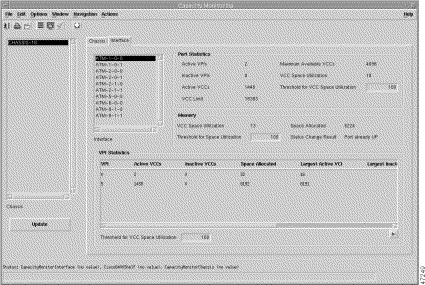
The Interface tab displays the interface selection list box and four panels: Port Statistics, Memory, VPI Statistics, and the Threshold for VCC Space Utilization field.
To view the Interface tab, follow these steps:
The first interface tab window information for the selected chassis appears (Figure 5-6).
 |
Note The Interface tab in the Capacity Monitoring window contains a scroll bar to view the entire VPI Statistics table of parameters. For purposes of viewing the entire VPI Statistics area, the Interface tab information is displayed in Figure 5-6 and Figure 5-7. |
The Interface Tab displays the following information:
The second interface tab window information for the selected chassis appears (Figure 5-7).
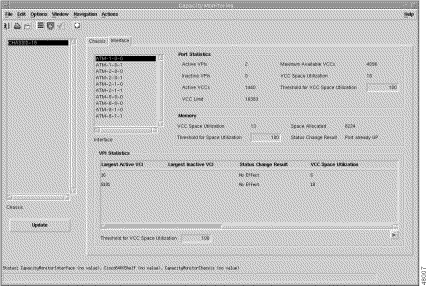
The Update button initiates the collection, report, and alert phases of the PVC Usage function. The results of this update appear in tabular format in the Capacity Monitoring windows. If the threshold value is exceeded, an alarm notifies the operator.
To refresh the PVC statistics, you must click the Update button on the Monitoring windows.
 |
Note The update process might vary depending on the size of your configuration. |
To display updated parameters on the Capacity Monitoring windows for the entries in the Input Translation Table, follow these steps:
A dialog box prompts you to update or not (Figure 5-8).
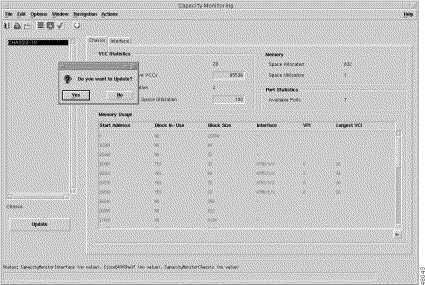
If you click:
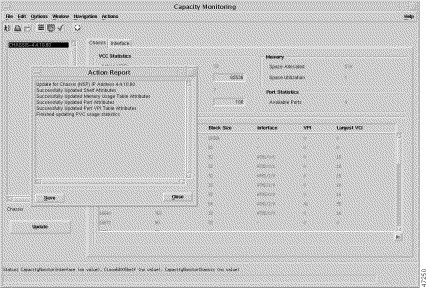
Step 2 If you click Yes, an Action Report window appears with a series of status messages. Figure 5-9 shows a sample of a status message that can be appear in the Action Report window.
 |
Note If you click the Save button, then the messages (for example, Update for Chassis (NSP) IP Address x.x.xx.xx, Successfully Updated Port Attributes) displayed from the Action Report window are stored in a text file. |
The SNMP Management window allows you to:
To view the SNMP management window, follow these steps.
Step 2 Right-click Cisco 6400 UAC > Chassis > Manage > SNMP Management option.
The SNMP Management window appears with the SNMP Management tab displayed (Figure 5-10).
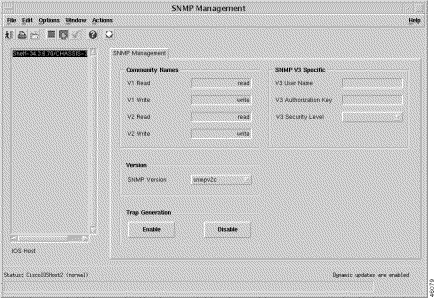
The SNMP Management panel (Figure 5-10) displays the following information:
The Community Names panel provides a security mechanism for SNMP communications. The device holds its own community names, so the correct community names must be used in order to get or set attributes from the device.
This panel provides the following options:
Version displays the SNMP Version dropdown list, which allows you to choose the SNMP version.
Trap Generation displays the following options:
When trap generation is enabled on a selected chassis, any traps generate alarms and send them to the IP address of the specified chassis. This means that alarms are visible to the user in the appropriate view of the Cisco 6400 SCM. You can also disable this feature so that no traps are generated and no alarms are sent. This means that no alarms are visible to the user on the selected chassis.
To enable and disable trap generation, follow these steps:
Step 2 Right-click Cisco 6400 UAC > Chassis > Manage > SNMP Management option.
Step 3 Choose the relevant Chassis from the IOS Host list displayed at the left side of the window.
Step 4 Click Enable to allow trap generation or click Disable to avoid trap generation.
See the "SNMP Management Window" section for further information on the parameters displayed on this tab.
The Chassis Configuration window allows you to view and configure parameters relevant to the selected chassis and commission or decommission a selected chassis. The Chassis Configuration—Additional Descriptions tab allows you to specify additional description information for a selected chassis. The Description 1 and Description 2 data entry fields allow you to enter any additional text descriptions for identification purposes (for example, CLLI codes could be entered).
From a relevant object icon or from an object list right-click Cisco 6400 UAC > Chassis > Manage > Configuration option. (See Table 5-1 for information on which objects allow you to launch the Chassis Configuration window.) The Chassis Configuration window (Figure 5-11) appears with the Configuration tab displayed. The Configuration tab displays four panels.
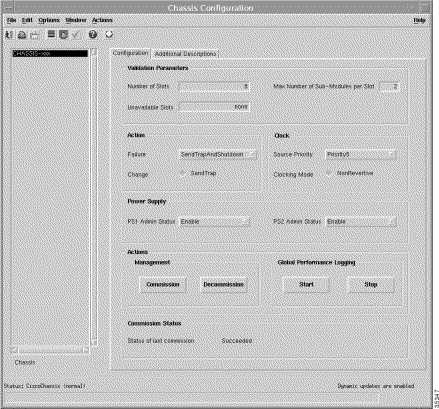
The Configuration tab (Table 5-11) displays four panels: Validation Parameters, Power Supply, Actions, and Commission Status.
The Validation Parameters panel contains attributes that describe the population characteristics of a chassis and are used to validate module deployment:
The Actions panel allows you to take action whenever a failure or change in the chassis is detected:
The Clock panel allows you to view and change the following information:
The Power Supply panel allows you to view and change the following information:
The Actions panel displays the Management panel.
The Management panel allows you to commission or decommission the selected chassis. Click Commission to force a discovery of the contents of the selected chassis.
 |
Note A chassis can be commissioned quickly (without opening the Chassis Configuration window) by right-clicking on the chassis map in the Map Viewer window (in the c6400Manager view) and choosing the Cisco 6400 UAC > Chassis > State > Commission option. Selecting the Commission option commissions the chassis and the cards within the chassis. The state of the chassis and the cards within the chassis changes to Normal. |
To commission a chassis (from the Chassis Configuration window), follow these steps:
 |
Note See the "Commissioning a Chassis" section for further details. |
 |
Note See the "Decommissioning a Chassis" section for further details. |
The Global Performance Logging panel allows you to start or stop global performance logging. Global performance logging is off by default.
Global performance logging allows the Cisco 6400 SCM to collect performance information for the NSP, NRP, and NRP2 modules and for NRP and NLC port interfaces within a selected chassis. This historical information can then be viewed using Performance Manager. "Performance Management and Historical Data Statistics," provides further information on how to use the Performance Manager application.
 |
Note Performance logging can start or stop on a per-module or interface (port) basis. See the "Module Performance Window" section for details on how to start performance logging for a selected module (that is, NSP or NRP modules). See the "Interface Performance Window" section for details on how to start performance logging for a selected interface (that is, for NRP or NLC port interfaces). |
To begin global performance logging for a selected chassis, follow these steps:
Step 2 Choose the relevant Chassis from the list displayed at the left side of the window.
Step 3 Click Start to begin performance logging on the selected chassis.
 |
Note Performance logging can also be stopped on a per-module or interface (port) basis. See the "Module Performance Window" section for details on how to stop performance logging for a selected module (that is, NSP or NRP modules). See the "Interface Performance Window" section for details on how to stop performance logging for a selected interface (that is, for NRP or NLC port interfaces). |
To stop global performance logging for a selected chassis, follow these steps:
Step 2 Choose the relevant Chassis from the list displayed at the left side of the window.
Step 3 Click Stop to stop global performance logging for the selected chassis.
The Commission Status panel gives you the status of the last commission executed.
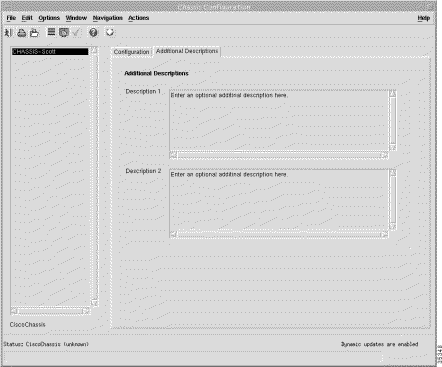
The Additional Description tab (Figure 5-12) displays the Additional Descriptions panel.
Descriptions 1 and 2 (optional) allow you to specify additional description information for a selected chassis. The Description 1 and Description 2 data entry fields allow you to enter any additional text descriptions for identification purposes (for example, CLLI codes could be entered).
The Cisco 6400 NSP Management window allows you to monitor and configure installed NSP modules. The Cisco 6400 NSP Management window displays four tabs: Faults, Status, Configuration, and Inventory.
 |
Note To commission the selected NSP, see the "Commissioning an NSP, NRP, NRP2, or NLC Module" section for further details. |
From a relevant object icon or from an object list, right-click Cisco 6400 UAC > Module > Manage > NSP option. (See Table 5-1 for information on which objects allow you to launch the Cisco 6400 NSP Management window.) The Cisco 6400 NSP Management window appears with the Faults tab displayed. The Faults tab (Figure 5-13) displays two panels: Faults and Cisco Contact Details.
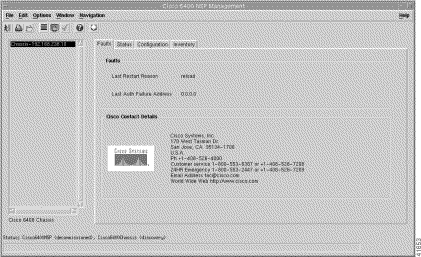
To view the Faults tab, follow these steps:
The Faults tab appears (see Figure 5-13).
Step 2 Choose a relevant Chassis from the chassis list.
The fault information for the selected chassis appears.
The Faults panel (see Figure 5-13) displays the following error information:
Displays Cisco contact details.
To view the Status tab, follow these steps:
Step 2 Click the Status tab. The Status tab (Figure 5-14) is divided into four panels: Status, System Configuration File, Host Configuration File, and Network Configuration File.
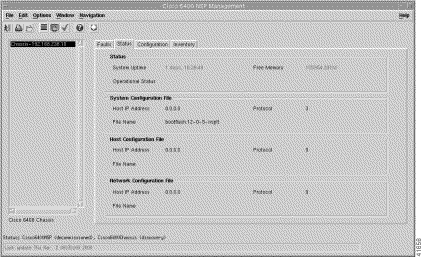
Step 3 Choose a relevant Chassis from the list.
The status information for the selected chassis appears (Figure 5-14).
The Status panel (Figure 5-14) displays the following information:
The System Configuration File panel (Figure 5-14) displays the following information:
The Host Configuration File panel (Figure 5-14) displays the following information:
The Network Configuration File panel (Figure 5-14) displays the following status information:
The Configuration tab allows you to configure some of the parameters (System Configuration and CLI Passwords) that can be set on the selected NSP module.
 |
Note To Commission a selected NSP, see the "Commissioning an NSP, NRP, NRP2, or NLC Module" section for further details. |
To view the Configuration tab, follow these steps:
Step 2 Click the Configuration tab (Figure 5-15).
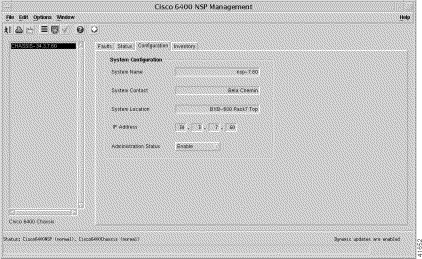
Step 3 Choose a relevant Chassis from the chassis list. The configuration information for the selected NSP appears (Figure 5-15). The Configuration tab displays the system configuration panel.
Step 4 Edit the information in the Configuration tab.
Step 5 Click Save from the Edit menu to save any changes.
The System Configuration panel allows you to configure the following information:
To view the Inventory tab, follow these steps:
Step 2 Click the Inventory tab (Figure 5-16).
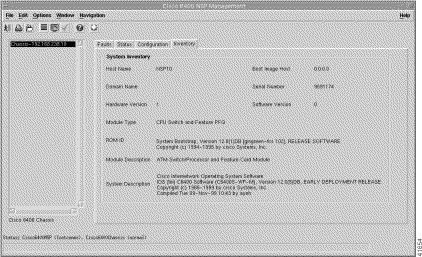
Step 3 Choose a relevant Chassis from the chassis list. The Inventory information for the selected chassis appears.
The Inventory tab displays the System Inventory panel.
The System Inventory panel displays the following information:
The Module Configuration window allows you to enter a description for a selected NSP, NRP, NRP2, or NLC module and commission or decommission the selected module.
From a relevant object icon or from an object list, right-click Cisco 6400 UAC > Module > Manage > Configuration option. (See Table 5-1 for information on which objects allow you to launch the Module Configuration window.) The Configuration tab displays two panels: Additional Descriptions and Actions. The Module Configuration window (Figure 5-17) appears with the Configuration tab displayed.
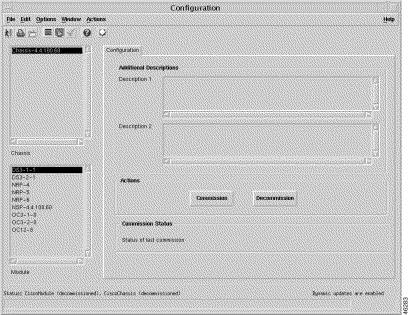
The Module list displays half-height modules (OC-3 or DS3 NLCs) with a slot and subslot number (for example, DS3-8-0). Full-height modules (NSPs, NRPs, NRP2s, or OC-12 NLCs) display as a module with a slot number (for example, NRP-5). When selecting a module from the list, you must first identify the module's location in the chassis and then choose the module according to its slot location in the rack.
Descriptions 1 and 2 (optional) allow you to specify additional description information for a selected chassis. The Description 1 and Description 2 data entry fields allow you to enter any additional text descriptions for identification purposes (for example, CLLI codes could be entered).
The Actions panel allows you to commission or decommission the selected module:
Step 2 Choose the relevant Chassis and Module from the lists displayed at the left side of the window. The status of the selected module appears at the bottom left corner of the window.
Step 3 Enter optional Description 1 and Description 2 information. The Description 1 and Description 2 data entry fields allow you to enter any additional text descriptions for identification purposes (for example, CLLI codes could be entered).
Step 4 Click Commission when the status is Decommissioned.
The NSP, NRP, or NLC is now commissioned; its state changes to Commissioning and then Normal. The Commission Status field displays the state of the module.
Step 2 Choose the relevant Chassis and NSP, NRP, or NLC from the lists displayed at the left side of the window. The status of the selected card appears at the bottom left corner of the window.
Step 3 Click Decommission when the status is Normal.
The NRP, NSP, or NLC is now decommissioned; its state changes to Decommissioned. The Commission Status field displays the state of the module.
The Module Performance window displays performance attributes for the selected module. The Module Performance tab displays CPU usage information and allows you to start or stop performance logging for the selected NSP, NRP, or NRP2 modules (see Figure 5-18).
 |
Note Performance logging can also be started or stopped on a global basis for a selected chassis. See the "Chassis Configuration Window" section for details on how to start or stop global performance logging for a selected chassis. |
Selecting an NLC module provides performance data for the NSP. The NSP displays the selected NLC's performance data.
 |
Note The values displayed relate to CPU performance, so modules without a CPU display the same value as the CPU card in the chassis. |
From a relevant object icon or from an object list, right-click Cisco 6400 UAC > Module > Manage > Performance option. (See Table 5-1 for information on which objects allow you to launch the Module Performance window.)
The Module Performance window appears with the Performance tab displayed. The Performance tab (Figure 5-18) displays two panels: CPU Usage and Performance Logging. The CPU Usage and Performance Logging panels show "real-time" performance statistics.
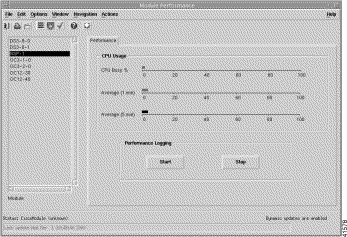
Choose a Module from the list displayed. The performance information for the selected module appears.
The CPU Usage panel displays the following performance information:
The Performance Logging panel allows you to start or stop performance logging for the selected module:
 |
Note Performance logging logs data that can be displayed using the Performance Manager application. Figure 5-18 displays "real-time" performance statistics. Historical performance information can be viewed using Performance Manager. "Performance Management and Historical Data Statistics," provides further information on the Performance Manager application. |
Performance logging allows performance information to be collected for a selected module. This historical information can then be viewed using Performance Manager. "Performance Management and Historical Data Statistics," provides further information on how to use the Performance Manager application.
To start or stop performance logging for a selected module, follow these steps:
Step 2 Click Start to begin performance logging for the selected module. Click Stop to stop performance logging for the selected module.
Step 3 Launch the Performance Manager application to view the historical performance information for the selected module.
The Command Log window allows you to view the event commands stored in the Command Log Details table and the system log messages stored in the syslog message table for the selected NSP.
From a relevant object icon or from an object list, right-click Cisco 6400 UAC > Module > View > Command Log option. (See Table 5-1 for information on which objects allow you to launch the Command Log window). The Command Log window (Figure 5-19) appears with the Command Log Details tab displayed.
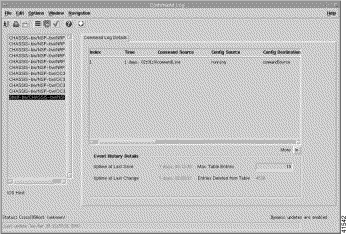
To view the Command Log Details information, follow these steps:
Step 2 Choose a relevant Chassis.
The Command Log Details table for the selected NSP displays the following information:
The Event History Details panel (Figure 5-19) displays the following information:
 |
Note When the value of Uptime at Last Change is greater than Uptime at Last Save, the configuration has been changed but not saved. |
Step 3 Scroll through the list of event commands (using the arrow keys) until the relevant event command appears. The down arrow displays the next 10 entries and the up arrow displays the previous 10 entries. Use the horizontal scroll bar to view all the table entries. Drag the scroll bar until the relevant information appears. You can change the width of each column if necessary to view fault strings clearly (see the "Changing Column Width" section).
To change the width of a column, follow these steps:
Step 2 Place the cursor to the left of a column heading and move the cursor until it changes to a double arrow.
Step 3 Click and hold the left mouse button when the cursor changes.
Step 4 Drag the cursor until the column is at the required width.
Step 5 Release the mouse button.
Any text wider than the column is truncated. The column widths return to the default widths when you close this window.
The SysLog Messages window displays log information for the selected NSP or NRP modules and is useful for diagnosing Cisco 6400 failure conditions.
To view the SysLog Messages window, follow these steps:
The SysLog Messages window (Figure 5-20) appears with the SysLog Messages tab displayed.
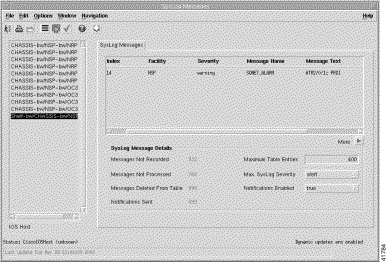
Step 2 Choose a relevant Chassis. The SysLog Message Table appears for the selected chassis.
Step 3 Scroll through the list of system messages using the arrow keys until you find the information you want. The right arrow displays the next 10 entries and the left arrow displays the previous 10 entries.
You can view all the table entries by using the horizontal scroll bar. Click and drag the scroll bar until you see the information you want. You can change the width of each column if necessary (see the "Changing Column Width" section).
The SysLog Messages table (Figure 5-20) displays the following information:
The SysLog Message Details panel (Figure 5-20) displays the following information:
The Cisco 6400 NRP Management window is divided into four tabbed sections: Faults, Status, Configuration, and Inventory.
 |
Note The NRP2 cards appear in the node route processor list in the NRP Management window. |
 |
Note To commission the selected NRP, see the "Commissioning an NSP, NRP, NRP2, or NLC Module" section for further details. |
From a relevant object icon or from an object list, right-click Cisco 6400 UAC > Module > Manage > NRP option. (See Table 5-1 for information on which objects allow you to launch the Cisco 6400 NRP Management window.) The Cisco 6400 NRP Management window appears with the Faults tab displayed (Figure 5-21).
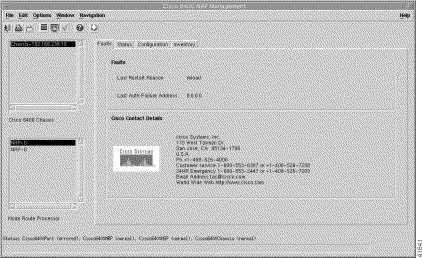
To view the Faults tab, follow these steps:
Step 2 The Faults tab appears by default. See the "Faults Tab" section for further information.
Step 3 Choose the relevant Chassis and NRP. The fault information for the selected chassis appears.
The Faults panel displays the following error information:
The Cisco Contact Details panel displays Cisco contact information.
To view the Status tab, follow these steps:
Step 2 From the Cisco 6400 NRP Management window, click the Status tab (Figure 5-22).
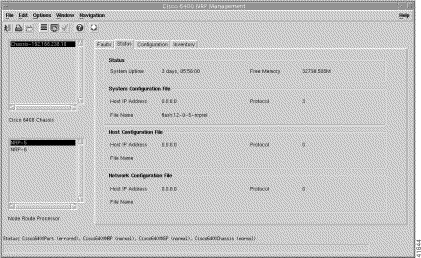
Step 3 Choose the relevant chassis and NRP.
The status information for the selected NSP and NRP appears.
The Status panel (Figure 5-22) displays the following information:
The System Configuration File panel displays the following status information:
The Host Configuration File panel displays the following information:
The Network Configuration File panel displays the following information:
 |
Note To commission the selected NRP, see the "Commissioning an NSP, NRP, NRP2, or NLC Module" section for further details. |
 |
Note The NRP2's IP address displays the same address as the NSP in the selected chassis. |
To view the Configuration tab, follow these steps:
Step 2 Click the Configuration tab (Figure 5-23).
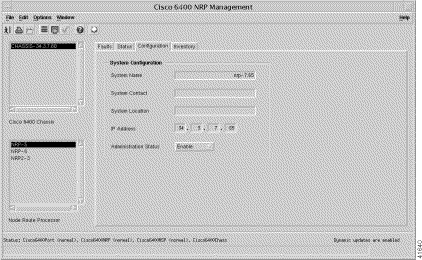
Step 3 Choose the relevant Chassis and NRP.
The configuration information for the selected NRP appears (Figure 5-23).
Step 4 Change the information in the dropdown lists and data entry boxes.
Step 5 Save the changes.
The Configuration tab displays the System Configuration panel.
The System Configuration panel allows you to configure the following information:
 |
Note If an NRP2 is selected, any dialog window showing an IP address also shows the NSP's IP address. |
To view the Inventory tab, follow these steps:
Step 2 Click the Inventory tab (Figure 5-24).
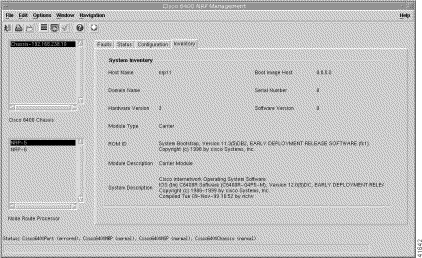
Step 3 Choose a relevant Chassis and NRP.
The Configuration tab displays the System Inventory panel.
The System Inventory panel (Figure 5-24) displays the following information:
The SSG Configuration window is divided into three tabs: SSG Configuration, PPPoA Configuration, and PPPoE Configuration.
From a relevant object icon or from an object list, right-click Cisco 6400 UAC > Module > Manage > SSG Configuration option. (See Table 5-1 for information on which objects allow you to launch the Cisco 6400 NRP Management window.) The SSG Configuration window (Figure 5-25) appears with the SSG Configuration tab displayed.
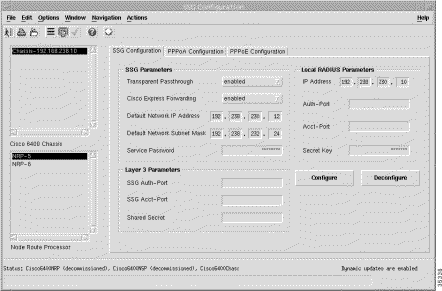
To view the SSG Configuration tab, follow these steps:
Step 2 Choose a relevant Chassis and NRP.
The SSG Configuration tab displays the following panels:
The SSG Parameters panel are a prerequisite for setting NRP SSG features. The SSG Parameters panel displays the following information:
The Layer 3 Parameters panel allows you to enable service selection dashboard access and layer 3 services. The Layer 3 Parameters panel displays the following information:
 |
Note Setting the Local RADIUS Parameters panel values are a prerequisite for setting NRP SSG features. |
The Local RADIUS Parameters panel displays the following information:
Click Configure to configure the parameters set in the SSG Configuration Window (SSG Configuration tab) on the NRP-SSG.
SSG configuration should be carried out when the NRP-SSG functionality is required. To set the SSG configuration parameters onto a selected NRP-SSG, follow these steps:
Step 2 Choose a relevant Chassis and NRP.
Step 3 Configure the parameters displayed in the SSG Parameters, Layer 3 Parameters, and Local RADUIUS Parameters panels.
Step 4 Click Configure to set the parameters on the selected NRP-SSG.
Click Deconfigure to deconfigure the parameters set on the NRP-SSG.
SSG deconfiguration should be carried out when the NRP-SSG functionality is no longer required. To deconfigure the SSG configuration parameters from a selected NRP-SSG, follow these steps:
Step 2 Choose a relevant Chassis and NRP.
Step 3 Click Deconfigure to deconfigure the parameters set on the selected NRP-SSG.
To view the PPPoA Configuration tab, follow these steps:
Step 2 Click the PPPoA Configuration tab. The configuration-related panels (Figure 5-26) appear.
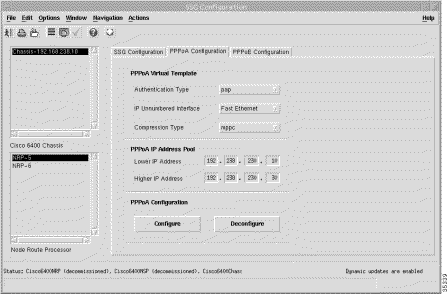
Step 3 Choose a relevant Chassis and NRP.
The PPPoA Configuration tab (Figure 5-26) displays three panels:
The PPPoA Configuration tab allows parameters to be set on the NRP-SSG that are prerequisites of the PTA-MD service.
 |
Note Before connecting a subscriber to a PTA-MD service using PPPoA, the corresponding parameters on the PPPoA Configuration tab should be configured. For example, the parameters in the PPPoA Virtual Template and PPPoA IP Address Pool should be set and configured to connect a subscriber to a PTA-MD service using PPPoA. |
The PPPoA Virtual Template panel displays the following information:
The PPPoA IP Address Pool panel displays the following information:
No IP address pool is configured when the Higher IP Address and Lower IP Address parameters are left blank.
Click Configure to configure the parameters set on the NRP-SSG or click Deconfigure to deconfigure the parameters set on the NRP-SSG.
PPPoA Configuration must be carried out before a subscriber can be connected to an NRP using PPPoA or before a subscriber can be statically connected to an IP Uplink service. To set the PPPoA configuration parameters onto a selected NRP, follow these steps:
Step 2 Click the PPPoA Configuration tab.
Step 3 Choose a relevant Chassis and NRP.
Step 4 Configure the parameters displayed in the PPPoA Virtual Template and PPPoA IP Address Pool panels.
Step 5 Click Configure to set the parameters on the selected NRP.
To deconfigure PPPoA configuration parameters set on a selected NRP, follow these steps:
Step 2 Click the PPPoA Configuration tab.
Step 3 Choose a relevant Chassis and NRP.
Step 4 Click Deconfigure to set the parameters on the selected NRP.
The PPPoE Configuration tab displays three panels:
The More SSG Configuration tab allows parameters to be set on the NRP-SSG that are prerequisites of the PTA-MD service.
 |
Note Before connecting a subscriber to a PTA-MD service using PPPoE the corresponding parameters on the PPPoE Configuration tab should be configured. For example, the parameters in the PPPoE Virtual Template and PPPoE IP Address Pool panels should be set and configured to connect a subscriber to a PTA-MD service using PPPoE. |
To view the PPPoE Configuration tab, follow these steps:
Step 2 Click the PPPoE Configuration tab. The configuration-related panels (Figure 5-27) appears.
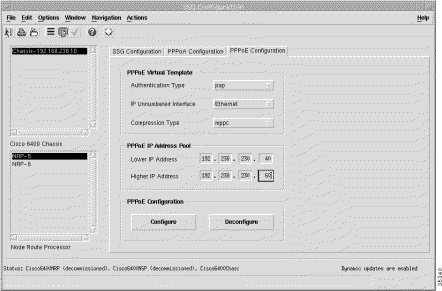
Step 3 Choose a relevant Chassis and NRP.
The PPPoE Configuration tab displays the following panels.
The PPPoE Virtual Template panel displays the following information:
The PPPoE IP Address Pool panel displays the following information:
No IP address pool is configured when the Higher IP Address and Lower IP Address parameters are left blank.
Click Configure to configure the parameters set on the NRP-SSG or click Deconfigure to deconfigure the parameters set on the NRP-SSG.
PPPoE Configuration must be carried out before a subscriber can be connected to an NRP using PPPoE. To set the PPPoE configuration parameters onto a selected NRP, follow these steps:
Step 2 Click the PPPoE Configuration tab.
Step 3 Choose a relevant Chassis and NRP.
Step 4 Configure the parameters displayed in the PPPoE Virtual Template and PPPoA IP Address Pool panels.
Step 5 Click Configure to set the parameters on the selected NRP.
To deconfigure PPPoE configuration parameters set on a selected NRP, follow these steps:
Step 2 Choose a relevant Chassis and NRP.
Step 3 Click Deconfigure to set the parameters on the selected NRP.
The Cisco 6400 NRP Capacity Statistics window displays a single NRP Capacity tab with four panels: Subscriber Connections, Service Instance Uplinks, Multi-Domain Service Connections, and Over-Subscription Management.
 |
Note The Cisco 6400 NRP Capacity Statistics window displays the NRP2 card. |
From a relevant object icon or from an object list, right-click Cisco 6400 UAC > Module > Manage > NRP Capacity Statistics option. (See Table 5-1 for information on which objects allow you to launch the Cisco 6400 NRP Capacity Statistics window.) The Cisco 6400 NRP Capacity Statistics window appears with the NRP Capacity tab displayed (Figure 5-28).
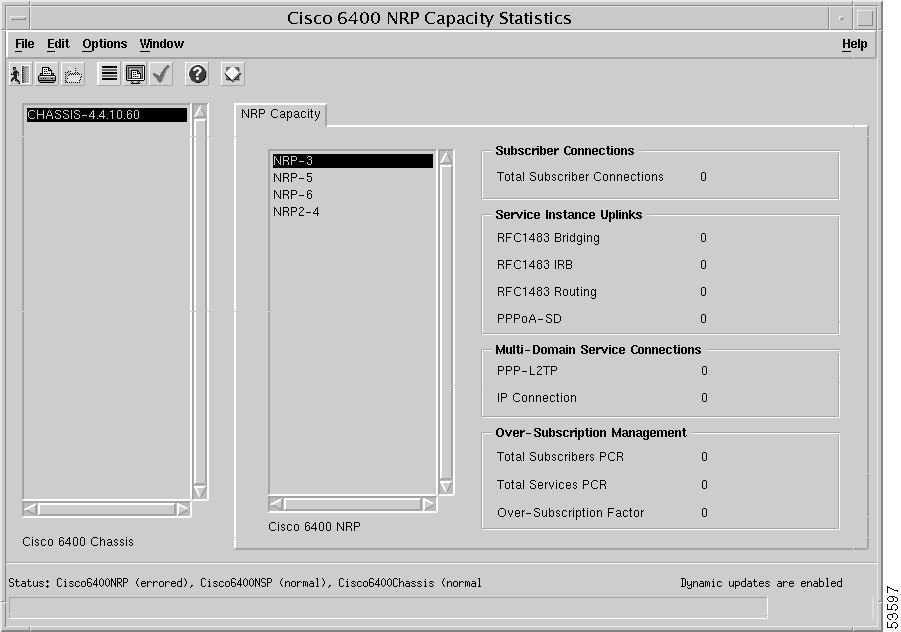
To view the NRP Capacity tab, follow these steps:
Step 2 The NRP Capacity tab appears by default (see Figure 5-28).
Step 3 Choose the relevant Cisco 6400 Chassis and Cisco 6400 NRP. The NRP capacity information for the selected NRP appears.
The NRP Capacity tab displays the following panels.
The Subscriber Connections panel displays the total number of subscribers connected to the selected NRP or NRP2.
The Service Instance Uplinks panel displays the following information:
The Multi-Domain Service Connections panel displays the following information:
The Over-Subscription Management panel displays the following information:
The Cisco 6400 NRP ATM Port Management window displays six tabs: Faults, Status, Performance, Configuration, More Configuration, and Inventory.
 |
Note To commission the selected interface port, see the "Commissioning an NRP or NLC Interface Port" section for further details. |
From a relevant object icon or from an object list, right-click Cisco 6400 UAC > Port > Manage > NRP ATM Port option. (See Table 5-1 for information on which objects allow you to launch the Cisco 6400 NRP ATM Port Management window.) The Cisco 6400 NRP ATM Port Management window appears with the Faults tab displayed. The Faults tab (Figure 5-29) appears by default and has one panel.
 |
Note To Commission the selected NRP ATM Port Interface, see the "Commissioning an NRP or NLC Interface Port" section for further details. |
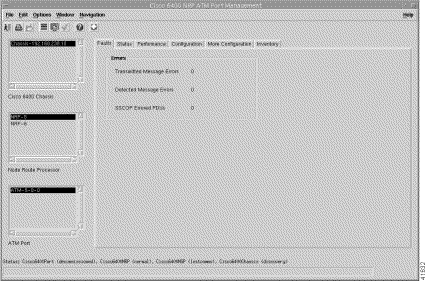
To view the Faults tab, follow these steps:
Step 2 Choose a relevant Chassis, NRP, and ATM Port.
The Fault information for the selected ATM port appears.
The Errors panel (Figure 5-29) displays the following error information:
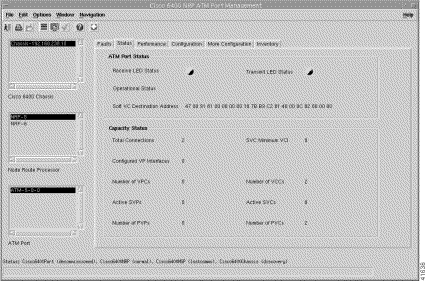
The status information for the selected ATM Port appears. To view the Status tab, follow these steps:
Step 2 Click the Status tab (Figure 5-30).
Step 3 Choose a relevant Chassis, NRP, and ATM Port.
The Status tab displays the following panels:
The ATM Port Status panel displays the following information:
The Capacity Status panel displays the following information:
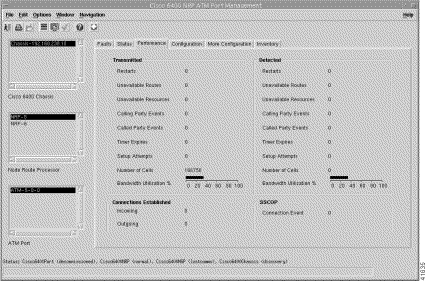
The Performance tab is divided into four panels: Transmitted, Connections Established, Detected, and SSCOP.
To view the Performance tab, follow these steps:
Step 2 Click the Performance tab (Figure 5-31).
Step 3 Choose a relevant Chassis, NRP, and ATM Port.
The Performance tab displays the following panels:
The Transmitted panel displays the following information:
| Cause Value | Meaning |
1 | Unallocated (unassigned) number |
1 | No route to specified transit network |
3 | No route to destination |
 |
Note RELEASE COMPLETE messages that are a reply to a previous RELEASE message and contain the same cause value are redundant (for counting purposes) and should not be counted for the counter. |
| Cause Value | Meaning |
17 | User busy |
18 | No user responding |
21 | Call rejected |
22 | Number changed |
23 | User rejects all calls with calling line ID restriction (CLIR) |
27 | Destination out of order |
31 | Normal, unspecified |
88 | Incompatible destination |
 |
Note Cause values apply to both UNI 3.0 and UNI 3.1. |
| Cause Value | Meaning |
28 | Invalid number format (address incomplete) |
43 | Access information discarded |
57 | Bearer capability not authorized |
65 | Bearer capability not implemented |
73 | Unsupported combination of traffic parameters |
78 | AAL parameters cannot be supported (UNI 3.1 only) |
91 | Invalid transit network selection |
93 | AAL parameters cannot be supported (UNI 3.0 only) |
 |
Note Cause values apply to both UNI 3.0 and UNI 3.1. |
| Cause Value | Meaning |
17 | User busy |
18 | No user responding |
21 | All rejected |
22 | Number changed |
23 | User rejects all calls with calling line ID restriction (CLIR) |
27 | Destination out of order |
31 | Normal, unspecified |
88 | Incompatible destination |
 |
Note Cause values apply to both UNI 3.0 and UNI 3.1. |
 |
Note Receive and Transmit Utilization gauges are displayed from a subscriber's point of view; that is, the Transmit Utilization value shows the number of cells per second the subscriber is transmitting and the Receive Utilization value shows the number of cells per second the subscriber is receiving. |
The Connections Established panel displays the following performance information:
The Detected panel displays the following performance information:
| Cause Value | Meaning |
1 | Unallocated (unassigned) number |
1 | No route to specified transit network |
3 | No route to destination |
88 | Incompatible destination |
 |
Note Cause values apply to both UNI 3.0 and UNI 3.1. |
| Cause Value | Meaning |
35 | Requested VPCI/VCI not available |
37 | User cell rate not available (UNI 3.1 only) |
38 | Network out of order |
41 | Temporary failure |
45 | No VPCI/VCI available |
47 | Resource unavailable, unspecified |
49 | Quality of Service unavailable |
51 | User cell rate not available (UNI 3.0 only) |
58 | Bearer capability not presently available |
63 | Service or option not available, unspecified |
92 | Too many pending add party requests |
 |
Note Cause values apply to both UNI 3.0 and UNI 3.1 unless otherwise stated. |
| Cause Value | Meaning |
28 | Invalid number format (address incomplete) |
43 | Access information discarded |
57 | Bearer capability not authorized |
65 | Bearer capability not implemented |
73 | Unsupported combination of traffic parameters |
78 | AAL parameters cannot be supported (UNI 3.1 only) |
91 | Invalid transit network selection |
93 | AAL parameters cannot be supported (UNI 3.0 only) |
 |
Note Cause values apply to both UNI 3.0 and UNI 3.1. |
| Cause Value | Meaning |
17 | User busy |
18 | No user responding |
21 | All rejected |
22 | Number changed |
23 | User rejects all calls with calling line ID restriction (CLIR) |
27 | Destination out of order |
31 | Normal, unspecified |
88 | Incompatible destination |
 |
Note Cause values apply to both UNI 3.0 and UNI 3.1. |
The SSCOP section of the Performance tab allows you to view the following performance information:
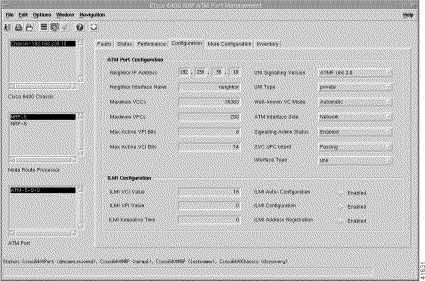
The Configuration tab is divided into two panels: ATM Port Configuration and ILMI Configuration. To view the Configuration tab, follow these steps:
Step 2 Click the Configuration tab (Figure 5-32).
Step 3 Choose a relevant Chassis, NRP, and ATM Port. The configuration information for the selected ATM port appears.
Step 4 Configure the information displayed.
Step 5 Save the changes.
The ATM Port Configuration panel allows you to configure the following information:
 |
Note The value of the object might be obtained in different ways, for example, by manual configuration, or through ILMI interaction with the neighbor system. |
 |
Note Setting the variable to a value of "notApplicable" is not allowed. To modify the ciscoAtmIfUniSignalingVersion, ifAdminStatus has to be down and atmIfIlmiAutoConfiguration disabled. |
 |
Note When ciscoAtmIfType is not UNI then UNI type value should be ignored. |
 |
Note To modify the ciscoAtmIfSignalingAdminStatus, ifAdminStatus has to be down. |
 |
Note Values other than passing are allowed only when policing is supported on the interface. The SVC UPC Intent also serves to determine which UPC to use on the terminating (destination) half-leg of Soft PVCs. For the CPU interface or logical ports on the LS1010, only the "passing" value is supported. |
 |
Note To modify the ciscoAtmIftype, ifAdminStatus has to be down and atmIfIlmiAutoConfiguration disabled. |
The ILMI Configuration panel allows you to configure the following information:
 |
Note The configuration only takes effect on the next interface restart. |
 |
Note The configuration takes effect only on the next interface restart. Disabling the ILMI Configuration will also disable atmIfIlmiAddressRegistration and atmIfIlmiAutoConfiguration and atmIfIlmiKeepAlive. |
 |
Note The configuration takes effect only on the next interface restart. |
The More Configuration tab (Figure 5-33) is divided into two panels: Information Element Transfer, and Actions.
 |
Note To commission the selected interface port, see the "Commissioning an NRP or NLC Interface Port" section for further details. |
To view the More Configuration tab, follow these steps:
Step 2 Click the More Configuration tab (Figure 5-33).
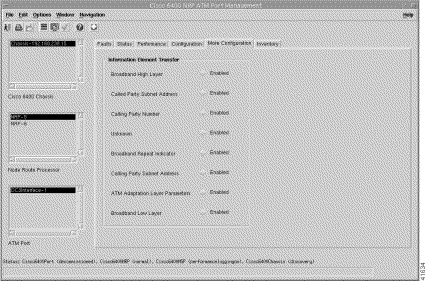
Step 3 Choose a relevant Chassis, NRP, and ATM Port. The configuration information for the selected ATM port appears (Figure 5-33).
Step 4 Change the information as required.
Step 5 Save the changes.
The Information Element Transfer panel allows you to configure the following information:
 |
Note When the IE action flag is set to one, the IE action indicator should be followed regardless of the configuration. |
The Inventory tab displays a single panel. To view the Inventory tab, follow these steps:
Step 2 Click the Inventory tab. The Cisco 6400 NRP ATM Port Management window (Figure 5-34) appears.
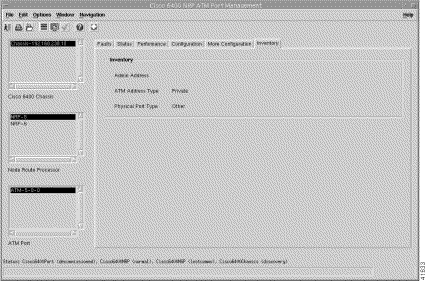
Step 3 Choose a relevant Chassis, NRP, and ATM Port.
The Inventory information displays for the selected ATM Port.
The Inventory panel displays the following information:
The Cisco 6400 Line Card Management window displays a single Line Card tab. The Cisco 6400 SCM supports OC-3, OC-12, and DS3 line modules.
 |
Note To commission a selected NLC, see the "Commissioning an NSP, NRP, NRP2, or NLC Module" section for further details. |
From a relevant object icon or from an object list, right-click Cisco 6400 UAC > Module > Manage > NLC option. (See Table 5-1 for information on which objects allow you to launch the Cisco 6400 Line Card Management window.) The Cisco 6400 Line Card Management window (Figure 5-35) appears with the Line Card tab displayed. The Line Card tab is divided into four panels: Status, Configuration, Inventory, and Actions.
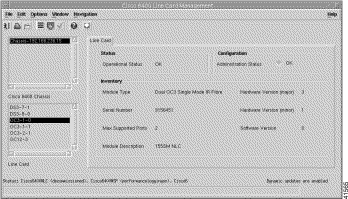
To view the Line Card tab, follow these steps:
Step 2 Choose a relevant Chassis and Line Card. Status information for the selected NLC appears.
The Line Card tab displays the Status, Configuration, and Inventory panels.
The Status panel displays the operational status of the NLC.
The Configuration panel allows you to configure administration information.
The Administration Status option allows you to enable, disable, or reset the module. You can set the Administration Status option to:
The Inventory panel displays the following information:
The Cisco 6400 Line Card ATM Port Management window displays six tabs: Faults, Status, Performance, Configuration, More Configuration, and Inventory.
 |
Note To commission the selected NLC ATM Port Interface, see the "Commissioning an NRP or NLC Interface Port" section for further details. |
From a relevant object icon or from an object list, right-click Cisco 6400 UAC > Port > Manage > NLC ATM Port option. (See Table 5-1 for information on which objects allow you to launch the Cisco 6400 Line Card ATM Port Management window.) The Cisco 6400 Line Card ATM Port Management window (Figure 5-36) appears with the Faults tab displayed.
 |
Note To commission the selected NLC ATM Port Interface, see the "Commissioning an NRP or NLC Interface Port" section for further details. |
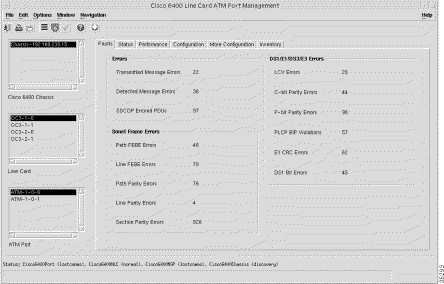
To view the Faults tab, follow these steps:
Step 2 Choose a relevant Chassis, Line Card, and ATM Port. The fault information for the selected ATM port appears (Figure 5-36).
The Faults tab displays the following panels:
The Errors panel displays the following error information:
The SONET Frame Errors panel displays the following error information:
The DS1/E1/DS3/E3 Errors panel displays the following error information:
Step 2 Click the Status tab. The Status panels (Figure 5-37) appear.
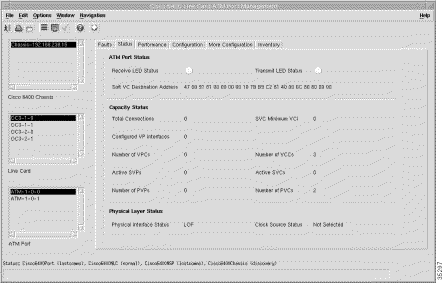
Step 3 Choose a relevant Chassis, Line Card, and ATM Port. The status information for the selected ATM port appears.
The ATM Port Status section displays the following status information:
The Capacity Status section displays the following information:
The Physical Layer Status panel displays the following status information:
The Performance tab (Figure 5-38) is divided into four panels: Transmitted, Connections Established, Detected, and SSCOP. To view the Performance tab, follow these steps:
Step 2 Click the Performance tab. The performance-related panels (Figure 5-38) appear.
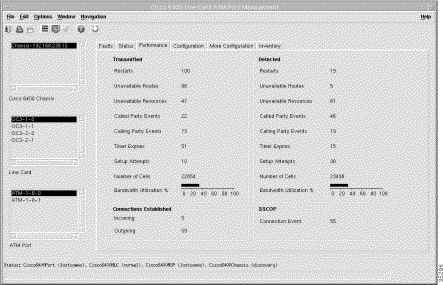
Step 3 Choose a relevant Chassis, Line Card, and ATM Port. The performance information for the selected ATM port appears.
The Transmitted panel displays the following performance information:
| Cause Value | Meaning |
17 | User busy |
18 | No user responding |
21 | Call rejected |
22 | Number changed |
23 | User rejects all calls with calling line ID restriction (CLIR) |
27 | Destination out of order |
31 | Normal, unspecified |
88 | Incompatible destination |
 |
Note Cause values apply to both UNI 3.0 and UNI 3.1. |
| Cause Value | Meaning |
17 | User busy |
18 | No user responding |
21 | All rejected |
22 | Number changed |
23 | User rejects all calls with calling line ID restriction (CLIR) |
27 | Destination out of order |
31 | Normal, unspecified |
88 | Incompatible destination |
 |
Note Cause values apply to both UNI 3.0 and UNI 3.1. |
| Cause Value | Meaning |
28 | Invalid number format (address incomplete) |
43 | Access information discarded |
57 | Bearer capability not authorized |
65 | Bearer capability not implemented |
73 | Unsupported combination of traffic parameters |
78 | AAL parameters cannot be supported (UNI 3.1 only) |
91 | Invalid transit network selection |
93 | AAL parameters cannot be supported (UNI 3.0 only) |
 |
Note Cause values apply to both UNI 3.0 and UNI 3.1. |
 |
Note Receive and Transmit Utilization gauges are displayed from a subscriber's point of view; that is, the Transmit Utilization value shows the number of cells per second the subscriber is transmitting and the Receive Utilization value shows the number of cells per second the subscriber is receiving. |
The Connections Established panel displays the following performance information:
The Detected panel displays the following performance information:
| Cause Value | Meaning |
1 | Unallocated (unassigned) number |
1 | No route to specified transit network |
3 | No route to destination |
88 | Incompatible destination |
 |
Note Cause values apply to both UNI 3.0 and UNI 3.1. |
| Cause Value | Meaning |
35 | Requested VPCI/VCI not available |
37 | User cell rate not available (UNI 3.1 only) |
38 | Network out of order |
41 | Temporary failure |
45 | No VPCI/VCI available |
47 | Resource unavailable, unspecified |
49 | Quality of service unavailable |
51 | User cell rate not available (UNI 3.0 only) |
58 | Bearer capability not currently available |
63 | Service or option not available, unspecified |
92 | Too many pending add party requests |
 |
Note Cause values apply to both UNI 3.0 and UNI 3.1 unless otherwise stated. |
| Cause Value | Meaning |
17 | User busy |
18 | No user responding |
21 | All rejected |
22 | Number changed |
23 | User rejects all calls with calling line ID restriction (CLIR) |
27 | Destination out of order |
31 | Normal, unspecified |
88 | Incompatible destination |
 |
Note Cause values apply to both UNI 3.0 and UNI 3.1. |
| Cause Value | Meaning |
28 | Invalid number format (address incomplete) |
43 | Access information discarded |
57 | Bearer capability not authorized |
65 | Bearer capability not implemented |
73 | Unsupported combination of traffic parameters |
78 | AAL parameters cannot be supported (UNI 3.1 only) |
91 | Invalid transit network selection |
93 | AAL parameters cannot be supported (UNI 3.0 only) |
 |
Note Cause values apply to both UNI 3.0 and UNI 3.1. |
 |
Note Receive or Transmit Utilization gauges are displayed from a subscriber's point of view; that is, the Transmit Utilization value shows the number of cells per second that the subscriber is transmitting and the Receive Utilization value shows the number of cells per second that the subscriber is receiving. |
The SSCOP panel displays the following performance information:
The Configuration tab (Figure 5-39) is divided into two panels: ATM Port Configuration and ILMI Configuration.
 |
Note To Commission the selected NRP ATM Port Interface, see the "Commissioning an NRP or NLC Interface Port" section for further details. |
To view the Configuration tab, follow these steps:
Step 2 Click the Configuration tab. The configuration-related panels (Figure 5-39) appear.
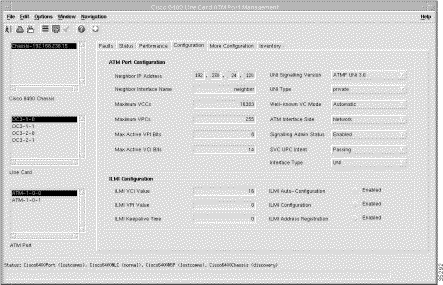
Step 3 Choose a relevant Chassis, Line Card, and ATM Port. The configuration information for the selected ATM port appears.
Step 4 Change the information using the dropdown lists. See the following sections for more information.
The ATM Port Configuration panel allows you to configure the following information:
 |
Note The value of the object can be obtained in different ways; for example, by manual configuration or through ILMI interaction with the neighbor system. |
 |
Note Setting UNI Signaling Version to a value of Not Applicable is not allowed. To modify the ciscoAtmIfUniSignalingVersion, ifAdminStatus has to be down and atmIfIlmiAutoConfiguration disabled. |
 |
Note When ciscoAtmIfType is not UNI, then the UNI type value should be ignored. |
 |
Note To modify ciscoAtmIfSignalingAdminStatus, ifAdminStatus has to be down. |
 |
Note Values other than Passing are allowed only when policing is supported on the interface. This also serves to determine which UPC to use on the terminating (destination) half-leg of Soft PVCs. For the CPU interface or logical ports on the LS1010, only the Passing value is supported. |
 |
Note To modify the ciscoAtmIftype, ifAdminStatus has to be down and atmIfIlmiAutoConfiguration disabled. |
The ILMI Configuration panel allows you to configure the following information:
 |
Note This configuration takes effect only on the next interface restart. |
 |
Note The configuration takes effect only on the next interface restart. Disabling this object also disables atmIfIlmiAddressRegistration and atmIfIlmiAutoConfiguration and atmIfIlmiKeepAlive. |
 |
Note This configuration takes effect only on the next interface restart. |
Step 5 Save the changes.
The More Configuration tab (Figure 5-40) is divided into four panels: Information Element Transfer, Actions, General Physical Layer Configuration, and DS1/E1/DS3/E3 Physical Layer Configuration.
 |
Note To commission the selected NRP ATM Port Interface, see the "Commissioning an NRP or NLC Interface Port" section for further details. |
To view the More Configuration tab, follow these steps:
Step 2 Click the More Configuration tab. The configuration-related panels (Figure 5-40) appear.
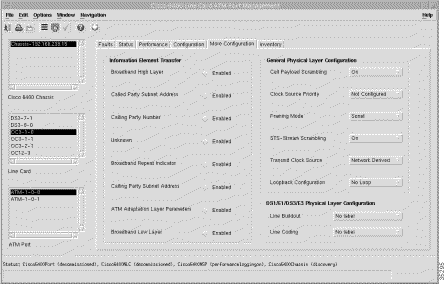
Step 3 Choose a relevant Chassis, Line Card, and ATM Port. The configuration information for the selected ATM port appears.
The Information Element Transfer panel allows you to configure the following information:
 |
Note When the IE action flag is set to one, the IE action indicator should be followed regardless of this configuration. |
The General Physical Layer Configuration panel allows you to configure the following information:
 |
Note notConfigured indicates this interface is not configured as a network clock source. |
The DS1/E1/DS3/E3 Physical Layer Configuration section allows you to configure the following information:
 |
Note When Framing Mode is not set to DS1 or E1 the data entry box next to Line Coding is blank and you cannot edit the field. |
Step 4 Change the information.
Step 5 Save the changes.
To view the Inventory tab, follow these steps:
Step 2 Click the Inventory tab. The Inventory panel (Figure 5-41) appears.
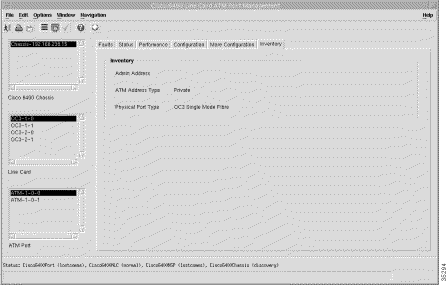
Step 3 Choose a relevant Chassis, Line Card, and ATM Port. The Inventory information appears for the selected ATM port.
The Inventory panel displays the following information:
The Operations, Administration, and Maintenance (OA&M) loopback feature is used to verify connectivity between devices in the network, or connectivity through the entire network. The loopback feature enables you to find faults by looping a signal at various points in the network.
Two types of loopback tests are provided so you can test connectivity between a subscriber connection on the Cisco 64000 UAC and a neighboring switch, or a device at the other end of the network:
 |
Note Multiple services ordered by a subscriber are delivered over a single dedicated line (the subscriber connection). When you run the loopback test, the test checks the connectivity for all of the services delivered to the subscriber. |
If the cells loop back successfully, the network path between the local end and the far end is assumed to be good. If the cells do not loop back successfully, there is a problem. The loopback test also determines how long it took the cells to reach the far end and return, and the number of cells that were successfully looped back.
To run an SCM OA&M loopback test, follow these steps:
a. Right click on the ATM module that the subscriber connection uses and select Cisco 6400 UAC > Subscriber > Configure Subscriber option. The Subscriber Configuration window appears (see Figure 8-92).
b. In the left column, select the subscriber.
c. Under Connection Details, select the subscriber connection you want to test.
d. Write down the values in the Subscriber VPI and Subscriber VCI fields. You need to know these values to set up the loopback test.
Step 2 In Map Viewer, locate the chassis that supports the subscriber connection you want to test.
Step 3 Right-click on the chassis and select Cisco 6400 UAC > Port > Manage > Cisco OAM Loopback option. The Cisco Operation Administration and Maintenance Loopback window appears (Figure 5-42).
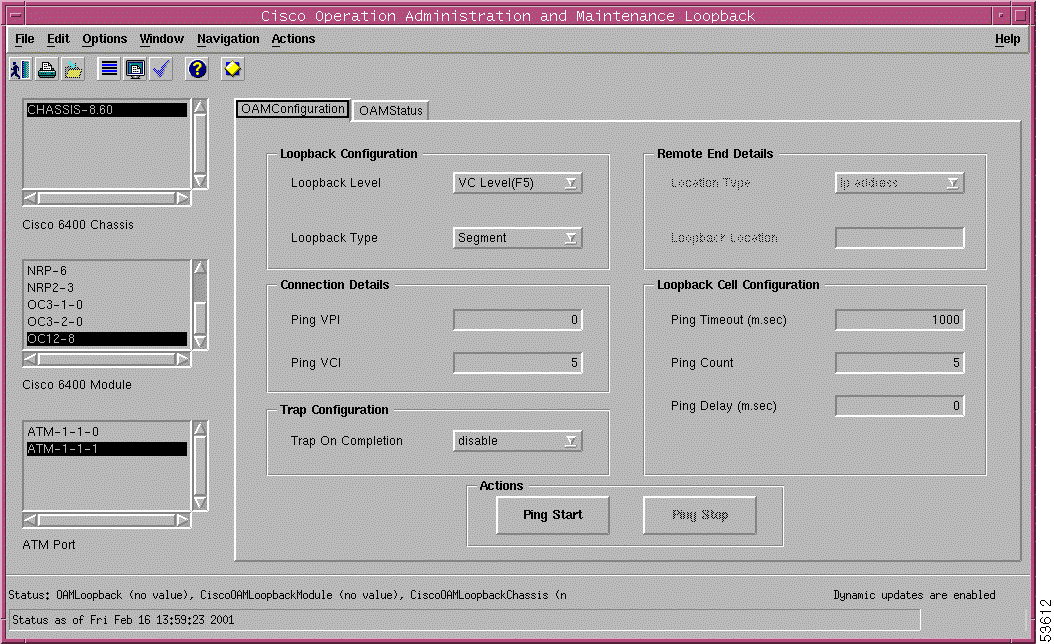
Step 4 Select the module and ATM port supporting the subscriber connection you want to test.
Step 5 Set up the loopback-test parameters (see the "OAM Configuration Tab" section for detailed field descriptions).
a. For Loopback Level, specify whether to test the virtual path (VP) or the virtual connection (VC).
b. For Loopback Type, select the type of loopback test to run: segment or end-to-end.
c. For Ping VPI and Ping VCI, specify the VPI and VCI values for the subscriber connection you are testing:
d. For Trap Configuration, specify whether to send notification when the loopback test is finished.
e. For end-to-end loopback tests, use the Location Type and Loopback Location fields to identify the remote end for the loopback test. For segment loopback tests, this is not necessary.
f. Use the Loopback Cell Configuration fields to specify how many OA&M cells to send during the test, and to define the time intervals for sending the cells or considering a cell to have failed.
Step 6 Click Ping Start to initiate the loopback test. The test runs until the specified number of OA&M test cells have been sent, or until you click Ping Stop.
Step 7 Click the OAM Status tab to view the test results (see the "OAM Status Tab" section).
Step 8 To stop the loopback test before it completes, click Ping Stop.
Use the OAM Configuration tab (see Figure 5-43) of the Cisco Operation, Administration, and Maintenance Loopback window to define the OA&M loopback test configuration and endpoints. To display the Cisco Operation, Administration, and Maintenance Loopback window, right-click on the ATM module that supports the subscriber connection you want to test and select Cisco 6400 UAC > Port > Manage > Cisco OAM Loopback option.

The Loopback Configuration fields define the type of loopback test to run.
These fields identify the subscriber connection to test.
This field specifies what SCM should do when the loopback test is over.
These fields identify the remote endpoint for an end-to-end loopback test. The fields are not valid for segment loopback tests.
Use the OAM Status tab (Figure 5-44) of the Cisco Operation, Administration, and Maintenance Loopback window to view the loopback test results. To display the Cisco Operation, Administration, and Maintenance Loopback window, right-click on the ATM module that supports the subscriber connection being tested and select Cisco 6400 UAC > Port > Manage > Cisco OAM Loopback option.
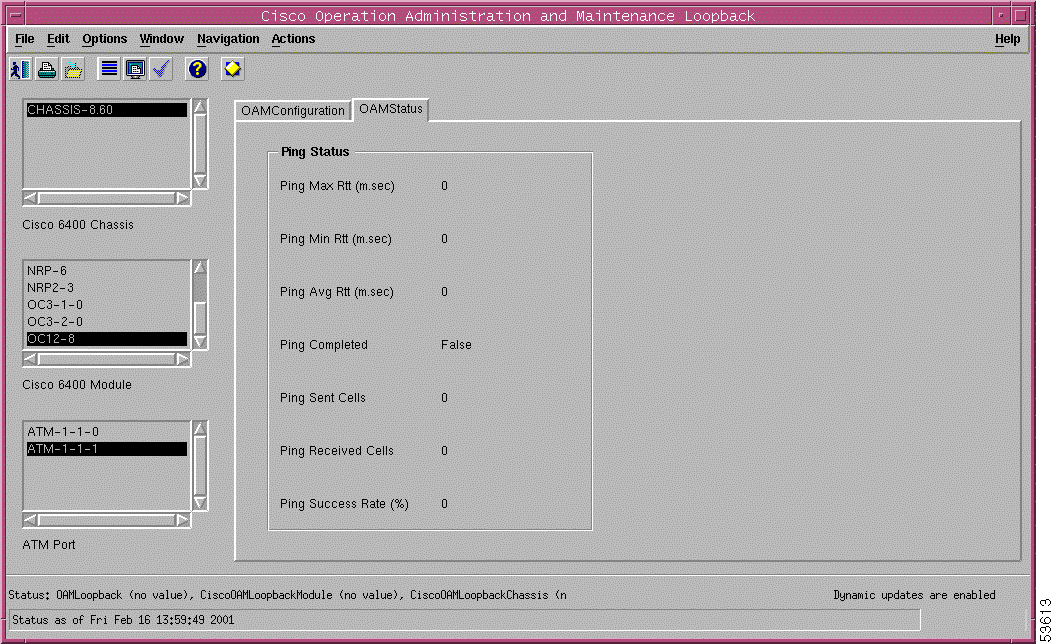
 |
Note The Rtt fields describe round-trip time, which is the length of time it takes a cell to travel to the far end and return. |
The SONET APS window is divided into two tabbed sections: Statistics and Configuration. These tabs allow you to view the statistics for SONET devices and configure the SONET automatic protection switching between SONET devices.
From a relevant object icon or from an object list, right-click Cisco 6400 UAC > Port > Manage > SONET APS option. (See Table 5-1 for information on which objects allow you to launch the SONET APS window.) The SONET APS window appears with the Statistics tab displayed (Figure 5-45).
 |
Note The SONET APS window (Statistics tab) only populates when redundancy is configured on the device. Redundancy must be configured manually using Cisco IOS. See "Configuring Redundancy in a Cisco 6400 Chassis" section for further information on configuring redundancy. |
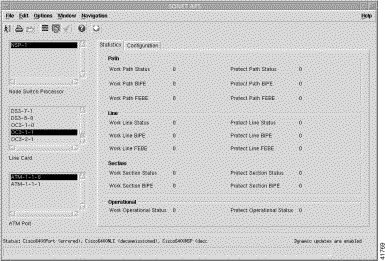
The Statistics tab (Figure 5-45) displays four panels: Path, Line, Section, and Operational. To view the SONET APS statistics for a specified port, follow these steps:
Step 2 Choose a relevant NSP, Line Card, and ATM Port.
The statistics for the selected ATM port appear in the Path, Line, Section, and Operational panels (Figure 5-45).
The Path panel displays the following information:
1 | sonetPathNoDefect |
2 | sonetPathSTSAIS |
3 | sonetPathSTSRDI |
4 | sonetPathSTSLOP |
5 | sonetBIPE(BIP-8) |
6 | sonetFEBE |
7 | sonetPathUnequipped |
8 | sonetPathSignalLabelMismatch |
1 | sonetPathNoDefect |
2 | sonetPathSTSLOP |
4 | sonetPathSTSAIS |
8 | sonetBIPE(BIP-8) |
16 | sonetFEBE |
32 | sonetPathSTSRDI |
64 | sonetPathUnequipped |
128 | sonetPathSignalLabelMismatch |
The Line panel displays the following information:
1 | sonetLineNoDefect |
2 | sonetLineAIS |
3 | sonetLineRDI |
4 | sonetBIPE(BIP-8/24) |
5 | sonetFEBE |
1 | sonetLineNoDefect |
2 | sonetLineAIS |
4 | sonetLineRDI |
8 | sonetBIPE(BIP-8/24) |
16 | sonetFEBE |
The Section panel displays the following information:
1 | sonetSectionNoDefect |
2 | sonetSectionLOS |
3 | sonetSectionLOF |
4 | sonetBIPE(BIp-8) |
1 | sonetSectionNoDefect |
2 | sonetSectionLOS |
4 | sonetSectionLOF |
8 | sonetBIPE(BIp-8) |
The Operational panel displays the following information:
To change SONET APS configuration information for a specified port, follow these steps:
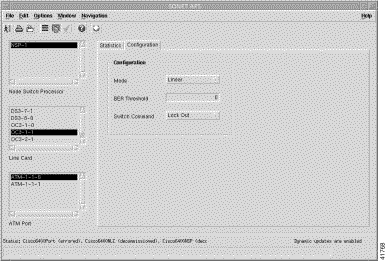
Step 2 Click the Configuration tab.
Step 3 Choose a relevant NSP, Line Card, or ATM Port. The configuration information for the selected ATM port appears (Figure 5-46) in the configuration panel.
Step 4 Configure the information displayed.
Step 5 Save any changes made.
The Configuration panel allows you to view and configure the following parameters:
Redundancy configuration allows you to specify the redundancy pairings for CPUs (NSPs), slots (NRPs and OC-12 NLC), and subslots (OC-3 and DS-3 NLCs). Redundancy configuration is not supported in the current release of the Cisco 6400 SCM application. Redundancy can be set up manually, however, using Cisco IOS commands.
 |
Note The SONET APS window (see Figure 5-45) will only populate when redundancy is configured on the device. |
To configure any of the redundancy parameters on the NSP, follow these steps:
Step 2 Release the mouse button. A Telnet window appears (Figure 5-47).
Step 3 Enter a password at the prompt:
<yourpassword>
The NSP prompt appears.
Step 4 Enter enable mode:
enable
Step 5 Enter the enable password at the prompt:
<enablepassword>
Step 6 Enter configuration mode:
NSPprompt# configure terminal
Step 7 Enter redundancy mode:
NSPprompt(config)#redundancy
The next step is to configure the main CPU parameters on the NSP.
Step 8 Enter main-cpu mode:
NSPprompt(config-r)#main-cpu
Step 9 To configure the autosync elements:
NSPprompt(config-r-mc)#auto-sync <startup-config> <config-register> <bootvar> <standard>
 |
Note Adding on to the command any of the optional (<>) parameters will set this parameter on the NSP. |
Step 10 Enter the slot numbers to configure slot redundancy:
NSPprompt(config-r)#associate slot x y
 |
Note When entering the slots to be associated, the slot numbers (x and y) must be adjacent and the first slot must be an odd-numbered slot; for example, slot 1 + 2 is valid, but slot 2 + 3 is invalid. The x and y must be integer values between 1 and 8. |
Step 11 Enter the subslot numbers (adhering to the same numbering restrictions as for slot numbers) to configure subslot redundancy:
NSPprompt(config-r)#associate subslot <slot>/<card> <slot>/<card>
 |
Note To deconfigure any of the settings described earlier, prefix the command with "no"; for example, NSPprompt(config-r)#no associate subslot <slot>/<card> <slot>/<card> |
The Interface Configuration window allows you to carry out part of the configuration for the NRP and NLC interface ports in a selected chassis. You can then commission or decommission the selected interface port.
Each port interface (that is, NRP, NRP2, or NLC) has a port management window where additional port interface configuration can be carried out (either before or after commissioning the selected port interface). For example, you might want to configure parameters in the Cisco 6400 Line Card ATM Port Management window before commissioning the NLC interface port using the Interface Configuration window.
From a relevant object icon or from an object list, right-click Cisco 6400 UAC > Port > Manage > Configuration option. (See Table 5-1 for information on which objects allow you to launch the Interface Configuration window.) The Interface Configuration window appears with the Configuration tab displayed (Figure 5-48).
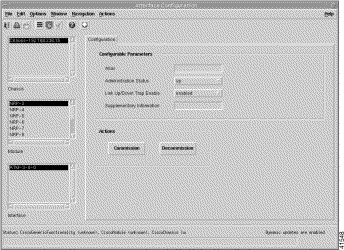
The Module list displays half-height modules (OC-3 or DS3 NLCs) with a slot and subslot number displayed (for example, OC-3-8-0). Full-height modules (NSPs, NRPs, NRP2s, or OC-12 NLCs) are displayed as a module with a slot number (for example, NRP-5). When selecting a module from the list, you must first identify the module's location in the chassis and then choose the module according to its slot location in the rack.
The Interface list displays a list of the interfaces for the selected chassis and module (that is, NSP, NRP, NRP2, or NLC). The Interface list displays half-height modules (OC-3 or DS3 NLCs) with a slot, subslot and port number (for example, ATM-8-0-0). Full-height modules (NSPs, NRPs, NRP2s, or OC-12 NLCs) are displayed as a module with a slot number, subslot number, and port number (for example, ATM-1-0-0).
The Configurable Parameters panel displays the following information:
The Actions panel allows you to commission or decommission the selected interface:
Step 2 Choose the relevant Chassis, Module, and Interface from the lists displayed at the left side of the window. The Status of the selected module appears at the bottom left corner of the window.
 |
Note The NSP module resides in Slot 0 in the chassis. Do not attempt to commission an NSP module. |
Step 3 Configure the parameters displayed in the Configurable Parameters panel.
Step 4 Click Commission when the status is Decommissioned.
The NRP, NSP, or NLC interface is now commissioned. Its state changes to Commissioning and then Normal.
Step 2 Choose the relevant Chassis, Module, and Interface from the lists displayed at the left side of the window. The status of the selected module appears at the bottom left corner of the window.
Step 3 Click Decommission when the status is Normal. The NRP, NSP or NLC is now decommissioned. Its state changes to Decommissioned.
The Interface Performance window displays performance attributes for the selected interface and allows you to Start or Stop performance logging for the selected interface.
 |
Note Performance logging can start or stop on a module or global basis for a selected chassis. See the "Chassis Configuration Window" section for details on how to start or stop global performance logging for a selected chassis. See the "Module Configuration Window" section for details on how to start or stop global performance logging on a per-module basis. |
From a relevant object icon or from an object list, right-click Cisco 6400 UAC > Port > Manage > Performance option. (See Table 5-1 for information on which objects allow you to launch the Interface Performance window.) The Interface Performance window appears with the Performance (1) tab displayed (Figure 5-49).
 |
Note The NRP2 displays in the Module list on the Interface Performance window. |
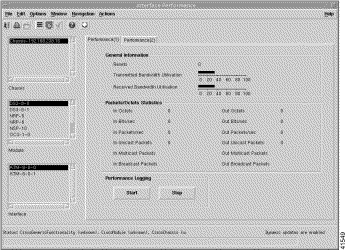
To begin performance logging for a selected interface, follow these steps:
Step 2 Choose the relevant Chassis, Module, and Interface from the lists displayed at the left side of the window.
Step 3 Click Start to begin performance logging for the selected interface. A window appears for you to confirm that you want to start performance logging.
Step 4 Click Yes to begin performance logging for the selected interface.
 |
Note Click the Performance (2) tab to view Error Statistics information for the selected interface. |
To stop performance logging for a selected interface, follow these steps:
Step 2 Choose the relevant Chassis, Module, and Interface from the lists displayed at the left side of the window.
Step 3 Click Stop to stop performance logging for the selected interface. A window appears for you to confirm that you want to stop performance logging.
Step 4 Click Yes to stop performance logging for the selected interface.
The Interface Status window displays status information for the selected interface.
From a relevant object icon or from an object list, right-click Cisco 6400 UAC > Port > Manage > Status option. (See Table 5-1 for information on which objects allow you to launch the Interface Status window.) The Interface Status window appears with the Status tab displayed (Figure 5-50). The Status tab displays three panels: Interface Details, Last Change Details, and Transmission Details.
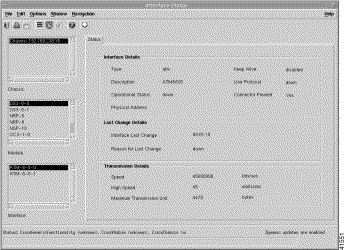
To view the Status tab, follow these steps:
The Status tab appears.
Step 2 Choose the relevant Chassis, Module, and Interface from the lists displayed at the left side of the window.
The Status tab displays the following panels.
The Interface Details panel displays the following information:
The Last Change Details panel displays the following information:
The Transmission Details panel displays the following information:
The Management Information window allows you to set system configuration information for a selected chassis and IOS command line security information. The Management Information window (Figure 5-51) displays two tabs: Configuration and IOS/Command Line Security
From a relevant object icon or from an object list, right-click Cisco 6400 UAC > Chassis > Admin > Management Information option. (See Table 5-1 for information on which objects allow you to launch the Management Information window) The Management Information window (Figure 5-51) appears with the Configuration tab displayed.
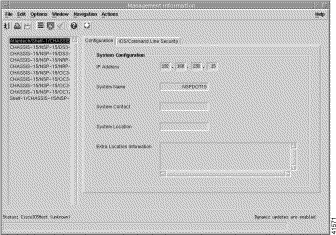
The Configuration tab displays the System Configuration panel.
The System Configuration panel allows you to configure the following parameters:
To configure system configuration and IOS/command line security information, follow these steps:
Step 2 Choose the relevant Chassis from the lists displayed at the left side of the window.
Step 3 Configure the parameters displayed in the Configuration tab.
Step 4 Click the IOS/Command Line Security tab.
Step 5 Configure the parameters displayed in the Security Details panel.
The Security Details panel allows you to view and configure the following parameters:
Step 6 Click Save Locally to save the configuration information.
The IOS Image Download window displays a single Download tab. The Download tab allows you to configure download parameters and initiate a Cisco 6400 firmware or Cisco IOS release download to one or more user-selected NSPs and NRPs at a user-specified time.
 |
Caution IOS image download is available on a chassis and modules. Care is required when selecting a chassis or NRP from the IOS Host list. When a chassis or NLC is selected (in the IOS Host list) the IOS image is downloaded to the NSP, and when an NRP is selected (in the IOS Host list) the image is downloaded to the NRP. |
 |
Note The NSP controls and manages the NRP2 image download process. It is recommended that you store all NRP2 images on the NSP PCMCIA disk. |
From a relevant object icon or from an object list, right-click Cisco 6400 UAC > Module > Admin > IOS Image Download option. (See Table 5-1 for information on which objects allow you to launch the IOS Image Download window.)
The IOS Image Download window appears with the Download tab displayed. The Download tab (Figure 5-52) displays three panels: Configuration, Status, and Actions.
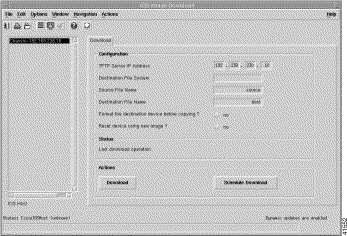
The Configuration panel allows you to view and configure the following parameters:
The Status panel displays the Last download operation (this displays the date and time of the last download).
The Actions panel allows you to initiate the following actions:
To initiate a download, follow these steps:
Step 2 Choose an IOS Host (that is, an NSP). The download information appears.
 |
Caution IOS image download is available on a chassis and modules. Care is required when you choose a chassis or NRP from the IOS Host list. When a chassis or NLC is selected (in the IOS Host list) the IOS image is downloaded to the NSP, and when an NRP is selected (in the IOS Host list) the image is downloaded to the NRP. |
Step 3 Configure the parameters displayed in the Configuration panel.
Step 4 Click Download to download the Cisco IOS image (specified by the Source File Name in the Configuration panel) from the specified TFTP server to the file system of the Cisco 6400 (specified in the Destination File Name in the Configuration panel).
To schedule a Cisco IOS image download, follow these steps:
Step 2 Choose an IOS Host. The download information appears.
 |
Caution IOS image download is available on a chassis and modules. Care is required when selecting a chassis or NRP from the IOS Host list. When a chassis or NLC is selected (in the IOS Host list) the IOS image is downloaded to the NSP, and when an NRP is selected (in the IOS Host list) the image is downloaded to the NRP. |
Step 3 Configure the parameters displayed in the Configuration panel.
Step 4 Click Scheduled Download. The Schedule Dialog window appears (Figure 5-53). The Schedule Dialog window allows you to enter a Date (in <mm><dd><yyyy> format) and time (hh:mm) for the download to be performed.
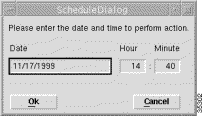
Step 5 Enter a Date (mm/dd/yyyy) and time (hh:mm) for the download to take place automatically. Click Ok to save the new date and time. An Action Report window appears. The Action Report window details the Cisco IOS commands executed. Invalid Cisco IOS commands result in a failure to download.
Step 6 Check the details in the Action Report window to ensure that the scheduled download was set up successfully.
Step 7 Click Save to save the Action Report, if required.
Step 8 Click Close to close the Action Report window and return to the Cisco IOS Image Download window.
Step 9 Click Close from the File menu to close the Cisco IOS Image Download window.
 |
Caution The User Name, Login Password, and Exec Password parameters (set in the Management Information window in the IOS Command Line Security tab) must be identical to the CLI Passwords set in the Cisco 6400 NSP Management window (Configuration tab). See the "Cisco 6400 NSP Management Window" section and the "Management Information Window" section for further details on setting the User Name, Login Password, and Exec Password parameters. IOS Image Download and Backup/Restore fail when the username and passwords are not identical. |
The Configuration Backup/Restore window allows you to upload the current Cisco 6400 SCM running configuration from a specified Cisco 6400 UAC and save it as a file to any Trivial File Transfer Program (TFTP) server. Later you can download this file from the specified TFTP server to a user specified Cisco 6400 UAC.
Regular configuration backups allow recovery if hardware fails. For example, if an NRP were to fail, a replacement NRP could be inserted into the chassis and the configuration data would be restored. Changes in configuration data between the last backup and the time of the failure would be lost.
 |
Note The backup/restore mechanism is not intended as a "configuration upload and manipulation" facility permitting configuration of the Cisco 6400 UAC (for example, through Cisco IOS, followed by subsequent management by the Cisco 6400 SCM). |
 |
Note Refer to the "Setting Up a Workstation As a TPTP Server" section in the Cisco 6400 Service Connection Manager Installation Guide. |
 |
Note Backup and Restore is on a per-chassis basis. When all NRP and NSP configurations are backed up when the Restore button is pressed the configuration is copied onto the Cisco 6400 UAC. Selecting the Restore button initiates the action of restoring the running configuration to a Cisco 6400 UAC. |
From a relevant object icon or from an object list, right-click Cisco 6400 UAC > Module > Admin > Configuration Backup/Restore option. (See Table 5-1 for information on which objects allow you to launch the Configuration Backup and Restore window.) The Configuration Backup/Restore window appears with the Backup/Restore tab displayed (Figure 5-54).
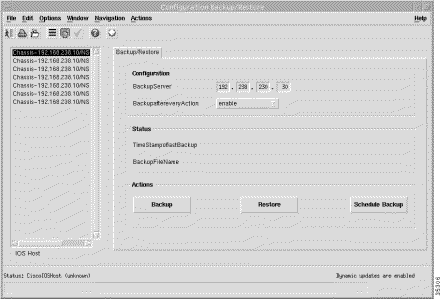
To initiate a backup, follow these steps:
Step 2 Choose a relevant Chassis. The Backup information for the Cisco 6400 SCM appears in the Configuration and Actions panels.
Step 3 Click Backup to begin the backup. The Action Report window appears (Figure 5-55).
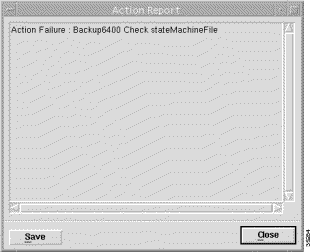
The Action Report window details the Cisco IOS commands executed when the service is commissioned. Invalid Cisco IOS commands result in a failure to commission the service.
Step 4 Check the details in the Action Report window to ensure that the backup was successful.
Step 5 Click Save to save the Action Report, if required.
Step 6 Click Close to close the Action Report window and return to the Configuration Backup/Restore window.
Step 7 Click Close from the File menu to close the Configuration Backup/Restore window.
The Configuration panel allows you to view and configure the following parameters:
 |
Note This option (when enabled) automatically backs up the Cisco 6400 after every: Service Instance "Commission" operation, and connect or disconnect operation. The default setting for Backup after every Action is "disable." |
The Status panel displays the following parameters:
The Actions panel allows you to:
To initiate a restore, follow these steps:
Step 2 Choose a relevant Chassis. The backup/restore information for the Cisco 6400 SCM appears.
Step 3 Click Restore to begin the backup. An Action Report window appears. The Action Report window details the Cisco IOS commands executed when the service is commissioned. Invalid Cisco IOS commands result in a failure to commission the service.
Step 4 Check the details in the Action Report window to ensure that the restore was successful.
Step 5 Click Save to save the Action Report, if required.
Step 6 Click Close to close the Action Report window and return to the Configuration Backup/Restore window.
Step 7 Click Close from the File menu to close the Configuration Backup/Restore window.
To schedule a backup, follow these steps:
Step 2 Choose a relevant IOS Host. The backup/restore information for the Cisco 6400 SCM appears.
Step 3 Click Schedule Backup to schedule a date and time for the backup to take place. The Schedule window appears (Figure 5-56).

Step 4 Enter a Date (mm/dd/yyyy) and time (hh:mm) for the scheduled backup to take place automatically. Click Ok to save the new date and time. An Action Report window appears. The Action Report window details the Cisco IOS commands executed when the service is commissioned. Invalid Cisco IOS commands result in a failure to commission the service.
Step 5 Check the details in the Action Report window to ensure that the scheduled backup was set up successfully.
Step 6 Click Save to save the Action Report, if required.
Step 7 Click Close to close the Action Report window and return to the Configuration Backup/Restore window.
Step 8 Click Close from the File menu to close the Configuration Backup/Restore window.
You can launch a Telnet session from an icon representing a Chassis, NSP, or NRP in the MapViewer application.
 |
Note From an NRP2 object, the menu option Cisco 6400 UAC > Tools > Initiate Telnet Service does not initiate a Telnet session to the NRP2. Instead, a Telnet session is launched to the NSP. To Telnet to an NRP2, launch a Telnet session from the NSP. |
To launch a Telnet session, follow these steps:
Step 2 Release the mouse button. A Telnet window appears.
Step 3 Enter the required password. Refer to the Cisco 6400 UAC Software Configuration Guide for further Telnet information.
You can launch Netscape and open the URL representing the home page of the embedded NSP or NRP HTTP server application (known as the WebConsole) from an icon representing an NSP or NRP in the MapViewer application.
To launch the WebConsole application, follow these steps:
Step 2 Release the mouse button. A password window appears. Enter the required user ID and password.
A window appears providing access to the Cisco WebConsole product. Refer to the Cisco 6400 UAC Software Configuration Guide for further information on WebConsole.
![]()
![]()
![]()
![]()
![]()
![]()
![]()
![]()
Posted: Mon Jan 7 17:07:33 PST 2002
All contents are Copyright © 1992--2002 Cisco Systems, Inc. All rights reserved.
Important Notices and Privacy Statement.