|
|

Table Of Contents
Using the Cisco Service Control Application Reporter
Navigating in the Reporter: Views
Using the Cisco Service Control Application Reporter
This chapter explains how to use the Cisco Service Control Application Reporter (SCA Reporter) GUI, which includes navigating and configuring.
•
Navigating in the Reporter: Views
Navigating in the Reporter: Views
You can navigate to template groups, report templates, and report instances in the Templates view. When you select an item in the Templates view, the Properties view shows its properties.
When you generate a report, a report view opens and the Properties view shows the chart display properties of the report. To view the report instance properties, select the report instance in the Templates view. If necessary, you can locate the report instance that generated the report by choosing the drop-down menu item Go to report.
Each report view has the name of the report instance that generated the view. For example, a report may be named Global Bandwidth per Service #1. You can rename the report instance in the Templates view.
By default, each report view shows the chart of the report. You can view the raw data by clicking the Table tab.
Viewing Menu Items
The GUI has a drop-down menu for each view, which displays all available actions for that view. Some commonly used actions have icons for easy navigation.
The GUI also has a popup menu for each view. Right-click the tab of a view, and select an option to personalize the layout of the SCA Reporter window. Some of the available actions are:
•
•
•
Configuring Properties
Before generating a report, you can modify the values of the report instance properties. The new values are saved and applied the next time the report is generated.
You can also modify the values of chart display properties. For chart display properties, the value is applied at once.
Types of properties include:
•
(not set).
•
•
•
icon to open a Choose Date and Time dialog box.
•
icon to open a drop-down menu.
•
The icons of the Multiple Choice dialog box are described in the following table.
Note
Note
Properties View
The Properties view always shows the properties of the item that is selected in the view in focus. You can control how the properties are displayed by clicking on one of the following buttons:
•

( Show Categories)—To view the properties with or without their categories
•

( Show Advanced Properties)—To view all properties or only basic properties
•

( Restore Default Value)—To reset a selected property to its default value:
–
–
–
To change the value of a property, select the property and reconfigure it (see "Managing Report Instances" and "Working with Reports" ). Then re-execute the report instance so that the new report will appear with the new configuration.
The following example uses the "Package Bandwidth per Service" report template.
•
How to Change the Display of Properties in the Properties View
DETAILED STEPS
Step 1
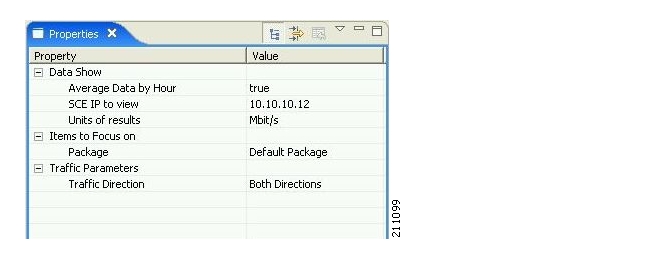
The Properties view displays the report instance properties.
Figure 3-1
By default, the property categories are displayed and advanced properties are not displayed.
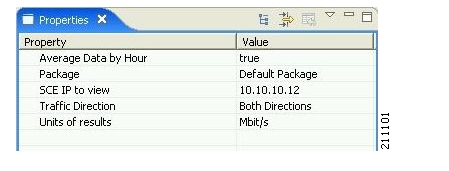
Step 2
The display of property categories is toggled off.
Figure 3-2
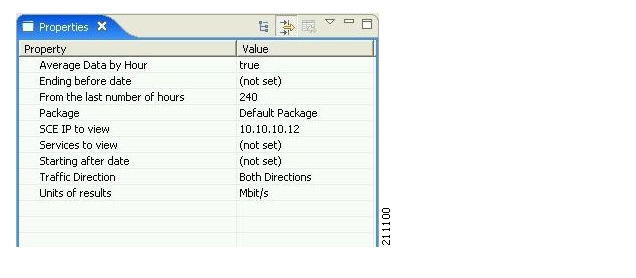
Step 3
Figure 3-3
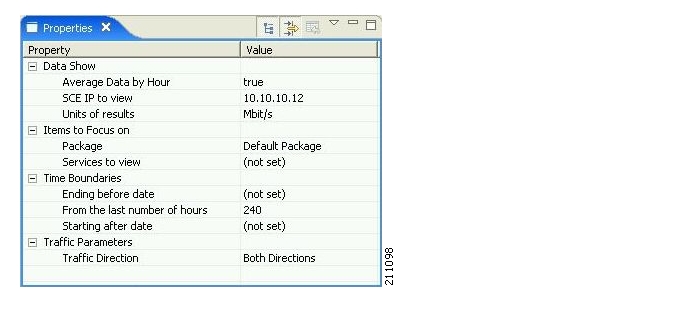
Step 4
The display of property categories is toggled on.
Figure 3-4
![]()
![]()
![]()
![]()
![]()
![]()
![]()
![]()
Posted: Thu May 31 02:42:36 PDT 2007
All contents are Copyright © 1992--2007 Cisco Systems, Inc. All rights reserved.
Important Notices and Privacy Statement.