|
|

Table Of Contents
Information About Report Actions
To View Report Types that can be Generated in Asymmetric Routing Classification Mode:
How to Generate a Report When a Report Instance is Selected:
How to Generate Multiple Reports
Configuring the Properties of a Chart Display
Changing the Appearance of the Chart
Working with Reports
After you have created and defined a report instance, you can generate reports from the report instance.
•
Display reports in chart or tabular form
•
•
•
Information About Report Actions
The views found on the SCA Reporter display menu items. Some commonly used actions have icons for easy navigation.
The actions and their icons are described in the following table.
How to Generate Reports
You can generate a report from an existing, defined report instance. Report instances are found in the Templates view. You can duplicate, modify, rename, or delete the report instances (see "Managing Report Instances" ). You can generate multiple reports; you can put the generate process in the background while working on other reports.
Some types of reports cannot be generated using data collected from an SCE platform running in asymmetric routing classification mode.
You can define and generate reports using the SCA Reporter Command-Line Interface (CLI). You can also use the CLI to pre-schedule reports. (See "The SCA Reporter Command-Line Interface".)
•
•
•
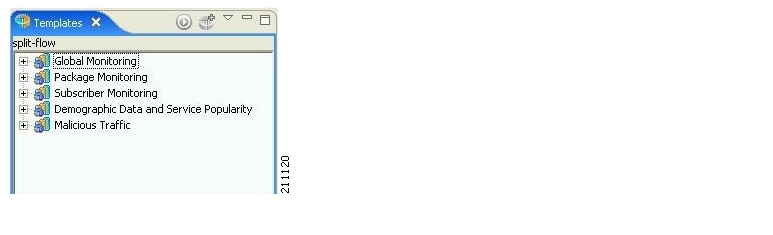
To View Report Types that can be Generated in Asymmetric Routing Classification Mode:
Step 1
Template groups whose report instances cannot be executed for asymmetric routing classification mode data are hidden.
Figure 5-1
How to Generate a Report When a Report Instance is Selected:
Step 1
The Properties view displays the report instance properties.
Step 2
( Execute).
The report is generated and is displayed in a new report view.
The Properties view displays the chart display properties.
How to Generate Multiple Reports
Step 1
The selected report instances are highlighted.
Step 2
A Progress dialog box appears while reports are being generated.
Step 3
•
While the reports are being generated, the system task status shows:
Figure 5-2
•
The status of all reports that are being generated is displayed.
Figure 5-3
•
Report generation continues running in the background. When it finishes, each report is displayed in a separate report view.
Note
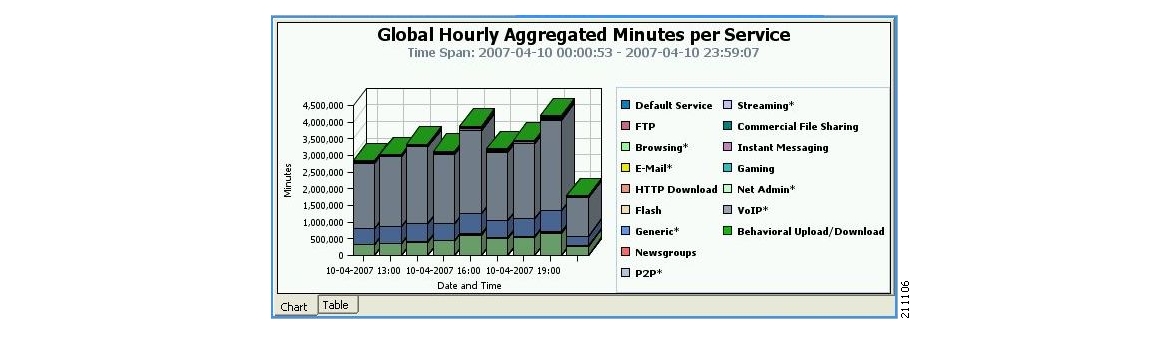
Viewing Reports
You can view a report as a chart or as a table.
Step 1
Figure 5-4
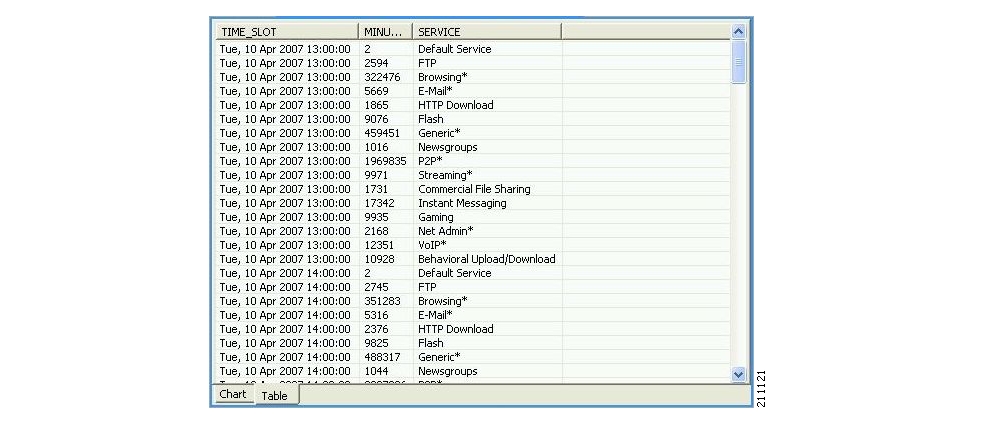
The table is useful for locating specific information.
Figure 5-5
Adjusting the Chart Display
You can change the appearance and type of any report chart by modifying chart display properties, such as three-dimensional display settings and chart rendering. You can also change the appearance of a report in the following ways:
•
•
•
•
Configuring the Properties of a Chart Display
You configure chart display properties in the Properties view. As you make changes, the chart display is updated. There are also adjustments that are made directly in the report view (see Adjusting the Chart Display ).
Note
The following table lists chart display properties and their descriptions:
Possible values for the Chart Rendering property:
Changing the Appearance of the Chart
You can change the chart type of the report, and you can adjust the graphical display of the chart.
•
How to Change Chart Type
SUMMARY STEPS
1.
2.
3.
DETAILED STEPS
Step 1
A report view opens displaying the report, and the Properties view displays the chart display properties.
Step 2
Figure 5-6
Step 3
The report is updated when you click anywhere else in the Properties view.
How to Modify the Graphical Display
SUMMARY STEPS
1.
2.
3.
4.
5.
6.
7.
DETAILED STEPS
Step 1
A report view opens displaying the report, and the Properties view displays the chart display properties.
Step 2
The value of the 3Dproperty toggles from Trueto False and the Look/3D category is removed from the Properties view.
Step 3
The chart displays in three dimensions, and the Look/3D category reappears.
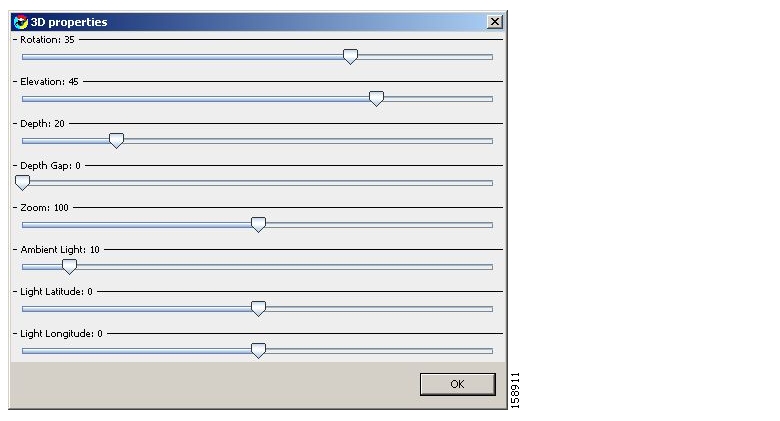
Step 4
The 3D properties dialog box appears.
Figure 5-7
Step 5
Step 6
Step 7
The new values are assigned to the Settings property.
Zooming
•
•
•
How to Zoom in on a Two-Dimensional Chart
You can zoom in or out of two-dimensional charts.
While you are zoomed-in, you can drag the chart to view different sections.
SUMMARY STEPS
1.
2.
3.
4.
DETAILED STEPS
Step 1
A report view opens displaying the report, and the Properties view displays the chart display properties.
Step 2
The value of the 3D property toggles from True to False and the Look/3D category is removed from the Properties view.
Step 3
The cursor changes to a plus icon.
Step 4
How to Drag a Zoomed-In Chart
SUMMARY STEPS
1.
2.
3.
DETAILED STEPS
Step 1
Step 2
Step 3
The chart moves up, and the bottom of the chart appears.
How to Zoom Out of a Zoomed-In Chart
SUMMARY STEPS
1.
2.
DETAILED STEPS
Step 1
The cursor changes to a minus icon.
Step 2
Hiding Variables
You can hide variables that are part of the report, so that they do not display in the chart.
Note
•
•
How to Hide Variables in the Chart
SUMMARY STEPS
1.
2.
3.
DETAILED STEPS
Step 1
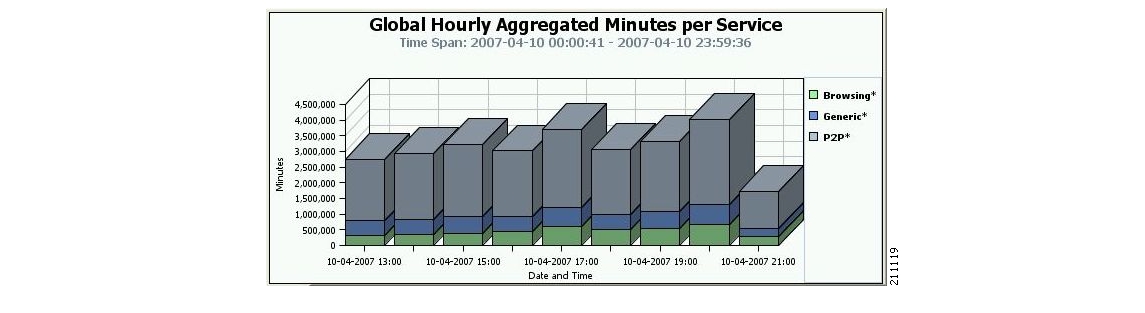
A report view opens displaying the report.
Figure 5-8
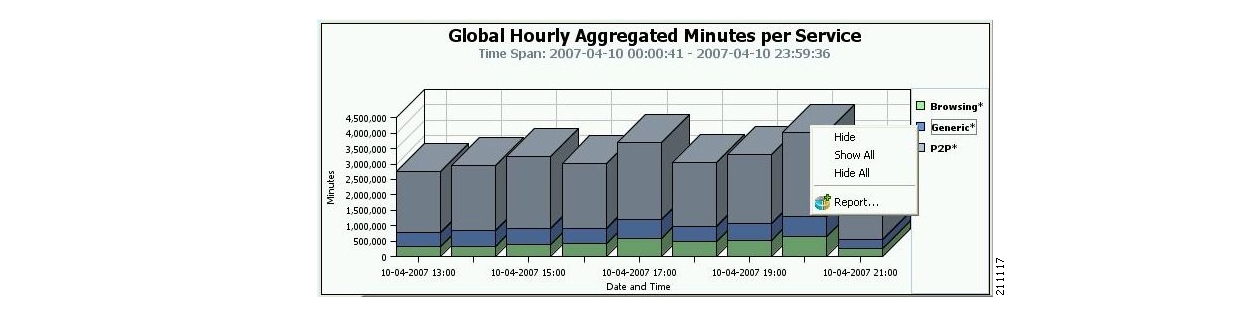
Step 2
A popup menu appears.
Figure 5-9
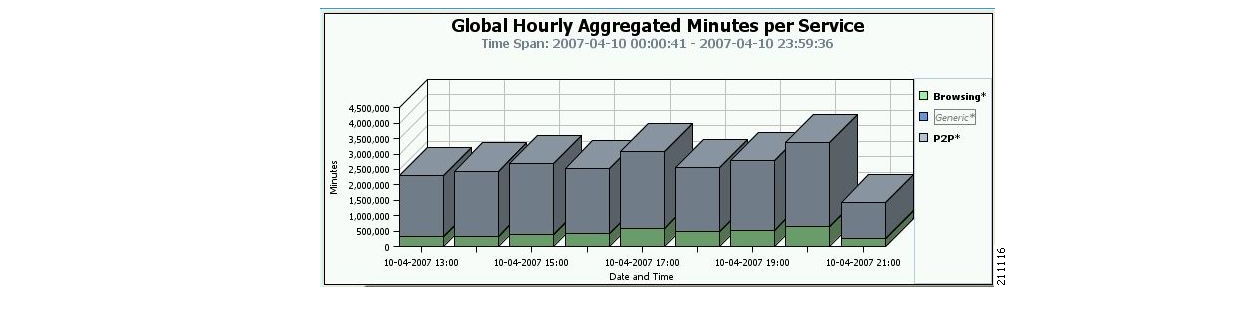
Step 3
The variable is dimmed out in the legend and removed from the chart.
Figure 5-10
How to Redisplay a Hidden Variable
SUMMARY STEPS
1.
2.
DETAILED STEPS
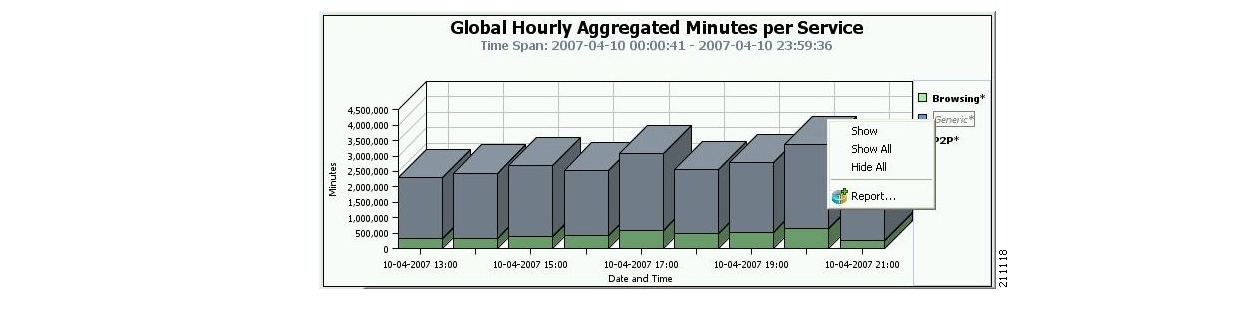
Step 1
A popup menu appears.
Figure 5-11
Step 2
The variable is restored in the legend and displayed from the chart.
Figure 5-12
Managing the Chart Legend
You can move the chart legend from its default position, or you can remove it from the chart display.
•
•
How to Move the Chart Legend
DETAILED STEPS
Step 1
A report view opens displaying the report.
Step 2
The legend moves to the new position.
How to Hide the Chart Legend
DETAILED STEPS
Step 1
The Properties view displays the chart display properties.
Step 2
The value of the Legend visibilityproperty toggles from True to False and the chart legend is removed from the chart.
How to Export Reports
You can export reports to most graphic formats, and you can export tables to CSV or Quoted CSV formats, which you can open as spreadsheets. You can export multiple reports in one export operation.
SUMMARY STEPS
1.
2.
3.
4.
5.
6.
7.
8.
DETAILED STEPS
Step 1
The Export wizard appears.
Figure 5-13
Step 2
Step 3
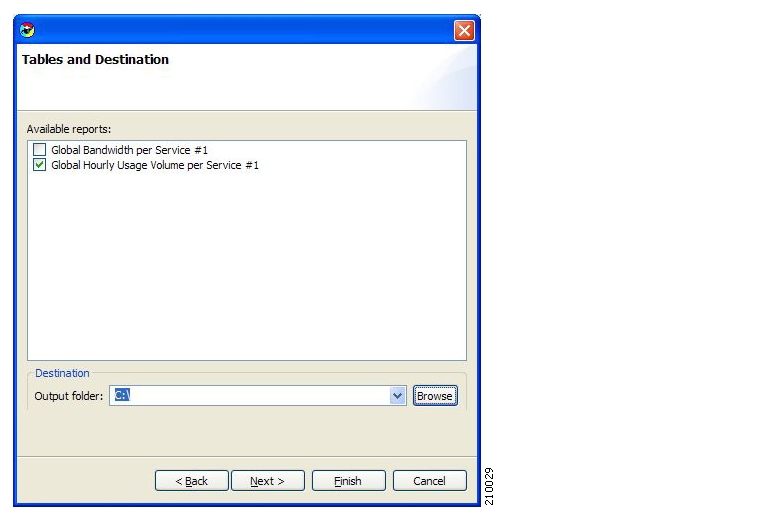
The Tables and Destinations screen of the Export wizard opens.
Figure 5-14
Step 4
Step 5
Step 6
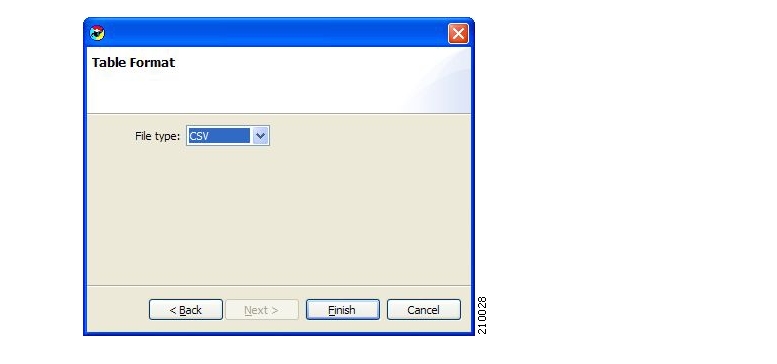
The Format screen of the Export wizard opens. (The screen depends on whether you chose Chart or Table in step 2.)
Step 7
•
Figure 5-15
•
Figure 5-16
Step 8
Each report selected is saved in a separate file.
![]()
![]()
![]()
![]()
![]()
![]()
![]()
![]()
Posted: Thu May 31 02:53:05 PDT 2007
All contents are Copyright © 1992--2007 Cisco Systems, Inc. All rights reserved.
Important Notices and Privacy Statement.