|
|

Table Of Contents
Monitoring Global Load-Balancing Status
Understanding GSS Logging Levels
Viewing Device Logs from the CLI
Viewing the System Log from the GUI
Printing and Exporting GSSM Data
Monitoring GSS Performance
Overview
The Cisco GSS software features a number of tools for monitoring the status of your GSS devices and of global load balancing on your GSS network. These include CLI-based commands for determining the status of your GSSs, GSSMs, and the embedded GSS database. In addition, the GSSM GUI contains windows that display the status of global server load balancing activity, for example, tabulating answer and DNS rule hit counts.
This chapter contains the following sections:
•
Monitoring GSS Device Status
•
•
Monitoring GSS Device Status
The following sections address the various GSS features for monitoring the health of your GSS devices and components.
GSSs and GSSMs
You can easily monitor the status of your GSSs and GSSMs from both the CLI and the GSSM GUI.
Monitoring the Online Status of GSS Devices from the CLI
Use the gss command to display the online status and resource usage of your GSS servers.
To monitor the status of a GSS device from the CLI:
Step 1
Step 2
gssm1.yourdomain.com> enablegssm1.yourdomain.com#Step 3
gss1.yourdomain.com# gss statusCisco GSS(1.0.0.0.13) GSS Manager - primary [Wed May 22 17:43:36 GMT 2002]Normal Operation [runmode = 5]Cisco GSS(1.0.0.22.3) GSS Manager - primary [Thu Aug 1 22:25:30 UTC 2002]Normal Operation [runmode = 5]%CPU %MEM START PID SERVER0.0 0.3 Jul23 900 system0.0 0.4 Jul23 1161 database0.0 2.0 Jul23 1165 tomcat0.0 0.1 Jul23 1438 apache0.0 2.3 Jul23 1177 crm0.0 1.8 Jul23 1202 crdirector0.0 0.1 Jul23 1191 dnsserver0.0 0.1 Jul23 1233 keepalive0.0 0.1 Jul23 1213 boomerang0.0 2.2 Jul23 1026 nodemgr0.0 0.0 Jul23 419 syslogd--- --- --- --- ucd-snmpd [DISABLED]Monitoring the Status of Your GSS Network from the CLI
Use the show statistics command to view the status of any request routing and load balancing component on your GSS devices, including answers, keepalives, domains, DNS rules, and so on.
The following sections provide instructions about using and interpreting the output of the various show statistics command options.
Monitoring the Status of the Boomerang Server on Your GSS
The boomerang server is a server load-balancing component of the GSS that uses calculations of network delay provided by DNS races between content routing agents (CRAs) to determine which server is best able to respond to a given request.
Use the show statistics boomerang command option to view boomerang activity such as DNS races on your GSS device on a domain-by-domain or on a global basis.
To view DNS race statistics:
Step 1
Step 2
gssm1.yourdomain.com> enablegssm1.yourdomain.com#Step 3
gss1.yourdomain.com# show statistics boomerang globalBoomerang global statistics:Total races: 24Step 4
Monitoring the Status of the DNS Server on Your GSS
The DNS server component tracks all DNS-related traffic to and from your GSS device, including information about DNS queries received, responses sent, queries dropped and forwarded, and so on.
Using the show statistics dns command option, you can view DNS statistics with regard to your GSS request routing and server load-balancing components such as DNS rules, domains, and domain lists.
To view DNS statistics:
Step 1
Step 2
gssm1.yourdomain.com> enablegssm1.yourdomain.com#Step 3
gss1.yourdomain.com# show statistics dns domainwww\.foo.*\.com hitCount=11Step 4
Monitoring the Status of Keepalives on Your GSS
The keepalive engine on your GSS device monitors the online status of keepalive objects across your GSS network.
Using the show statistics keepalive command option, you can view statistics about the health of your GSS keepalives globally or by keepalive type.
To view keepalive statistics:
Step 1
Step 2
gssm1.yourdomain.com> enablegssm1.yourdomain.com#Step 3
gss1.yourdomain.com# show statistics keepalive icmp allIP: 192.168.1.100 GID: 68LID: 1Keepalive => 192.168.1.100Status: ONLINETransitions: 0Total Packets Received: 0Total Packets Sent: 0Total KAL Successes: 0Total KAL Failures: 0Step 4
Monitoring GSS Device Status from the GUI
To monitor the status of your GSS devices from the GSSM GUI:
Step 1
Step 2
Step 3
The GSS details window appears, displaying configuration and status information about the device, including:
•
•
•
•
•
•
Step 4
GSSM Database
A variety of features let you monitor the status of the GSSM database and its contents.
Monitoring the Database Status
To verify that the GSS database on the GSSM is functioning properly:
Step 1
Step 2
gssm1.yourdomain.com> enablegssm1.yourdomain.com#Step 3
gss1.yourdomain.com# gssm database statusGSSM database is running.Validating Database Records
To validate the records in your GSSM database:
Step 1
Step 2
gssm1.yourdomain.com> enablegssm1.yourdomain.com#Step 3
gss1.yourdomain.com# gssm database validateGSSM database passed validation.
Creating a Database Validation Report
Should you encounter problems while attempting to validate your GSSM database, you can generate a report, called validation.log, that details which database records failed validation.
To generate a database validation report:
Step 1
Step 2
gssm1.yourdomain.com> enablegssm1.yourdomain.com#Step 3
gss1.yourdomain.com# gssm database reportGSSM database validation report written to validation.log.
Step 4
gss1.yourdomain.com# type validation.logvalidation.logStart logging at Wed May 22 22:39:34 GMT 2002- storeAdmin Validating ... Wed May 22 22:39:36 GMT 2002 -- ObjectId Object_Name.Field_Name Description -Validating FactoryInfoValidating answerElementValidating answerGroup70 answerGroup.OwnerId Many-To-One ListValidating CachingConfigValidating ClusterConfigValidating CmdControlValidating CmdPurgeRdValidating CmdUpdateValidating ConfigPropertyValidating CustomerValidating DistTreeValidating DnsRuleValidating DomainElementValidating DomainGroupValidating ENodeConfigValidating ENodeStatusValidating KeepAliveConfigValidating KeepAliveValidating LocationValidating OrderedanswerGroupValidating OwnerValidating RegionValidating RequestHandlerValidating RoutedDomainValidating RoutingConfigValidating RrConfigValidating RrStatusValidating SNodeConfigValidating SourceAddressElementValidating SourceAddressGroupValidating SpInfoValidating SystemConfigValidating UpdateInfoValidating UserConfigValidating VirtualCDNValidating WlpanswerElementValidating User ValidationsEnd of file validation.log
Monitoring Global Load-Balancing Status
From the GSSM GUI, you can monitor the status of global load balancing on your GSS network using a variety of features that filter and condense GSS traffic and statistics.
Use the sections that follow to learn more about how to monitor global load balancing from the GSSM GUI.
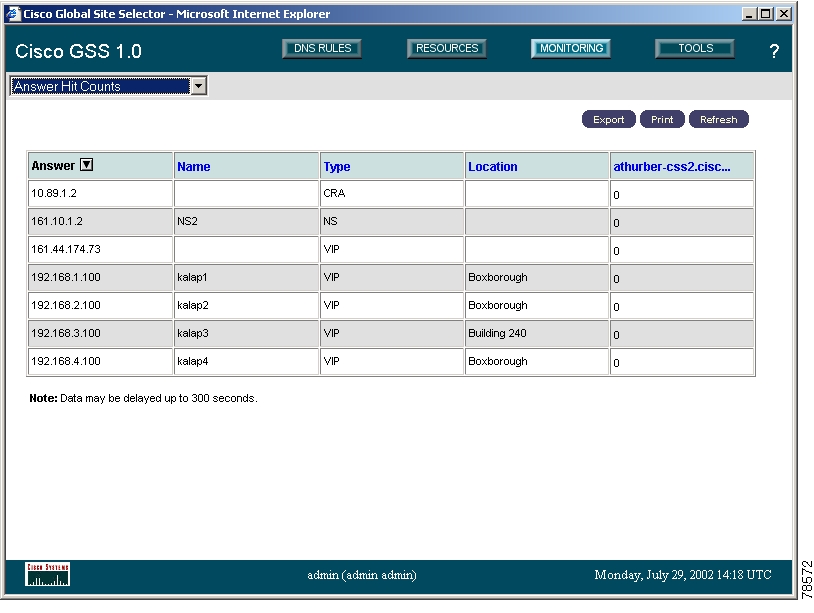
Answer Hit Counts
The answer hit counts feature of the GSSM GUI provides you with an overview of your GSS answer resources and the number of times that user requests have been directed to each answer device. Looking at answer hit counts is one way to judge how well your GSS resources are being used in responding to user requests.
To view the number of hits recorded by each of your GSS answers:
Step 1
Step 2
•
•
•
•
•
Figure 4-1 GSSM Answer Hit Counts Window
Step 3
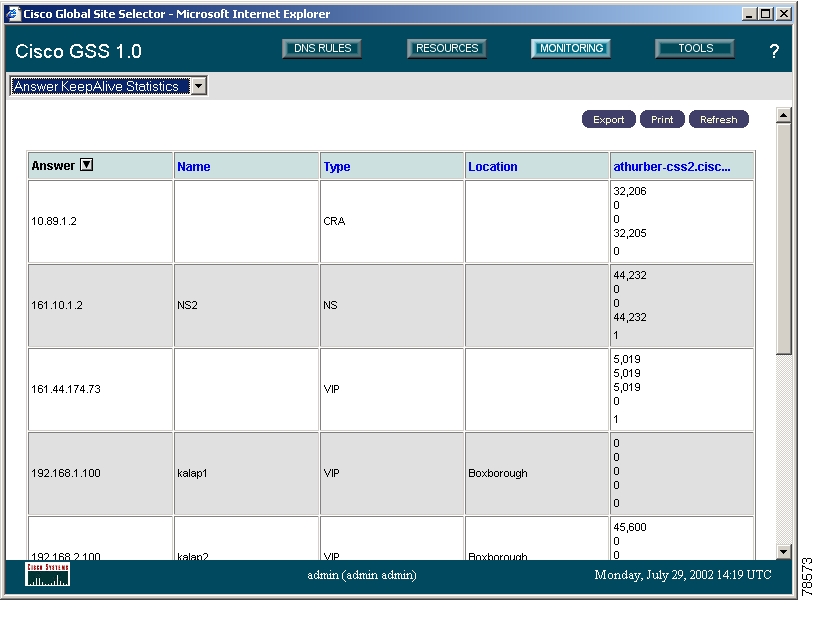
Answer Keepalive Statistics
The answer keepalive statistics feature of the GSSM GUI provides you with an overview of the online status of your GSS answer resources. For each answer configured on your GSS, the answer keepalive statistics feature displays the number of keepalive probes that have been directed to that answer by the primary and the standby GSSM, as well as information about how that keepalive probe was handled. If a large number of keepalive probes are being rejected or are encountering transition conditions, the answer may be off line or may be having problems staying on line.
To view the online status of each of your GSS answers:
Step 1
Step 2
•
•
•
•
•
–
–
–
–
–
Figure 4-2 Answer Keepalive Statistics Window
Step 3
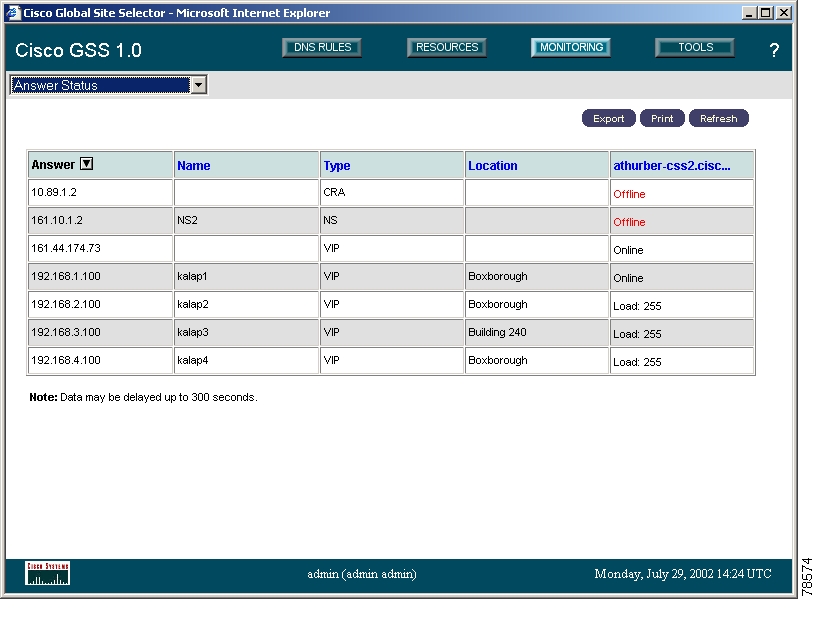
Answer Status
The answer status feature of the GSSM GUI provides you with an overview of your GSS answer resources and their online status. Answers can be sorted by IP address, name, type, location, or online status according to a particular device.
To view the status of your GSS answers:
Step 1
Step 2
•
•
•
•
•
Figure 4-3 GSSM Answer Status Window
Step 3
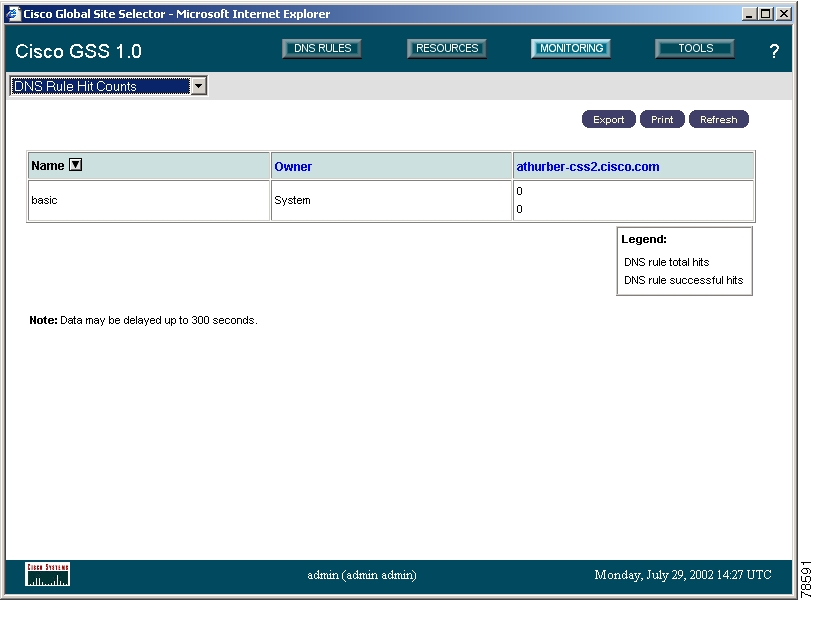
DNS Rule Hit Count
The DNS rule hit count feature of the GSSM GUI provides you with an overview of your global load-balancing rules, as well as information about how many queries were processed by each rule and how many of those processed queries were successfully matched with answers.
To view the status of your DNS rules:
Step 1
Step 2
•
•
•
Figure 4-4 GSSM DNS Rule Hit Count Window
Step 3
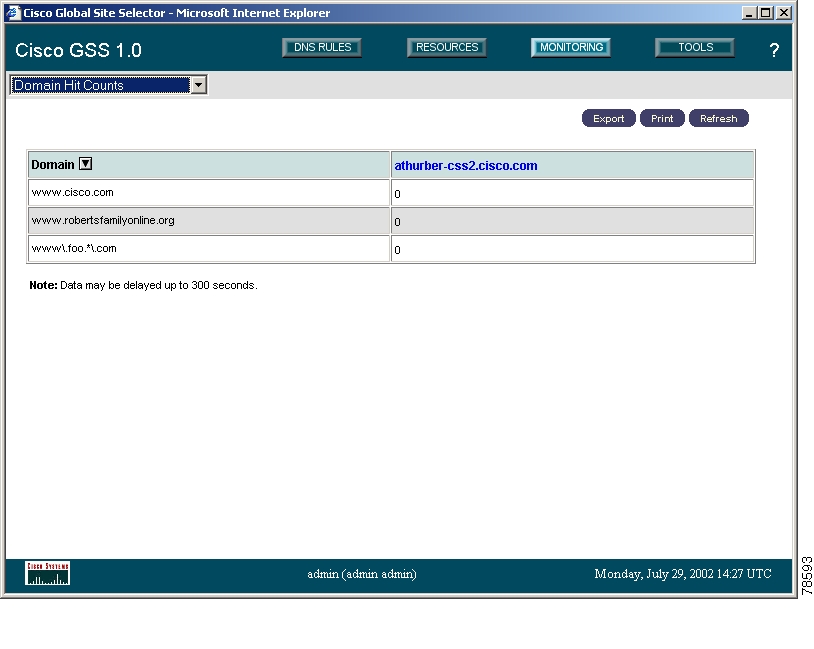
Domain Hit Counts
The domain hit count feature of the GSSM GUI provides you with an overview of the hosted domains that your GSS is serving, as well as information about how many queries were directed to each domain by your DNS rules. The domain hit counts feature tracks the traffic directed to individual domains, not GSS domain lists, which may include one or more domains.
To view the status of your hosted domains:
Step 1
Step 2
•
•
Figure 4-5 GSSM Domain Hit Counts Window
Step 3
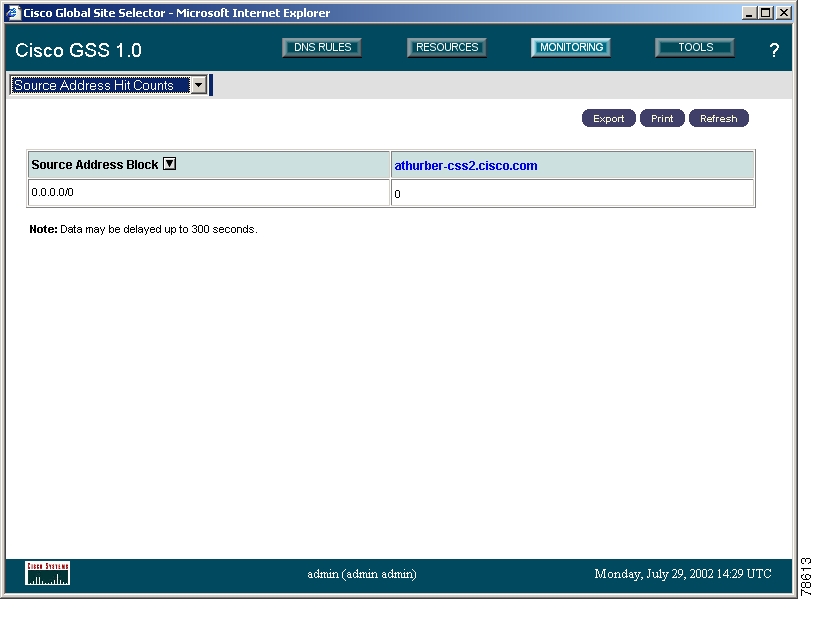
Source Address Hit Counts
The source address hit counts feature of the GSSM GUI provides you with an overview of incoming requests received by each of your source addresses (that is, those addresses from which DNS queries to your GSS originate) from each of your GSS devices. The source address hit counts feature tracks requests from individual address blocks, not from GSS source address lists, which may contain one or more address blocks.
To view the hit count for your source address lists:
Step 1
Step 2
•
•
Figure 4-6 Source Address Hit Counts Window
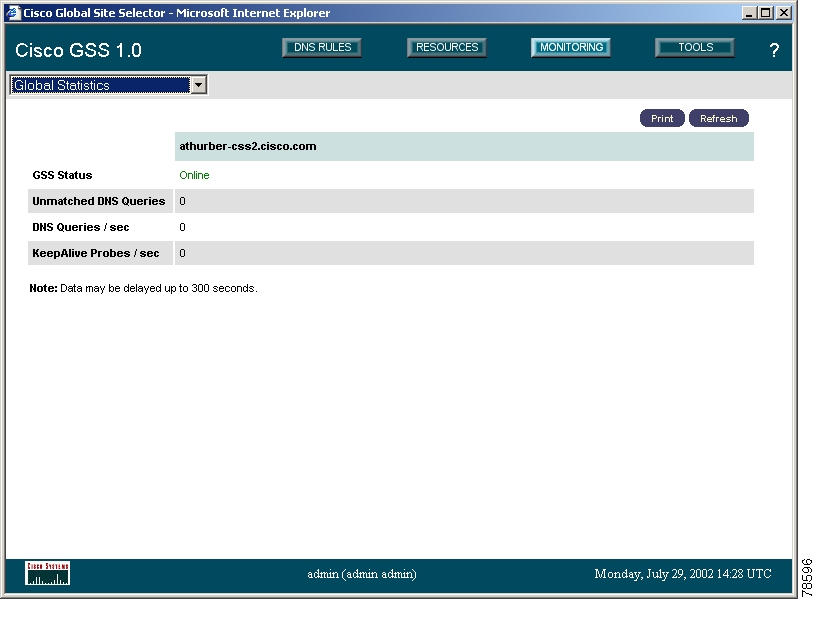
Global Statistics
The global statistics feature of the GSSM GUI provides you with an overview of your GSS network, providing average statistics for DNS requests received by each GSS device and keepalive messages sent to your answers, as well as the online status of each GSS device.
To view the status of your GSS network:
Step 1
Step 2
•
•
•
•
Figure 4-7 GSSM Global Statistics Window
Viewing Log Files
The GSS maintains logged records for a wide range of GSS network activity in the gss.log file as well as through the system logs feature of the GSSM.
Use the sections below to help you audit logged information about your GSS devices.
Understanding GSS Logging Levels
The GSS employs eight separate logging levels to identify the wide range of critical and noncritical logged events that may occur on a GSS device.
Table 4-1 lists these different logging levels and explains their meanings.
Viewing Device Logs from the CLI
Each GSS device contains a variety of log files that retain records of both GSS-related activity and the functioning of various GSS subsystems. You can access these log files using the CLI to troubleshoot problems or better understand the behavior of GSS device.
The sections that follow explain how to access and view the contents of log files on your GSS devices.
Viewing the gss.log File from the CLI
The gss.log file pulls together information that might be of interest or use to customers, such as keepalive, availability, and load statistics for GSS devices. This log file can be viewed from the CLI using the show logs command.
Refer to documentation of the show logs command in the Cisco Global Site Selector Command Reference for a list of the various log files that are displayed using the show logs command.
Note
To view logged GSS messages in the gss.log file:
Step 1
Step 2
gssm1.yourdomain.com> enablegssm1.yourdomain.com#Step 3
gssm1.yourdomain.com# show logsgss.logJul 14 21:42:01 gss-css2 KAL-7-KALAP[1240] KAL-AP (seq# 29410)=> Host 192.10.2.1Jul 14 21:42:02 gss-css2 KAL-7-KALAP[1240] KAL-AP (seq# 29412)=> Host 192.10.4.1Jul 14 21:42:02 gss-css2 KAL-7-KALAP[1240] Retrying IP [192.10.4.1] (Retry Count 3)Jul 14 21:42:07 gss-css2 KAL-7-KALAP[1240] Timeout: Found outstanding KAL [192.10.2.1]Jul 14 21:42:07 gss-css2 KAL-7-KALAP[1240] KAL-AP (seq# 29411)=> Host 192.10.2.1Jul 14 21:42:07 gss-css2 KAL-7-KALAP[1240] Retrying IP [192.10.2.1] (Retry Count 1)Jul 14 21:42:09 gss-css2 KAL-7-KALCRA[1240] rtt_task: waiting 10000 msecondsJul 14 21:42:12 gss-css2 KAL-7-KALAP[1240] KAL-AP (seq# 29412)=> Host 192.10.2.1Jul 14 21:42:12 gss-css2 KAL-7-KALAP[1240] Retrying IP [192.10.2.1] (Retry Count 2)Jul 14 21:42:16 gss-css2 KAL-7-KALAP[1240] Sending circuit keepalive => [192.10.2.1]Jul 14 21:42:16 gss-css2 KAL-7-KALAP[1240] Sending circuit keepalive => [192.10.3.1]Jul 14 21:42:16 gss-css2 KAL-7-KALAP[1240] Sending circuit keepalive => [192.10.4.1]Jul 14 21:42:16 gss-css2 KAL-7-KALAP[1240] Sending circuit keepalive => [192.10.6.1]Jul 14 21:42:16 gss-css2 KAL-7-KALAP[1240] Sending circuit keepalive => [192.10.7.1]Jul 14 21:42:16 gss-css2 KAL-7-KALAP[1240] Sending circuit keepalive => [192.10.8.1]Jul 14 21:42:17 gss-css2 KAL-7-KALAP[1240] KAL-AP (seq# 29410)=> Host 192.10.3.1Jul 14 21:42:17 gss-css2 KAL-7-KALAP[1240] KAL-AP (seq# 29413)=> Host 192.10.2.1Jul 14 21:42:17 gss-css2 KAL-7-KALAP[1240] Retrying IP [192.10.2.1] (Retry Count 3)Jul 14 21:42:19 gss-css2 KAL-7-KALCRA[1240] rtt_task: waiting 10000 msecondsJul 14 21:42:22 gss-css2 KAL-7-KALAP[1240] Timeout: Found outstanding KAL [192.10.3.1]Jul 14 21:42:22 gss-css2 KAL-7-KALAP[1240] KAL-AP (seq# 29411)=> Host 192.10.3.1Jul 14 21:42:22 gss-css2 KAL-7-KALAP[1240] Retrying IP [192.10.3.1] (Retry Count 1)Jul 14 21:42:22 gss-css2 NMR-7-NODEMGR[1035] Checking process queue for defunct members.Jul 14 21:42:27 gss-css2 KAL-7-KALAP[1240] KAL-AP (seq# 29412)=> Host 192.10.3.1Jul 14 21:42:27 gss-css2 KAL-7-KALAP[1240] Retrying IP [192.10.3.1] (Retry Count 2)...Step 4
•
gssm1.yourdomain.com# show logs tail•
Viewing Subsystem Log Files from the CLI
In addition to the gss.log file, each GSS device maintains a number of additional log files that record subsystem-specific information, for example for the keepalive engine or DNS server component of the GSS. Although these log files are not generally associated with specific CLI commands as the gss.log file is, any of them can be viewed from the CLI using the type EXEC command.
Note
To view your GSS subsystem log files:
Step 1
Step 2
gssm1.yourdomain.com> cd sysoutgssm1.yourdomain.com>Step 3
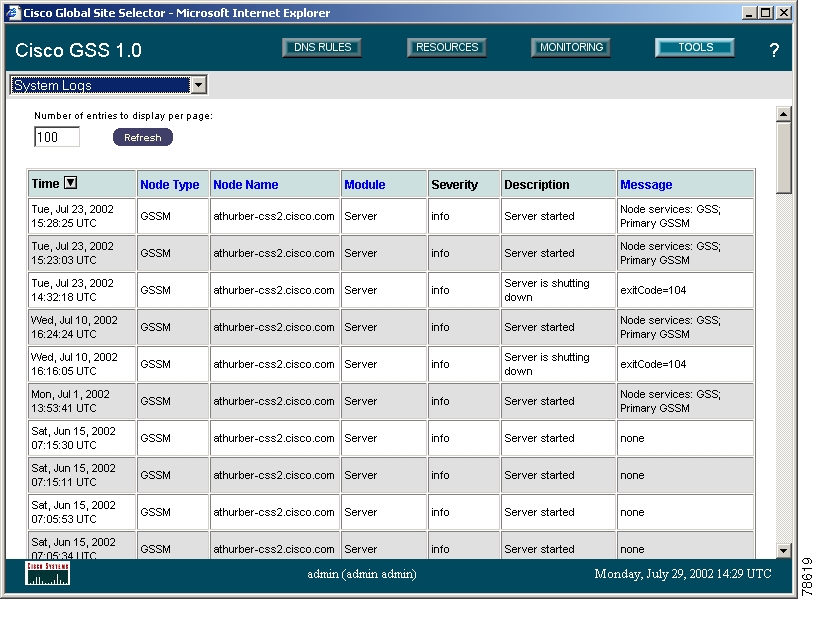
gssm1.yourdomain.com> type dnsserver.logdnsserver.logStarting dnsserver: Mon Jul 1 13:52:50 UTC 2002 [(1221)]2002-07-10 16:23:08 relog: Booting...Starting dnsserver: Wed Jul 10 16:23:33 UTC 2002 [(1201)]End of file dnsserver.log]Viewing the System Log from the GUI
From the GSSM GUI, you can view messages logged in the GSS system.log file. This log presents the logged information that is most likely of interest to GSS administrators. However, the system.log file presents only a subset of all logged information. See the "Viewing Subsystem Log Files from the CLI" section for information about viewing the entire contents of individual GSS log files.
To view the GSS system logs:
Step 1
Step 2
•
•
•
•
•
–
–
–
–
•
•
Figure 4-8 GSSM System Logs Window
Step 3
System Log Messages
Table 4-2 lists common GSS system messages that may be encountered in the system log using the Tools > System Log feature. Error messages are listed alphabetically, and each error message is accompanied by a brief description. Contact a Cisco technical support representative if you require more detailed information about the purpose of a message.
Printing and Exporting GSSM Data
You can send any data displayed on the GSSM GUI to a local or network printer configured on your workstation, or export that data to a flat file for use with other office applications.
When printing or exporting data, all information displayed on the GSSM GUI window is dumped. You cannot select individual pieces of data to output.
To print or export GSSM data:
Step 1
Step 2
•
•
![]()
![]()
![]()
![]()
![]()
![]()
![]()
![]()
Posted: Mon Mar 21 11:16:08 PST 2005
All contents are Copyright © 1992--2005 Cisco Systems, Inc. All rights reserved.
Important Notices and Privacy Statement.