|
|

Tunnel Builder Pro allows you to view performance statistics using the Service Assurance Agent (SAA) on supported Cisco IOS platforms.
This chapter provides information you need to do the following:
To view performance statistics, you need to understand the following concept:
You can determine what the delay and jitter is between the endpoints of a tunnel or between any locations within the network. Delay is the time between the initiation of a transaction by a sender and the first response received by the sender. Jitter is the interpacket delay variance; that is, the difference between interpacket arrival and departure. For real-time data like voice and video, jitter must be limited.
Controlling delay and jitter is important for real-time applications such as Voice over IP.
If you are considering putting a link in a tunnel, you may want information about the delay across that link now. You can select the endpoints of a tunnel you are considering creating to determine the current delay and jitter.
This section contains instructions for the following tasks. Each task is identified as required or optional.
To measure delay and/or jitter, perform the following steps:
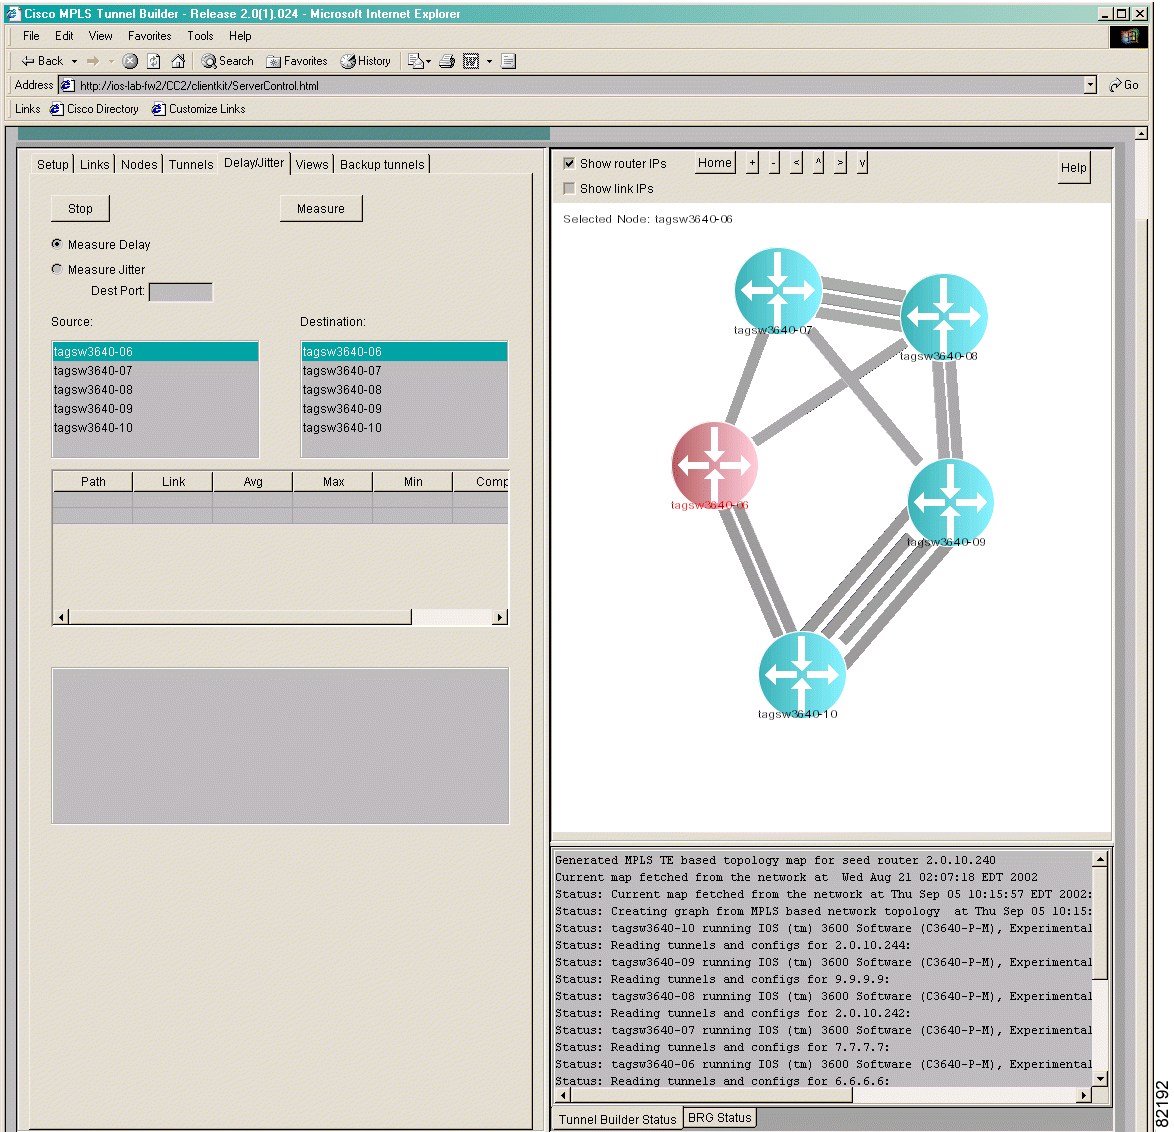
Step 1 Click the Delay/Jitter tab. The Delay Jitter window shown in Figure 8-1 appears.

Step 2 Select the source node (that is, the node at the head end) by doing one of the following. The selected node is highlighted in red in the network map.
Step 3 Select the destination node by doing one of the following. The selected node is highlighted in red in the network map.
Step 4 Click Measure Delay (the default) or Measure Jitter. If you are measuring delay, go to Step 5. If you are measuring jitter, go to Step 6.
Step 5 (Optional—Applicable to measuring delay) The Measure Delay window shown in Figure 8-2 appears.

Click Measure. The following statistics are displayed for each path and link:
The status box under the network map is updated each time the measuring process updates the fields on the window.
 |
Note The measuring process continues until you click Stop. |
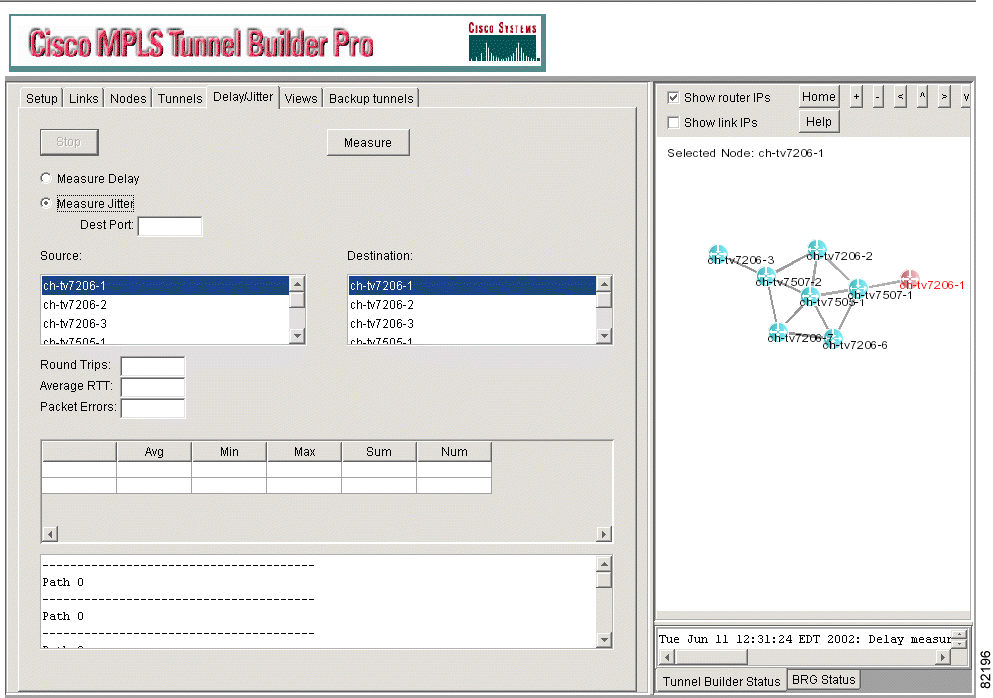
Step 6 (Optional—Applicable to measuring jitter). The Measure Jitter window shown in Figure 8-3 appears.

In the Dest Port field, specify the destination port.
Step 7 Click Measure. The following information is displayed:
The status box under the network map is updated each time the measuring process updates the fields on the window.
 |
Note To interrupt the measuring process, click Stop. |
To view tunnel and bandwidth information on the network map, perform the following steps:
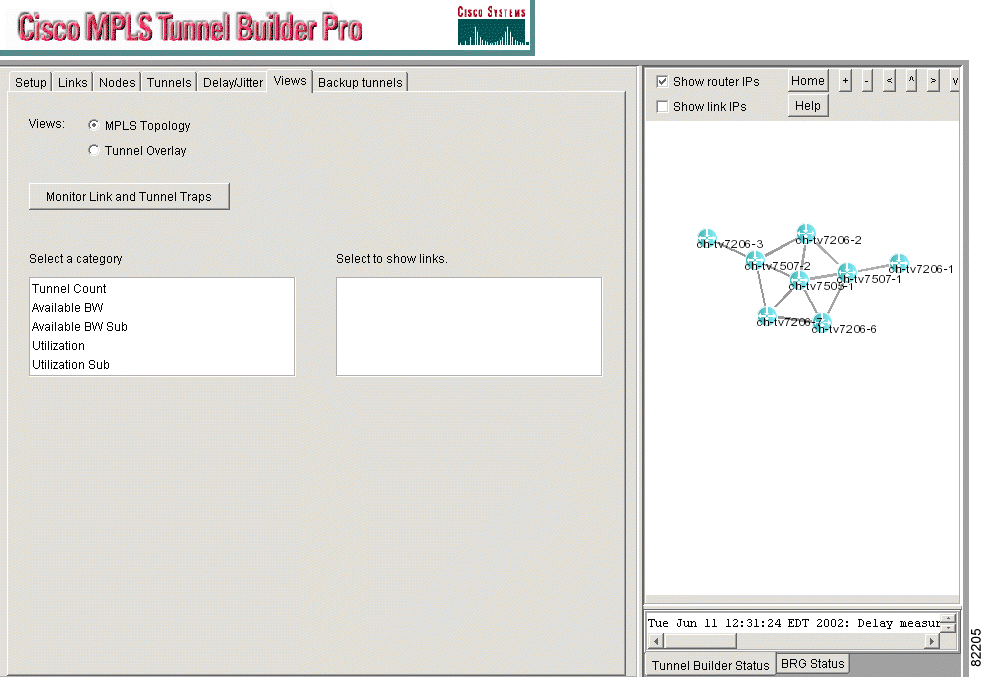
Step 1 Click the Views tab. The Views window shown in Figure 8-4 appears.

Step 2 (Optional) In the Views field, select one of the following:
Step 3 In the Select a category list box, select one of the following:
Step 4 In the Select to show links list box, select an entry. The links that meet the criteria specified in Steps 2 and 3 are highlighted in purple in the network map.
Step 5 If you want links or tunnels that go up or down to be highlighted, click Monitor Link and Tunnel Traps.
Example:
If you select Available BW from the Select a category list box and the number 2 from the Select to show links list box, all links that have two tunnels going over them are highlighted in purple in the network map.
![]()
![]()
![]()
![]()
![]()
![]()
![]()
![]()
Posted: Fri Oct 11 11:16:13 PDT 2002
All contents are Copyright © 1992--2002 Cisco Systems, Inc. All rights reserved.
Important Notices and Privacy Statement.