|
|

This chapter describes the various ways in which you can monitor Cisco routers using NSP. This chapter also lists and describes each NSP router status and how to define filters to view routers that match a certain status or are defined to specific group.
This chapter provides information on the following:
You can display a list of all the Cisco routers on your network that are being monitored by NSP. The color in which the service point name of a router is displayed indicates the status of that router.
To view a list of routers being monitored by NSP, on the NSP main menu, position the cursor on the * MGR option, and press Enter. The Router Status panel is displayed.
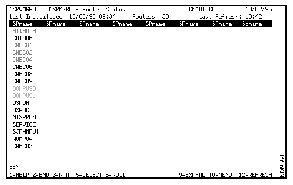
The following information is displayed on the Router Status panel:
From the Router Status and Router Status Extended panels, you can select a router and use the F5 function key to have NSP take you to the diagnostic panels most suited to solve the most critical problem affecting the router. For example, if an alert has been received from a router (router is displayed in pink and has an ALERT status), then selecting the router and pressing F5 takes you to the appropriate panel to view the received alerts for that router.
To take the fast path to problem resolution, on the Router Status or Router Status Extended panel, position the cursor on the router for which you want to view status details, and press F5.
To display additional information about the status of the routers in your network, on the Router Status panel, press F9. The Router Status Extended panel is displayed.
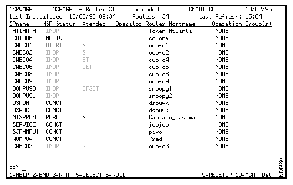
The following information is displayed on the Router Status Extended Panel:
The color in which the service point name of a router is displayed on the Router Status panel indicates the status of that router.
The following table lists the color and meaning of each status.
| Color | Status | Definition |
| Green | ACTIV | NSP can communicate with the router and the router is ready to receive commands. |
| Red | INACT | Router has never been activated and cannot generate alerts or receive commands. |
| Red | INOP | Router failed when a command was issued perhaps because the router has been made inactive by an operator. If a router is in a inactive state, an SSCP-to-PU session cannot be established. An operator must first activate the router by issuing the NetView ACT command. |
| Red | UNKNOWN | Router is not defined to VTAM. |
| Yellow | PERF | The router is active and NSP has detected a performance-related problem, or an interface configured in the router is down. |
| Pink | ALERT | The router is active and through the NetView automation table an alert was detected from a resource managed by the router control point. |
| Turquoise | CONCT | Router has not been connected to VTAM. |
| Reverse | nnnnn | An operator is enabled to the router. |
| N/A | Blank | Indicates there is no information available about the router. |
The NSP Router Status panel can display status information for up to 144 routers simultaneously. This allows you to view most, if not all, the routers in your network. To display a subset of routers that are of interest to you, you can define viewing filters.
You can define filters based on:
Group filtering allows you to view status for logically grouped routers. For example, a group may include all the routers located in a region or department, or those of a particular device type. The group to which a router belongs is assigned by an NSP administrator when the router is defined to NSP. You can identify the group to which a router belongs from the Router Status Extended panel or by viewing the management information data of a router. For information on viewing the management information data of a router, see the "Viewing Router Configuration from the NSP Perspective" section.
Status filtering allows you view status for routers that match, or do not match, a specified status. You can choose to display a view that includes or excludes routers that match up to three status types that you specify. For more information on the statuses by which you can filter routers, see the "NSP Router Status" table in the "Reviewing Status Types" section.
Filters are defined in your NSP operator profile. If an operator profile has not been created for you by an NSP administrator, you can create one for yourself for filtering purposes. For additional information on operator profiles, see the "Defining Operator Profiles" section of the "Installing and Configuring Native Service Point" chapter.
To filter the routers you are viewing on the Router Status and Router Status Extended panels:
Step 1 On NSP menu, position the cursor on the * USER option and press Enter. The Cisco Router User Administration panel is displayed.
For a complete description of the fields on the User Administration panel, see the "Defining Operator Profiles" section of the "Installing and Configuring Native Service Point" chapter.
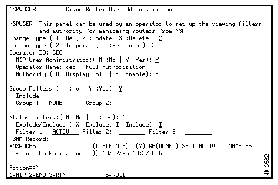
Step 2 Specify information for the following fields:
Step 3 Press Enter to verify your changes and press F4 to save them.
Step 4 To update the Router Status panel return to the NSP main menu, select the * MGR option, and press Enter.
While NSP automatically updates the status of the routers at the intervals specified by an NSP administrator in the NSP setup, you can manually refresh router status information at any time between those intervals.
If you are an enabled NSP user, you can also release and reset a router from an operator who is logged in to a router in enabled mode or is in a busy state with a router.
To refresh outdated router status information, on the Router Status panel, press F12.
To reset and check the status of a router:
Step 1 On the Router Status panel, select the router and press F10.
Step 2 Type 9 and press Enter.
To reset a session between an operator and a router, on the Router Status Extended panel, position the cursor over the service point name of the router for which you want to reset a session, and press F9.
There are several perspectives from which you can view the configuration of a router. You can view the configuration of a router as it is defined in:
You can also display a list of archived router configuration files for a specific router. From this list, you can view the configuration file, and, if necessary, use the file for disaster recovery.
To view a router as it is defined in VTAM:
Step 1 On the Router Status panel, position the cursor over the router and press Enter. The popup menu is displayed.
Step 2 In the field located at the top of the popup menu, type 5 and press Enter. The router configuration as it is defined in VTAM is displayed.
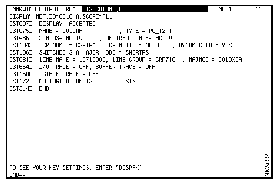
To view a router as it is defined in NSP:
Step 1 On the Router Status panel, position the cursor over the router for which you want to view NSP management information and press Enter. The popup menu is displayed.
Step 2 In the field located at the top of the popup menu, type 3 and press Enter. The Router Management Data panel is displayed.
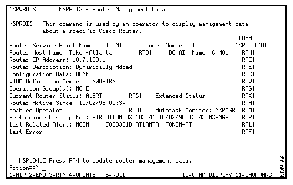
The following information is displayed on the Router Management Data panel:
Step 3 If you are an enabled NSP user, you can change the NSP definition of a router by pressing F4 to display the Cisco Router Resource Definition panel, making the changes, and pressing Enter to verify your changes and F4 to update and save the router definition.
For more information on modifying a router definition, see the "Adding Router Definitions" section in the "Installing and Configuring Native Service Point" chapter.
You can obtain additional information from the Router Management Data panel using the function keys displayed along the bottom of the panel.
| To | Press |
| View router information as it is defined in VTAM. | F10 |
| View the values of common globals used to manage the router. | F11 |
If you are an enabled NSP user, you can log in to and collect the current configuration of a router. You can also archive the router configuration file that you collect. To collect a current configuration, you must first log in to the router in enable mode.
To collect the current configuration of a router:
Step 1 On the Router Status panel, position the cursor over the router for which you want collect the current configuration and press Enter. The popup menu is displayed.
Step 2 In the field located at the top of the popup menu, type 7 and press Enter. The Router Command Interface panel is displayed.
Step 3 In the Password field, type the enable password and press Enter.
Step 4 Press F10 to collect the router's configuration. Status messages are displayed as NSP requests and collects the router configuration.
Step 5 When you are notified that the router configuration has been saved for the router, press Enter. The configuration you collected is archived.
Step 6 Press F3 to terminate your enabled session to the router.
You can display a list of archived configuration files for a router, view the details of a specific configuration file, and if necessary, use it an archived configuration file for disaster recovery.
To display a list of archived configuration files:
Step 1 On the Cisco Router Status panel, position the cursor over the router for which you want to collect a list of archived configuration files and press Enter. The popup menu is displayed.
Step 2 In the field located at the top of the popup menu, type 6 and press Enter. The Archived Router Configurations Panel is displayed.
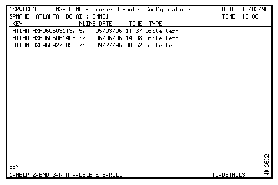
Step 3 To view the details of a configuration file, position the cursor on top of the file you want to view and press F10. The Archived Configuration Details panel is displayed.
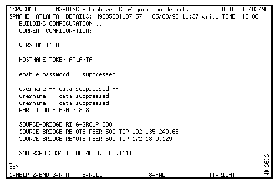
This section describes the router performance data that is available from NSP. It explains how to obtain the performance data that is useful in monitoring the performance of a router.
You can use the following methods to measure the performance of a router:
If you are an NSP administrator, you can set the monitoring intervals and CPU and memory thresholds in the NSP setup. Specifying a monitoring interval determines the interval (in hours or minutes) that NSP queries and collects performance data from the routers in your network. Specifying CPU and memory thresholds determines the percentage of the CPU and free memory being used that, when exceeded, places a "P" in the Xtended column on the Router Status Extended panel to flag the router with degraded performance, alters the status of the router to PERF, and turns the SPname of the router to yellow.
To change the NSP monitoring and threshold values:
Step 1 On the NSP main menu, position the cursor on the * SETUP option and press Enter. The NSP Router Management Setup panel is displayed.
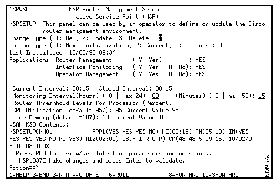
Step 2 Specify information in the following fields:
Step 3 Press Enter to verify your changes and F4 to save the NSP setup.
Once you have set the monitoring interval and CPU and memory threshold levels, NSP will measure the performance of the routers in your network using those values. The results are archived in the Router Performance History data set. If you are an NSP administrator, you can set the record wrap counts for the data set in the NSP setup. Any NSP user can view the records archived for a specific router on the Router Performance History panel.
To set the Router Performance History wrap counts:
Step 1 On the NSP main menu, position the cursor on the * SETUP option and press Enter. The NSP Router Management Setup panel is displayed.
Step 2 Press F8 to display the second NSP Router Management Setup panel and F8 again. The Router Management Constants Setup panel is displayed.
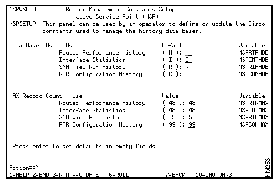
Step 3 Position the cursor in the Router Performance History Value field in the MAX Record Count section and type the number of performance records you want to collect. A valid range is a 1- or 2-digit number. The default is 48.
 | Caution The wrap counts are set on a per router basis. When these values are changed after initializing NSP, they only apply to new routers or interfaces defined to NSP. The only method of applying changed wrap counts to previously defined routers and interfaces is to delete the router definition and redefine the router to NSP. |
To view performance history records for a specific router:
Step 1 On the Router Status panel, position the cursor on the router for which you want view performance data and press Enter. The popup menu is displayed.
Step 2 In the field located at the top of the popup menu, type A and press Enter. The archived performance data for the router you selected is displayed.
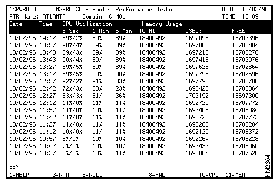
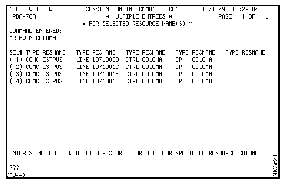
The following information is displayed on the Router Performance History panel:
You can obtain additional information from the Router Performance History panel using function keys displayed along the bottom of the panel. To view additional information about a history record, select the record and:
| To | Press |
| View detailed information about the current CPU performance. | F10 |
| View detailed information about the current memory performance. | F11 |
You can use the NSP Router Command Interface panel to connect to and issue commands to a router that you would normally have to issue via a telnet session with a router. However, NSP does restrict the use of certain commands such as TELNET.
Commands issued from the Router Command Interface panel are written to a NetView log. The name of the operator who issues a command is also recorded. However, as an NSP security feature, if the command issued requires a password, the password is suppressed and not logged. Also, if the command issued requests router configuration information, all security sensitive data is suppressed and not logged.
To issue commands to a router using the Router Command Interface:
Step 1 On the NSP main menu, press Tab to move to the Service Point Name field.
Step 2 Type in the service point name of the router and press Enter. The Router Command Interface panel is displayed.
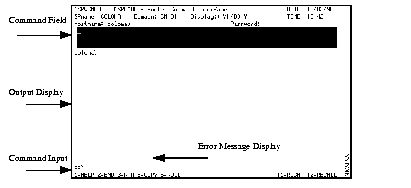
The Router Command Interface panel is made up of the following elements:
You can obtain additional information from the Router Management Data panel using the function keys displayed along the bottom of the panel.
| To | Press |
| Recall the last command you issued. | F12 |
Alerts generated by a router being monitored by NSP are forwarded to the host via the service point configured in the router. You can access NetView's Hardware Monitor Facility to obtain a list of alerts generated by a specific router or router resource and forwarded to NetView. For more information on using the NetView Hardware Monitor Facility, refer to the appropriate NetView Operations manual.
The two ways you can list alerts from NSP are:
To display a list of the total count of messages generated by a router:
Step 1 On the Router Status panel, position the cursor on the router for which you want to a display list of most recent alerts and press Enter. The popup menu is displayed.
Step 2 In the field located at the top of the popup menu, type 4 and press Enter. A NetView Hardware Monitor panel is displayed listing the total count of alert records generated by the router.
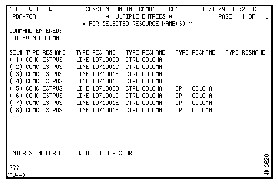
To display a list of the most recent events generated:
Step 1 On the Router Status panel, position the cursor on the router for which you want to view a list of events and press Enter. The popup menu is displayed.
Step 2 In the field located at the top of the popup menu, type 8 and press Enter. A NetView Hardware Monitor panel is displayed listing in reverse chronological order the most recent events generated by a router.
The NSP router management function provides a list of commonly used Cisco IOS software show commands that you can use to obtain additional information about a router that is useful for monitoring and problem determination purposes. If you are an NSP administrator, you can add show commands to the Router Show Commands panel.
To obtain additional information about a Cisco router:
Step 1 On Router Status panel, position the cursor on the router and press Enter. The popup menu is displayed.
Step 2 In the field located at the top of the popup menu, type B and press Enter. The Router Show Commands panel is displayed.
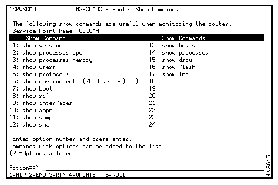
The following commands are displayed on the Router Show Commands panel:
Step 3 To issue the command, type the number representing the command, and if applicable, any additional arguments in the Action field, and press Enter.
If you are an NSP administrator, you can add Cisco IOS software show commands to the Router Show Commands panel. These show commands must be supported by Cisco IOS Release 11.0 and later.
To add a Cisco IOS software show command:
Step 1 On the Router Show Commands panel, press F4. Press Tab to move to the line number on which you want to add a show command.
Step 2 In the field on the line, type the parameter or parameters that correspond to the command that you are adding (without the show keyword) and press F4.
Step 3 To return to the Router Show Commands panel, type B in the field located at the top of the popup menu and press Enter. The Router Show Command panel is displayed with the command you added.
|
|