Within a Cisco Router, there may exist network interface processors. NSP discovers the interfaces configured in the routers that are defined to and monitored by NSP. From NSP, you can view a list of these interfaces and access additional information about an interface such as configuration and performance data.
This chapter provides information on the following:
NSP enables you to monitor:
- All interfaces, by type, configured in the routers on your network.
- Interfaces configured in a specific router.
- Interfaces, by type, configured in a specific router.
You can also display details about a specific interface and history and performance data of for a specific interface.
When you configure the NSP management environment, you specify the types of interfaces you want to monitor and the interval (in hours or minutes) at which you want the interfaces monitored. For more information on specifying interfaces, see the "Defining the NSP Management Environment and Administrator Profile" section of the "Installing and Configuring Native Service Point" chapter.
The types of interfaces you can monitor are:
- Ethernet
- FDDI
- Async
- Token Ring
- Serial
- Loopback
- Channel
- HSSI
To display a list interfaces configured in a router:
Step 1 On the Router Status panel, position the cursor on the router and press Enter. The popup menu is displayed.
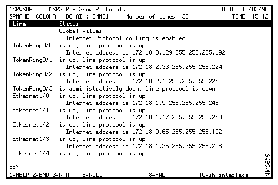
Step 2 In the field located at the top of the popup menu, type 2 and press Enter. The Show Protocols panel is displayed.
Figure 5-1: Show Protocols Panel

The following information is displayed on the Show Protocols panel:
- Number of Lines--Number of interfaces being monitored on the router by NSP.
- Line--Type of interface.
- Status--Current status of the interface.
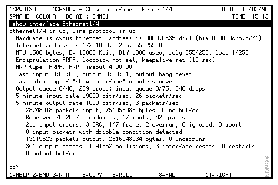
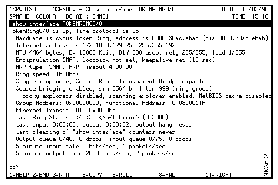
To display details about an interface, on the Show Protocols panel, place the cursor on the interface for which you want to display detailed information, and press F10. The Show Interface Details panel is displayed.
Figure 5-2: Show Interface Details Panel

Note Depending on the type of interface you select, the information displayed on this panel may vary.
You can monitor the interfaces by type that are configured in the routers in your network or configured in a specific router. When monitoring interfaces by type, you can access additional information about an interface such as:
- NSP management information of an interface
- NSP interface definition
- History and performance data of an interface
To display a list of interfaces, by type, that are configured in a router:
Step 1 On the Router Status panel, position the cursor on the router and press Enter. The popup menu is displayed.
Step 2 In the field located at the top of the popup menu, type C and press Enter.
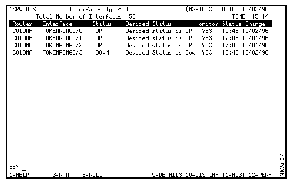
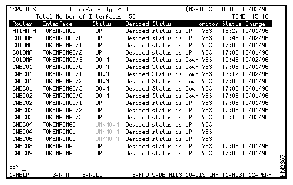
Figure 5-3: Show Protocols Panel with Token Ring Interfaces

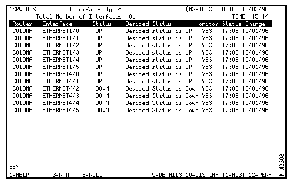
The following information is displayed on the Interfaces panel:
- Interface Type--Type of interfaces displayed on that panel. (T=Token Ring, E=Ethernet, S=Serial, C=Channel, F=FDDI, A=Async, L=Loopback, H=HSSI).
- Total Number of Interfaces--Total number of interfaces configured in that specific router and discovered by NSP.
- Router--Service point name of the router in which the interface is configured.
- Interface--Interface type.
- Status--Current status of the interface.
- Desired Status--Desired status of the interface as defined by an enabled NSP user in the interface definition. For more information on modifying the desired status of an interface, see the "Modifying the Interface Definition" section.
- Monitor--Indicates whether the interface is being actively monitored.
- Status Change--Time and date at which the status of an interface last changed.
Step 3 To display the next panel of interfaces, listed by type, press F3. A list of the next type of interfaces configured in the router and discovered by NSP is displayed.
Figure 5-4: Show Protocols Panel with Ethernet Interfaces

Step 4 To obtain additional information about an interface, position the cursor on the interface and refer to the "Displaying Additional Interface Information" section for information on the additional information you can obtain.
To display a list of interfaces by type:
Step 1 On the NSP main menu, press Tab to move the cursor to the Interface Type field and type the letter that represents the interface you want to monitor.
Step 2 Press Enter. A list of interfaces configured in the routers on your network that match the type you specified is displayed.
Figure 5-5: Interfaces by Type Panel

The following information is displayed on the panel:
- Interface Type--Type of interfaces displayed on that panel (T=Token Ring, E=Ethernet, S=Serial, C=Channel, F=FDDI, A=Async, L=Loopback, H=HSSI).
- Number of Interfaces--The total number of interfaces.
- Router--Service point name of the router in which the interface is configured.
- Interface--Interface type.
- Status--Current status of the interface.
- Desired Status--Desired status of the interface as defined by an enabled NSP user in the interface definition. For more information on modifying the desired status of an interface, see the "Modifying the Interface Definition" section of this chapter.
- Monitor--Indicates whether the interface is being actively monitored.
- Status Change--Time and date at which the interface status last changed.
Step 3 To obtain additional information about an interface, position the cursor on the interface and refer to the "Displaying Additional Interface Information" section for information on the additional information you can obtain.
From the Interfaces by Type panel, you can obtain additional information about a specific interface using the function keys that are displayed along the bottom of the panel. To obtain additional information about an interface, select the interface and:
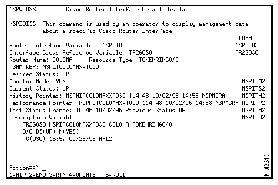
To display management data for an interface, on the Interface panel, position the cursor on the interface, and press F9. The Cisco Router Interface Detail Display panel is displayed.
Figure 5-6: Cisco Router Interface Detail Display Panel

The following information is available on the Cisco Router Interface Detail Display panel:
- Router Interface Variable--NSP-specific cross index.
- Interface Cross Reference Variable--NSP-specific cross index.
- Router Name--Service point name of the router in which the interface is enabled.
- Resource Type--Type of interface.
- VSAM Key--Pointer to the VSAM data record containing the NSP configuration data.
- Desired Status--Desired status of the interface as defined by an enabled NSP user in the interface definition. For more information on changing the desired status of an interface, see the "Modifying the Interface Definition" section of this chapter.
- Monitor Mode--Indicates whether the interface is being actively monitored.
- Current Status--Current status of the interface.
- History Pointer--Pointer to the VSAM data record containing the NSP history data.
- Performance Pointer--Pointer to the VSAM data record containing the NSP performance data.
- Last Status Change--The time and date at which the status of the interface last changed and the previous status of the interface.
- Description Variable--The description of the VSAM data record containing the NSP configuration data.
If you are an enabled NSP user, you can modify an NSP interface definition from the Cisco Router Interface Detail Display panel. The modifications you can make to an interface definition include:
- Whether the desired status of the interface is up or down
- Whether to actively monitor the interface
- Whether to delete interface history records
To modify an interface definition:
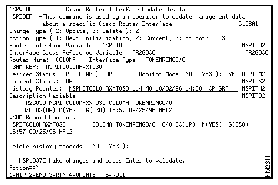
Step 1 On the Cisco Router Interface Detail Display panel of the interface, press F9. The Cisco Router Interface Update Display panel is displayed.
Figure 5-7: Cisco Router Interface Update Display Panel

Step 2 As necessary, make changes to any of the following fields:
- Change Type--Indicates whether you are updating or deleting an existing interface definition. To specify an option for this field, type the number representing the option.
- Action Type--Indicates whether you want to implement your changes to the interface definition at the next startup of NSP, implement them in the current session only, or implement them in the current session and save the changes for future sessions. To specify an option for this field, type the number representing the option.
- Desired Status--Indicates whether the desired status of the interface is up or down.
- Monitor Mode--Indicates whether the interface is to be actively monitored.
- Delete history records--Indicates whether to delete the history records archived for this router.
Step 3 When completed, press Enter to verify your changes and F4 to save the interface definition.
To display the details of an interface, on the List of Interfaces panel, position the cursor on the interface, and press F10. The Show Interface panel is displayed.
Figure 5-8: Show Interface Panel

Note Depending on the type of interface you select, the information displayed on this panel may vary.
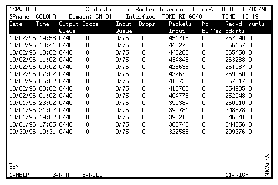
To display history data for an interface, on the List of Interfaces panel, position the cursor on the interface, and press F11. The history statistic records logged for that interface are displayed.
Figure 5-9: Logged Interface Statistics Panel

The following information is displayed on this panel:
- Date--Date the history data was logged.
- Time--Time the history data was logged.
- Output Queue--Number of packets in the output queue.
- Drops--Number of packets dropped because the queue is full.
- Input Queue--Number of packets in the input queue.
- Drops--Number of packets dropped because the queue is full.
- Packets Input--Total number of error-free packets received by the system.
- No Buffer--Number of received packets discarded because there was no buffer space in the main system.
- Recvd Bdcsts--Total number of broadcast or multicast packets received by the interface.
- runts--Number of packets that are discarded because they are smaller than the medium's minimum packet size.
Step 4 To display additional statistics, press F11.
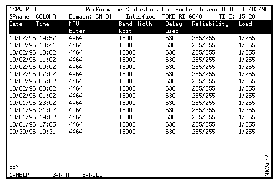
To display performance data for an interface, on the Interface Status panel, position the cursor on the interface for which you want to view performance data, and press F12. The logged performance statistics for that interface are displayed.
Figure 5-10: Logged Interface Performance Data

The following information is displayed on this panel:
- Date--Date the performance data was recorded.
- Time--Time the performance data was recorded
- MTU Bytes--Maximum transmission units (in bytes).
- Band Width Kbit--Bandwidth of the interface in kilobits per second.
- Delay usec--Delay of the interface in microseconds.
- Reliability--Reliability of the interface as a fraction of 255 (255/255 is 100 percent reliability), calculated as an exponential average over 5 minutes.
- Load--Load on the interface as a fraction of 255 (255/255 is completely saturated), calculated as an exponential average over 5 minutes.

