|
|

This chapter provides an overview of the Cisco Network Data Analyzer and how it operates with other system elements to form an integrated network management suite. The following topics are discussed in this chapter:
Release 3.0 of the Network Data Analyzer, formerly called the NetFlow FlowAnalyzer, incorporates the following new capabilities:
Previous releases of the Analyzer dealt exclusively with NetFlow data. Release 3.0 of the Analyzer enables you to also collect and analyze traffic matrix statistics (TMS) data.
Cisco IOS supports the export of TMS data. TMS data is useful for understanding traffic flows from a router to all IGP (Interior Gateway Protocol) destinations. TMS data can be used to derive a traffic matrix, which is essential for network design and traffic engineering.
The NetFlow functions and capabilities of the Analyzer described in this document depend on underlying data monitoring and exporting functionality embedded within Cisco IOS NetFlow Services software running on the Cisco routers or switches in your network from which traffic data is exported. The Cisco IOS NetFlow Services software executes in the "background" on the Cisco routers and switches in your network. A description of the NetFlow Services software is provided in Appendix A.
This document describes how you use the Analyzer to perform a variety of network traffic data collection and analysis tasks. However, information about the NetFlow FlowCollector is included in this document wherever appropriate to emphasize the complementary nature of this application in accomplishing data collection and storage tasks.
The network traffic data exporting devices and processes that underlie the functions of both the FlowCollector and the Analyzer are described in Appendix B.
The Analyzer is a client/server network management application that runs on Solaris and PC platforms. Together with its companion application, the NetFlow FlowCollector, the Analyzer enables you to collect and analyze traffic data pertaining to any number of communicating end nodes in your network.
Through collecting and analyzing data, you can:
The Analyzer Display module incorporates a powerful and extensive graphical user interface (GUI) that enables you to:
The Analyzer and its companion FlowCollector application enable you to collect, display, and analyze data that reflect the types, volumes, and patterns of traffic flowing from source nodes to destination nodes in your network.
Through the combined facilities of the Analyzer and the NetFlow FlowCollector, you can collect and analyze two types of network traffic data:
In both cases, Cisco IOS NetFlow Services software running on the export-enabled devices provides support for gathering traffic information. This software is described in Appendix A.
The processes by which NetFlow and TMS traffic data is captured, exported, and stored differ. The following sections contrast the NetFlow and TMS data collection processes.
The Analyzer consists of the modules enclosed within the dashed lines in Figure 1-1. These modules work in combination with other entities in the network to form an integrated network management suite. The Analyzer can handle both NetFlow data and TMS data independently from each other. The next two sections contrast these two different types of network traffic collection and monitoring methods.
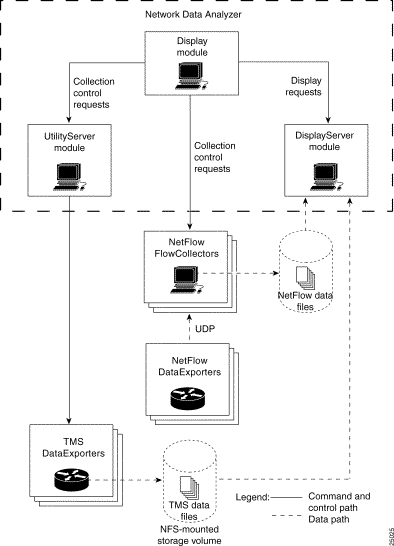
Figure 1-2 shows the interaction among the cooperating applications, components, and exporting devices in your network during the collection and display of NetFlow data. A NetFlow data collection requires that data collection parameters be configured appropriately on both the NetFlow FlowCollector and the NetFlow export-capable devices in your network.
You configure network devices for NetFlow data export by means of the NetFlow panel of the Router Configuration window (see the "Configuring Routers for Data Export" section.
You define and configure NetFlow data collections by means of the NetFlow Collection Control option of the Tools pull-down menu in the main Display module window (see the "Controlling NetFlow Data Collections" section). When you select this option, a NetFlow Collection Control window appears, enabling you to begin entering the required parameters for defining and controlling a NetFlow data collection process on the NetFlow FlowCollector.
When you configure NetFlow export-capable devices to operate in your network (see the entity labeled "NetFlow DataExporter" in Figure 1-2), the data traffic flowing through these devices are evaluated by the Cisco IOS NetFlow Services software running on those devices.
Based on specified traffic evaluation criteria, information about each traffic flow (involving communicating end nodes) is held in the NetFlow cache of the exporting device until Cisco IOS NetFlow Services software decides when it is appropriate to export the traffic data to a designated FlowCollector (see the entity labeled "NetFlow FlowCollector" in Figure 1-2). The traffic data is exported to the designated FlowCollector by means of UDP datagrams.
You request the display of NetFlow data through the Display module. The DisplayServer module fields the display request, retrieves the data from the appropriate FlowCollector, and passes the information to the Display module for presentation in the format of the selected aggregation scheme.
Since NetFlow data tends to be rich in content and highly granular, NetFlow data collections tend to generate numerous data files that require significant storage space in the FlowCollector.
The NetFlow data collection and processing entities are described in more detail in Appendix B.
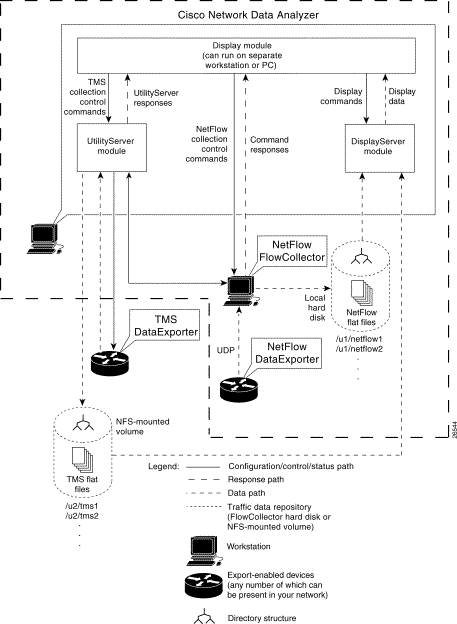
Figure 1-3 shows the interaction among the cooperating applications, components, and exporting devices in your network during the collection and display of TMS data.
You configure network devices for TMS data export by means of the TMS panel of the Router Configuration window (see the "Configuring Routers for Data Export" section.
You define and configure periodic TMS data collections by means of the TMS Collection Control option of the Tools menu in the main Display module window (see the "Controlling TMS Data Collections" section). By selecting this option, you gain access to a secondary Traffic Matrix Statistics Control window, which enables you to define the required parameters for a TMS data collection.
Parameters for defining new TMS data collections include:
Unlike NetFlow data collections, the export of TMS data is initiated on a scheduled basis by means of a CLI command issued by the UtilityServer to a TMS DataExporter device (see Figure 1-3). The resulting TMS data is stored on a designated NFS-mounted storage volume in the network.
You request the display of TMS data through the same on-screen selection and display mechanisms in the Display module as those used in selecting and displaying NetFlow data. The labeling and content of the columns in the TMS TrafficMatrix data aggregation scheme differ markedly from the columns of a NetFlow data aggregation scheme.
Typically, the volume of data generated from a TMS collection is much smaller than that from a NetFlow collection. Thus, TMS data collections consume less disk space on the designated storage device.
The TMS data collection and processing entities are described in more detail in Appendix B.
The term "data set path," as used throughout this document, is a generic term for a pointer to a directory on a device in your network on which traffic data is stored.
A data set path can point to either of two storage entities:
You can establish storage facilities in any location in your network for the online storage of exported traffic information.
You define one or more data set paths in the Data Set Navigation pane. Until you do this, the Display module has no basis for acting on user-initiated data retrieval and analysis tasks.
The Data Set Navigation pane can display any of the following:
A tree file is a named collection of individual data set paths that constitutes a working data tree structure (see the "Defining Tree Files" section).
A data set path or a working data tree structure consists of the following elements:
(a) Directory name---This element always appears left-justified (at root level) in the Data Set Navigation pane.
This name identifies a directory in a FlowCollector host or an NFS-mounted storage volume in the network known to contain collected traffic data. Such a directory pointer, for example, could take the form "/u1/LiveNFD."
(b) Devices---These elements always appear at the first indent of the Data Set Navigation pane.
Each device entry identifies a data exporting device in the network for which traffic data has been collected.
(c) Device interfaces and data aggregation schemes---Subsequent indents in the Data Set Navigation pane beyond the first indent identify the interfaces of the data exporting devices, if known, and the data aggregation schemes for which traffic data has been collected and stored.
Typically, a tree file serves as the basis for issuing a wide range of commands during a Display module session. You can compose, change, delete, or load a tree file at any time to meet your current or anticipated data analysis requirements.
For convenience in performing routine data analysis tasks on a recurring basis, you can define a tree file and load it by default at startup of a Display module session. The tree file contains a pre-defined working data tree structure, providing a ready means for selecting specific data set paths of interest for performing a variety of Display module tasks.
You can create a library of tree files and load each one individually to establish a working data tree structure for any Display module session. Thus, having a library of tree files that you can load at any time is an operational convenience.
As your data analysis interests and objectives change from one Display module session to another, you can:
For a description of how you define and use tree files, refer to the "Creating and Saving a Tree File" section in Chapter 3.
The Analyzer includes three modules (see Figure 1-2 and Figure 1-3):
The following sections describe these components and how they interact in accomplishing a variety of traffic data retrieval and display tasks.
The Display module is a stand-alone Java application that provides an easy-to-use, graphical user interface for the Analyzer.
To accommodate a wide range of data analysis tasks in a complex networking environment, you can run multiple instances of the Display module application on workstations or PCs in your network, each of which can be used to:
The main window of the Display module incorporates the facilities described in the following sections.
At initial startup, the main Display module window appears in a "clean" form on the host workstation or PC screen (see Figure 1-4). To make use of this window, you must first define one or more data set paths in the Data Set Navigation pane of this window. These data set paths serve as the basis for all Display module commands, since the data set paths function as directory pointers identifying the locations of network traffic data stored on FlowCollector hosts in your network.
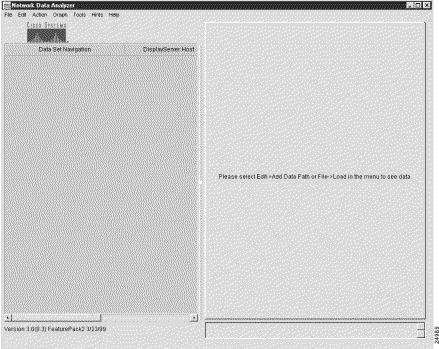
The message appearing in the right side of the Display module window at startup (see Figure 1-4) prompts you either to:
To perform any Display module task, you must first populate the Data Set Navigation pane of the Display module window with one or more data set paths or a working data tree structure. The directory pointers that you enter in the Data Set Navigation pane remain in effect until you deliberately change them.
The following actions change the contents of the Data Set Navigation pane, revising the existing working data tree structure (and, hence, the on-screen selection mechanisms) for initiating Display module tasks:
In the Data Set Navigation pane, you can select:
You can adjust the dimensions of the Data Set Navigation pane by means of:
It is recommended that you adjust the dimensions of the Data Set Navigation pane to make all the data tree elements fully visible in the pane.
A column in the Data Set Navigation pane, labeled DisplayServer Host, identifies the DisplayServer host used in retrieving traffic data from the designated storage device in your network.
By default, the DisplayServer Host area is not sized automatically for visibility on display of the main Display module window. To resize or expand this area, drag the square icon in the middle of the right margin of the Data Set Navigation pane in either horizontal direction.
It is best to resize the DisplayServer Host area after you populate the Data Set Navigation pane with all of the desired data set paths for your current Display module session. You can minimize the space occupied by the DisplayServer Host area to ensure complete visibility of all of the data set paths in the Data Set Navigation pane.
The display pane, although not labeled as such, occupies the large rectangular area in the right side of the main Display module window (see Figure 1-5). Traffic data retrieved from a designated storage device is mapped into the Display pane as a structured matrix of columns and rows like a spreadsheet.
Note from Figure 1-5 that the display pane is labeled with the name of the aggregation scheme selected in the Data Set Navigation pane (in this case, the NetFlow "DetailInterface" aggregation scheme).
The label in the top center of the display pane always reflects the name of the aggregation scheme that you select in the Data Set Navigation pane as the basis for Display module commands.
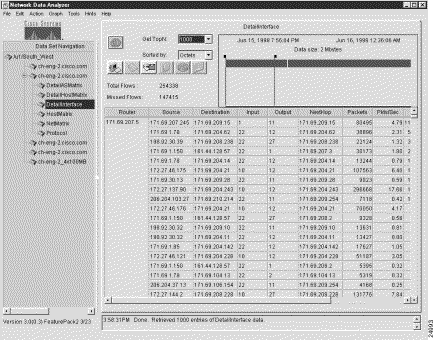
Since all of the rows and columns of a typical aggregation scheme data array cannot be viewed at a glance in the available space in the pane, horizontal and vertical scroll bars appear in the pane to enable you to traverse to any area in the overall data array.
The rectangular area occupying the space in the upper right area of the display pane incorporates two vertical time slider bars (see Figure 1-5). These two vertical bars represent the extremes of a time continuum. Each bar can be moved toward the other to establish a desired time horizon that you want to apply for intended traffic data retrieval and display operations.
As you move the mouse pointer into this area of the display pane, note that the time slider bars turn from black to yellow in color. You can position each time slider bar independently from the other by placing the mouse pointer on the bar, holding down the left mouse button, and dragging the bar to the desired position. As you do so, note that the content of the "date" and "Data size:" fields above the slider bars changes accordingly.
By positioning the time slider bars, you can establish any time desired horizon for governing data retrieval and display functions. Moving the time slider bars has the following effects:
Use the Get TopN pull-down menu near the top left corner of the display pane (see Figure 1-5) to select the number of traffic flows that you want taken into account for data display purposes.
For example, you can specify the top "N" packets, bytes, or flows that you want to apply for current display operations, where "N" can be any one of the following values:
Use the Sorted by pull-down menu located directly beneath the Get TopN pull-down menu (see Figure 1-5) to select the sort key by which traffic data is to be sorted for display functions. Using a sort key, you can "filter" traffic data according to one of the following:
Use the status bar at the bottom of the display pane (see Figure 1-5) to view the status of any requested or in-process Display module operation.
Chapter 3 describes how to invoke all of the functions incorporated into the user interface of the Display module, including additional pull-down menus and selectable icons.
The DisplayServer module, which you can run on one or more workstations in your network, fields user requests for traffic data issued at the console of a Display module.
The DisplayServer responds to user data display requests by:
The Display module then formats the data on the console screen in the format of the selected aggregation scheme.
The UtilityServer module provides the following services for the Analyzer:
![]()
![]()
![]()
![]()
![]()
![]()
![]()
![]()
Posted: Mon Jul 12 12:13:42 PDT 1999
Copyright 1989-1999©Cisco Systems Inc.