Table Of Contents
Managing Probes
Viewing Probes
Adding Probes
Editing Probes
Viewing HTTP Probes
Details
Adding HTTP Probes
Editing HTTP Probes
Viewing FTP Probes
Details
Adding FTP Probes
Editing FTP Probes
Viewing SMTP Probes
Details
Adding SMTP Probes
Editing SMTP Probes
Viewing TELNET Probes
Details
Adding TELNET Probes
Editing TELNET Probes
Viewing TCP Probes
Details
Adding TCP Probes
Editing TCP Probes
Viewing UDP Probes
Details
Adding UDP Probes
Editing UDP Probes
Viewing ICMP Probes
Details
Adding ICMP Probes
Editing ICMP Probes
Managing Probes
Associating probes to the real servers and server farms allows you to determine if the real servers are operating correctly.
CVDM-CSM supports probes to monitor real servers and lets you to configure them through CVDM-CSM.
This section includes the following topics:
• Viewing Probes
– Viewing HTTP Probes
– Viewing FTP Probes
– Viewing SMTP Probes
– Viewing TELNET Probes
– Viewing TCP Probes
– Viewing UDP Probes
– Viewing ICMP Probes
• Adding Probes
• Editing Probes
Viewing Probes
You can view information about all probes on the device.
To view the probes:
Step 1 Click Setup from the task bar.
Step 2 Click Probes in the left-most pane. A table with details of all configured Probes appears.
The following fields are displayed:
Field
|
Action/Action/Description
|
Probes
|
Name
|
Name of the Probe.
The character string is limited to 15 characters.
|
Type
|
Type of probe. The different types are http, ftp, smtp, telnet, telnet, tcp, udp and icmp.
|
Probe Interval
|
Number of seconds to wait between probes from the end of the previous probe to the beginning of the next probe.
|
Retry Count
|
Number of probes to wait before marking a server as failed.
|
Details
|
The details of the selected Probe is displayed.
For more information on HTTP, see "Viewing HTTP Probes" section.
For more information on FTP, see "Viewing FTP Probes" section.
For more information on SMTP, see "Viewing SMTP Probes" section.
For more information on TELNET, see "Viewing TELNET Probes" section.
For more information on TCP, see
Viewing TCP Probes.
For more information on UDP, see "Viewing UDP Probes" section.
Note UDP probes cannot be viewed in the following IOS versions: 12.1(13)E, 12.2(14)SY and 12.2(14)SX1.
For more information on ICMP, see "Viewing ICMP Probes" section.
|
From this page, you can access functions to do the following:
•Click Add to add probes. For more information, see "Adding Probes" section.
•Click Edit to add probes. For more information, see "Editing Probes" section.
•Select a Probe, then click Delete to delete the probe.
Adding Probes
To add Probes:
Step 1 Click Setup from the task bar.
Step 2 Click Probes in the left-most pane. A table with details of all configured Probes appears.
Step 3 Click Add. The Add Probes dialog box appears.
In the Type field, choose the type of Probe which you wish to add.
They are: HTTP,FTP,SMTP,TELNET,TCP,UDP,andICMP.
The fields in the pane changes as per the type of the Probe.
For more information on adding a HTTP Probe, see "Adding HTTP Probes" section.
For more information on adding a FTP Probe, see "Adding FTP Probes" section.
For more information on adding a SMTP Probe, see "Adding SMTP Probes" section.
For more information on adding a TELNET Probe, See "Adding TELNET Probes" section
For more information on adding a TCP Probe, see "Adding TCP Probes" section.
For more information on adding a UDP Probe, see "Adding UDP Probes" section.
For more information on adding a ICMP Probe, see "Adding ICMP Probes" section.
Editing Probes
To edit Probes:
Step 1 Click Setup from the task bar.
Step 2 Click Probes in the left-most pane. A table with details of all configured Probes appears.
Step 3 Select the Probe that you wish to modify and click Edit. The Edit Probes dialog box appears.
Step 4 In the Edit Probe pane, the field Type shows the type of Probe.
They are: HTTP,FTP,SMTP,TELNET,TCP,UDP,andICMP.
The fields in the pane changes as per the type of the Probe.
For more information on editing a HTTP Probe, see "Editing HTTP Probes" section.
For more information on editing a FTP Probe, see "Editing FTP Probes" section.
For more information on editing a SMTP Probe, see "Editing SMTP Probes" section.
For more information on editing a TELNET Probe, see "Editing TELNET Probes" section
For more information on editing a TCP Probe, see "Editing TCP Probes" section.
For more information on editing a UDP Probe, see "Editing UDP Probes" section.
For more information on editing a ICMP Probe, see "Editing ICMP Probes" section.
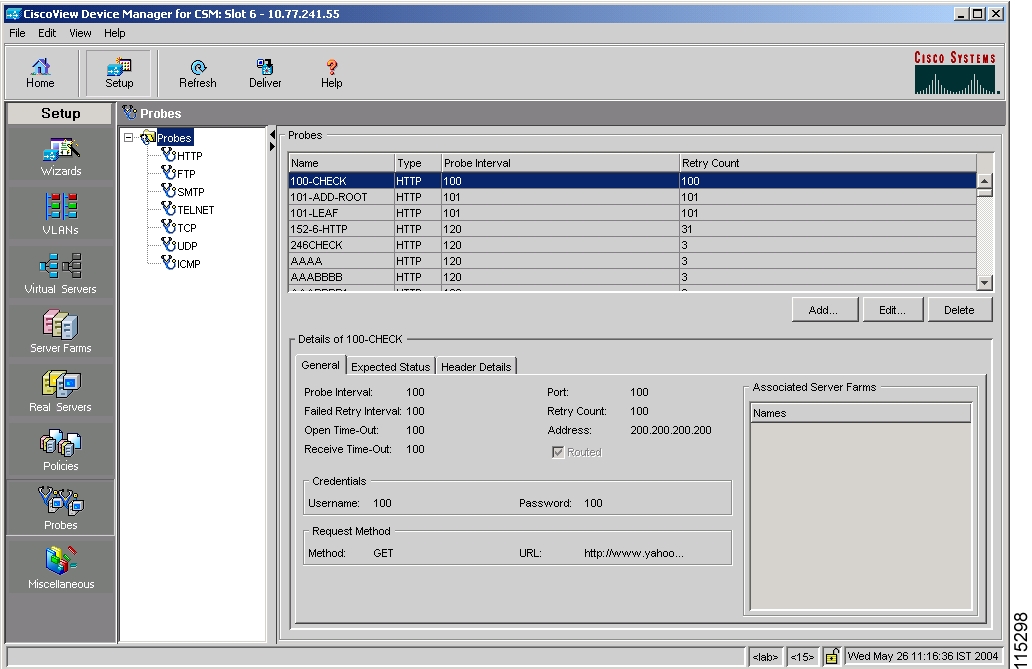
Viewing HTTP Probes
To view HTTP Probes:
Step 1 Click Setup from the task bar. Click Probes in the left-most pane.
Step 2 Select Probes > HTTP in the object selector.
The following fields appear:
Field
|
Action/Description
|
Name
|
Name of the probe.
|
Probe Interval
|
Number of seconds to wait between probes from the end of the previous probe to the beginning of the next probe.
|
Retry Count
|
Number of probes to wait before marking a server as failed.
|
Details
More details about the selected probe appear at the bottom of the table. These are of three types:
• General
• Expected Status
• Header Details
General
The following details appears:
Field
|
Action/Description
|
Details
|
Probe Interval
|
Number of seconds to wait between probes from the end of the previous probe to the beginning of the next probe.
|
Port
|
Decimal TCP/UDP port number or port name.
|
Failed Retry Interval
|
Time in seconds before retrying a failed server.
|
Retry Count
|
Number of probes to wait before marking a server as failed.
|
Open Time- Out
|
Maximum time in seconds to wait for a TCP connection.
|
Address
|
IP address of the real server .
|
Receive Time-Out
|
Maximum time in seconds to wait for a reply from real server.
|
Routed
|
Displays the check box status, Selected or unselected.
Specifies that the probe is routed according to the CSM routing table.
|
User Credentials
|
Username
|
Name that appears in the HTTP header.
|
Password
|
Password that appears in the HTTP header.
|
Associated Server Farms
|
Server Farm associated with the probe.
All servers in the server farm receive probes of the probe types that are associated with that server farm.
You can associate one or more probe types with a server farm.
|
Expected Status
The following details appears:
Field
|
Action/Description
|
Expected Status
|
Minimum Value
|
Minimum status code in a range. There will be only a single status code if max-number is not specified.
|
Maximum Value
|
Maximum status code in a range.
|
Header Details
The following details appears:
Field
|
Action/Description
|
Header name and value
|
Name
|
Name for the header being defined.
|
Value
|
Content for the header.
|
From this page, you can access functions to do the following:
•Click Add to add HTTP Probes. For more information, see "Adding HTTP Probes" section.
•Click Edit to edit an HTTP Probes. For more information, see "Editing HTTP Probes" section.
•Select a HTTP Probe, then click Delete to delete the Probe.
Adding HTTP Probes
To add HTTP Probes:
Step 1 Click Setup from the task bar. Click Probes in the left-most pane.
Step 2 Select Probes > HTTP in the object selector.
Step 3 Click Add. The Add Probe dialog box appears.
The following details appears:
Field
|
Action/Description
|
Name
|
Enter the name of the probe.
The character string is limited to 15 characters.
|
Type
|
The type HTTP is displayed.
|
Port l
|
Enter the decimal TCP/UDP port number or port name.
The range is from 1 to 65535.
|
Retry Count
|
Enter the number of probes to wait before marking a server as failed.
The range is from 0 to 65535. The defualt value is 3.
|
Probe Interval
|
Enter the number of seconds to wait between probes from the end of the previous probe to the beginning of the next probe.
The range is from 2 to 65535. The default value is 120.
|
Failed Retry Interval
|
Enter the time in seconds before retrying a failed server.
The range is from 2 to 65535. The default value is 300.
|
Open Time- Out
|
Enter the maximum time in seconds to wait for a TCP connection. The range is from 1 to 65535 Secs. The default value is 10.
|
Receive Time-Out
|
Enter the maximum time in seconds to wait for a reply from real server The range is from 1 to 65535 Secs. The default value is 10.
|
Address
|
Enter the IP address of the real server. The check box for Routed adjacent to this field shows if the probe is routed according to the CSM routing table
|
User Credentials
|
Username
|
Enter the name that appears in the HTTP header.
|
Password
|
Enter the password that appears in the HTTP header.
|
Expected Status
|
Minimum Value
|
Click Add and enter the minimum status code in a range. There will be only a single status code if max-number is not specified.
The default range is 0 to 999.
Note You cannot add overlapping status code. The range should be outside what you have already added.
|
Maximum Value
|
Enter the maximum status code in a range.
The default range is 0 to 999.
Note You cannot add overlapping status code. The range should be outside what you have already added.
|
Header name and value
|
Name
|
Click Add, then enter the name for the header being defined.
|
Value
|
Enter the content for the header.
|
Editing HTTP Probes
To edit HTTP Probes:
Step 1 Click Setup from the task bar. Click Probes in the left-most pane.
Step 2 Select Probes > HTTP in the object selector.
Step 3 Click Edit. The Edit Probe dialog box appears.
The following details appears:
Field
|
Action/Description
|
Name
|
The name of the probe.
|
Port
|
Modify the decimal TCP/UDP port number or port name. The range is from 0 to 65535.
|
Type
|
Type of probe.
Here it will be HTTP.
|
Retry Count
|
Enter the number of probes to wait before marking a server as failed.
The range is from 0 to 65535.
|
Probe Interval
|
Enter the number of seconds to wait between probes from the end of the previous probe to the beginning of the next probe.
The range is from 2 to 65535.
|
Failed Retry Interval
|
Enter the time in seconds before retrying a failed server.
The range is from 2 to 65535.
|
Open Time- Out
|
Enter the maximum time in seconds to wait for a TCP connection. The range is from 1to 65535 Secs.
|
Receive Time-Out
|
Enter the maximum time in seconds to wait for a reply from real server. The range is from 1to 65535 Secs.
|
Address
|
Modify the IP address of the real server. The check box for Routed adjacent to this field shows if the probe is routed according to the CSM routing table
|
User Credentials
|
Username
|
Modify the name that appears in the HTTP header.
|
Password
|
Modify the password that appears in the HTTP header.
|
Expected Status
|
Minimum Value
|
Click Add. Modify the minimum status code in a range. There will be only a single status code if max-number is not specified.
The default range is 0 to 999.
Note You cannot add overlapping status code. The range should be outside what you have already added.
|
Maximum Value
|
Modify the maximum status code in a range.
The default range is 0 to 999.
Note You cannot add overlapping status code. The range should be outside what you have already added.
|
Header name and value
|
Name
|
Click Add. Modify the name for the header being defined.
|
Value
|
Modify the content for the header.
|
Viewing FTP Probes
To view FTP Probes:
Step 1 Click Setup from the task bar. Click Probes in the left-most pane.
Step 2 Select Probes > FTP in the object selector.
The following fields appears:
Field
|
Action/Description
|
Name
|
Name of the probe.
|
Probe Interval
|
Number of seconds to wait between probes from the end of the previous probe to the beginning of the next probe.
|
Retry Count
|
Number of probes to wait before marking a server as failed.
|
Details
More details about the selected probe appear at the bottom of the table. These are of two types:
• General
• Expect Status
General
The following details appears:
Field
|
Action/Description
|
Port
|
Decimal TCP/UDP port number or port name.
|
Retry Count
|
Number of probes to wait before marking a server as failed.
|
Probe Interval
|
Number of seconds to wait between probes from the end of the previous probe to the beginning of the next probe.
|
Failed Retry Interval
|
Time in seconds before retrying a failed server.
|
Open Time-Out
|
Maximum time in seconds to wait for a TCP connection.
|
Receive Time-Out
|
Maximum time in seconds to wait for a reply from real server.
|
Associated Server Farm
|
The Server Farm associated with the probe.
All servers in the server farm receive probes of the probe types that are associated with that server farm.
You can associate one or more probe types with a server farm.
|
Expect Status
The following details appears:
Field
|
Action/Description
|
Minimum Value
|
Minimum status code in a range. There will be only a single status code if max-number is not specified.
|
Maximum Value
|
Maximum status code in a range.
|
From this page, you can access functions to do the following:
•Click Add to add FTP Probes. For more information, see "Adding FTP Probes" section
•Click Edit to edit a FTP Probes. For more information, see "Editing FTP Probes" section.
•Select a FTP Probe, then click Delete to delete the probe.
Adding FTP Probes
To add FTP Probes:
Step 1 Click Setup from the task bar. Click Probes in the left-most pane.
Step 2 Select Probes > FTP in the object selector.
Step 3 Click Add. The Add Probe dialog box appears.
The following fields appears:
Field
|
Action/Description
|
Name
|
Enter the name of the probe.
The character string is limited to 15 characters.
|
Type
|
Displays the type of probe. Here it will be FTP.
|
Probe Interval
|
Enter the number of seconds to wait between probes from the end of the previous probe to the beginning of the next probe.
The range is from 2 to 65535. The default value is 120.
|
Failed Retry Interval
|
Enter the time in seconds before retrying a failed server; the range is from 2 to 65535. The default value is 300.
|
Open Time- Out
|
Enter the maximum time in seconds to wait for a TCP connection. The range is from 1 to 65535 Secs. The default value is 10.
|
Receive Time-Out
|
Enter the maximum time in seconds to wait for a reply from real server. The range is from 1 to 65535 Secs. The default value is 10.
|
Port
|
Enter the decimal TCP/UDP port number or port name. The range is from 1 to 65535.
|
Retry Count
|
Enter the number of probes to wait before marking a server as failed.
The range is from 0 to 65535. The default value is 3.
|
Expected Status
|
Minimum Value
|
Click Add. Enter the minimum status code in a range. There will be only a single status code if max-number is not specified.
The default range is 0 to 999.
Note You cannot add overlapping status code. The range should be outside what you have already added.
|
Maximum Value
|
Enter the maximum status code in a range.
The default range is 0 to 999.
Note You cannot add overlapping status code. The range should be outside what you have already added.
|
From this page, you can access functions to do the following:
•Click Add to add expect status details by adding the minimum and maximum expect status.
•Select a row and click Delete to delete the expect status.
Editing FTP Probes
To edit FTP Probes:
Step 1 Click Setup from the task bar. Click Probes in the left-most pane.
Step 2 Select Probes > FTP in the object selector.
Step 3 Click Edit. The Edit Probe dialog box appears.
The following details appears:
Field
|
Action/Description
|
Name
|
The name of the probe.
|
Type
|
Type of probe.
Here it will be FTP.
|
Probe Interval
|
Modify the number of seconds to wait between probes from the end of the previous probe to the beginning of the next probe.
The range is from 2 to 65535.
|
Failed Retry Interval
|
Modify the time in seconds before retrying a failed server; the range is from 2 to 65535.
|
Open Time- Out
|
Modify the maximum time in seconds to wait for a TCP connection. The range is from 1 to 65535 Secs.
|
Receive Time-Out
|
Modify the maximum time in seconds to wait for a reply from real server. The range is from 1 to 65535 Secs.
|
Port
|
Modify the decimal TCP/UDP port number or port name.
The range is from 1 to 65535.
|
Retry Count
|
Modify the number of probes to wait before marking a server as failed.
The range is from 0 to 65535.
|
Expected Status
|
Minimum Value
|
Click Add. Modify the minimum status code in a range. There will be only a single status code if max-number is not specified.
The default range is 0 to 999.
Note You cannot add overlapping status code. The range should be outside what you have already added.
|
Maximum Value
|
Modify the maximum status code in a range.
The default range is 0 to 999.
Note You cannot add overlapping status code. The range should be outside what you have already added.
|
Viewing SMTP Probes
To view SMTP Probes:
Step 1 Click Setup from the task bar. Click Probes in the left-most pane.
Step 2 Select Probes > SMTP in the object selector.
The following details appears:
Field
|
Action/Description
|
Name
|
Name of the probe.
|
Probe Interval
|
Number of seconds to wait between probes from the end of the previous probe to the beginning of the next probe.
|
Retry Count
|
Number of probes to wait before marking a server as failed.
|
Details
More details about the selected probe appear at the bottom of the table. These are of two types:
• General
• Expect Status
General
The following details appears:
Field
|
Action/Description
|
Probe Interval
|
Number of seconds to wait between probes from the end of the previous probe to the beginning of the next probe.
|
Port
|
Decimal TCP/UDP port number or port name.
|
Failed Retry Interval
|
Time in seconds before retrying a failed server.
|
Retry Count
|
Number of probes to wait before marking a server as failed.
|
Open Time- Out
|
Maximum time in seconds to wait for a TCP connection.
|
Receive Time-Out
|
Maximum time in seconds to wait for a reply from real server.
|
Associated Server Farm
|
The Server Farm associated with the probe.
All servers in the server farm receive probes of the probe types that are associated with that server farm.
You can associate one or more probe types with a server farm.
|
Expect Status
The following details appears.
Field
|
Action/Description
|
Minimum Value
|
Minimum status code in a range. There will be only a single status code if max-number is not specified.
|
Maximum Value
|
Maximum status code in a range.
|
From this page, you can access functions to do the following:
•Click Add to add SMTP Probes. For more information, see "Adding SMTP Probes" section.
•Click Edit to edit a SMTP Probe. For more information, see "Editing SMTP Probes" section.
•Select a SMTP Probe, then click Delete to delete the Probe.
Adding SMTP Probes
To add SMTP Probes:
Step 1 Click Setup from the task bar. Click Probes in the left-most pane.
Step 2 Select Probes > SMTP in the object selector.
Step 3 Click Add. The Add Probe dialog box appears.
The following details appears.
Field
|
Action/Description
|
Name
|
Enter the name of the probe.
The character string is limited to 15 characters.
|
Type
|
Displays the type of probe.
Here it will be SMTP.
|
Probe Interval
|
Enter the number of seconds to wait between probes from the end of the previous probe to the beginning of the next probe.
The range is from 2 to 65535. The default value is 120.
|
Failed Retry Interval
|
Enter the time in seconds before retrying a failed server; the range is from 2 to 65535. The default value is 300.
|
Open Time- Out
|
Enter the maximum time in seconds to wait for a TCP connection. The range is from 1 to 65535 Secs. The default value is 10.
|
Receive Time-Out
|
Enter the maximum time in seconds to wait for a reply from real server. The range is from 1 to 65535 Secs. The default value is 10.
|
Port
|
Enter the decimal TCP/UDP port number or port name. The range is from 1 to 65535.
|
Retry Count
|
Enter the number of probes to wait before marking a server as failed.
The range is from 0 to 65535. The default value is 3.
|
Expected Status
|
Minimum Value
|
Click Add. Enter the minimum status code in a range. There will be only a single status code if max-number is not specified.
The default range is 0 to 999.
Note You cannot add overlapping status code. The range should be outside what you have already added.
|
Maximum Value
|
Enter the maximum status code in a range.
The default range is 0 to 999.
Note You cannot add overlapping status code. The range should be outside what you have already added.
|
From this page, you can access functions to do the following:
•Click Add to add expect status details by adding the minimum and maximum expect status.
•Select a row and click Delete to delete the expect status.
Editing SMTP Probes
To edit SMTP Probes:
Step 1 Click Setup from the task bar. Click Probes in the left-most pane.
Step 2 Select Probes > SMTP in the object selector.
Step 3 Click Edit. The Edit Probe dialog box appears.
The following details appears:
Field
|
Action/Description
|
Name
|
Name of the probe.
|
Type
|
Type of probe.
Here it will be SMTP.
|
Probe Interval
|
Modify the number of seconds to wait between probes from the end of the previous probe to the beginning of the next probe.
The range is from 2 to 65535.
|
Failed Retry Interval
|
Modify the time in seconds before retrying a failed server; the range is from 2 to 65535.
|
Open Time- Out
|
Modify the maximum time in seconds to wait for a TCP connection. The range is from 1 to 65535 Secs.
|
Receive Time-Out
|
Modify the maximum time in seconds to wait for a reply from real server. The range is from 1 to 65535 Secs.
|
Port
|
Modify the decimal TCP/UDP port number or port name. The range is from 1 to 65535.
|
Retry Count
|
Modify the number of probes to wait before marking a server as failed.
The range is from 0 to 65535.
|
Expected Status
|
Minimum Value
|
Click Add. Modify the minimum status code in a range. There will be only a single status code if max-number is not specified.
The default range is 0 to 999.
Note You cannot add overlapping status code. The range should be outside what you have already added.
|
Maximum Value
|
Modify the maximum status code in a range.
The default range is 0 to 999.
Note You cannot add overlapping status code. The range should be outside what you have already added.
|
Viewing TELNET Probes
To view TELNET Probes:
Step 1 Click Setup from the task bar. Click Probes in the left-most pane.
Step 2 Select Probes > TELNET in the object selector.
The following details appears:
Field
|
Action/Description
|
Name
|
Name of the probe.
|
Interval
|
Number of seconds to wait between probes from the end of the previous probe to the beginning of the next probe.
|
Retry Count
|
Number of probes to wait before marking a server as failed.
|
Details
More details about the selected probe appear at the bottom of the table. These are of two types:
• General
• Expect Status
General
The following details appears:
Field
|
Action/Description
|
Probe Interval
|
Number of seconds to wait between probes from the end of the previous probe to the beginning of the next probe.
|
Port
|
Decimal TCP/UDP port number or port name.
|
Failed Retry Interval
|
Time in seconds before retrying a failed server.
|
Retry Count
|
Number of probes to wait before marking a server as failed.
|
Open Time- Out
|
Maximum time in seconds to wait for a TCP connection.
|
Receive Time-Out
|
Maximum time in seconds to wait for a reply from real server.
|
Associated Server Farm
|
The Server Farm associated with the probe.
All servers in the server farm receive probes of the probe types that are associated with that server farm.
You can associate one or more probe types with a server farm.
|
Expect Status
The following details appears:
Field
|
Action/Description
|
Minimum Value
|
Minimum status code in a range. There will be only a single status code if max-number is not specified.
|
Maximum Value
|
Maximum status code in a range.
|
From this page, you can access functions to do the following:
•Click Add to add TELNET probes. For more information, see "Adding TELNET Probes" section.
•Click Edit to edit a TELNET probe. For more information, see "Editing TELNET Probes" section.
•Select a TELNET probe, then click Delete to delete the Probe.
Adding TELNET Probes
To add TELNET Probes:
Step 1 Click Setup from the task bar. Click Probes in the left-most pane.
Step 2 Select Probes > TELNET in the object selector.
Step 3 Click Add. The Add Probe dialog box appears.
The following details appears:
Field
|
Action/Description
|
Name
|
Enter the name of the probe.
The character string is limited to 15 characters.
|
Type
|
Displays the type of probe.
Here it will be TELNET.
|
Probe Interval
|
Enter the number of seconds to wait between probes from the end of the previous probe to the beginning of the next probe.
The range is from 2 to 65535. The default value is 120.
|
Failed Retry Interval
|
Enter the time in seconds before retrying a failed server; the range is from 2 to 65535. The default value is 300.
|
Open Time- Out
|
Enter the maximum time in seconds to wait for a TCP connection. The range is from 1-65535 Secs. The default value is 10.
|
Receive Time-Out
|
Enter the maximum time in seconds to wait for a reply from real server. The range is from 1-65535 Secs. The default value is 10.
|
Port
|
Enter the decimal TCP/UDP port number or port name.
|
Retry Count
|
Enter the number of probes to wait before marking a server as failed.
The range is from 0 to 65535. The default value is 3.
|
Expected Status
|
Minimum Value
|
Click Add. Enter the minimum status code in a range. There will be only a single status code if max-number is not specified.
The default range is 0 to 999.
Note You cannot add overlapping status code. The range should be outside what you have already added.
|
Maximum Value
|
Enter the maximum status code in a range.
The default range is 0 to 999.
Note You cannot add overlapping status code. The range should be outside what you have already added.
|
From this page, you can access functions to do the following:
•Click Add to add expect status details by adding the minimum and maximum expect status.
•Select a row and click Delete to delete the expect status.
Editing TELNET Probes
To edit TELNET Probes:
Step 1 Click Setup from the task bar. Click Probes in the left-most pane.
Step 2 Select Probes > TELNET in the object selector.
Step 3 Click Edit. The Edit Probe dialog box appears.
The following details appears:
Field
|
Action/Description
|
Name
|
Name of the probe.
|
Type
|
Type of probe.
Here it will be TELNET.
|
Probe Interval
|
Modify the number of seconds to wait between probes from the end of the previous probe to the beginning of the next probe.
The range is from 2 to 65535.
|
Failed Retry Interval
|
Modify the time in seconds before retrying a failed server; the range is from 2 to 65535.
|
Open Time- Out
|
Modify the maximum time in seconds to wait for a TCP connection. The range is from 1 to 65535 Secs.
|
Receive Time-Out
|
Modify the maximum time in seconds to wait for a reply from real server. The range is from 1 to 65535 Secs.
|
Port
|
Modify the decimal TCP/UDP port number or port name. The range is from 1 to 65535.
|
Retry Count
|
Modify the number of probes to wait before marking a server as failed.
The range is from 0 to 65535.
|
Expected Status
|
Minimum Value
|
Click Add. Modify the minimum status code in a range. There will be only a single status code if max-number is not specified.
The default range is 0 to 999.
Note You cannot add overlapping status code. The range should be outside what you have already added.
|
Maximum Value
|
Modify the maximum status code in a range.
The default range is 0 to 999.
Note You cannot add overlapping status code. The range should be outside what you have already added.
|
Viewing TCP Probes
To view TCP Probes:
Step 1 Click Setup from the task bar. Click Probes in the left-most pane.
Step 2 Select Probes > TCP in the object selector.
The following details appears:
Field
|
Action/Description
|
Name
|
Name of the probe.
|
Interval
|
Number of seconds to wait between probes from the end of the previous probe to the beginning of the next probe.
|
Retry Count
|
Number of probes to wait before marking a server as failed.
|
Details
More details about the selected probe appear at the bottom of the table.
The following details appears:
Field
|
Action/Description
|
Probe Interval
|
Number of seconds to wait between probes from the end of the previous probe to the beginning of the next probe.
|
Port
|
Decimal TCP/UDP port number or port name.
|
Failed Retry Interval
|
Time in seconds before retrying a failed server.
|
Retry Count
|
Number of probes to wait before marking a server as failed.
|
Open Time- Out
|
Maximum time in seconds to wait for a TCP connection.
|
Receive Time-Out
|
Maximum time in seconds to wait for a reply from real server.
|
Associated Server Farm
|
The Server Farm associated with the probe.
All servers in the server farm receive probes of the probe types that are associated with that server farm.
You can associate one or more probe types with a server farm.
|
From this page, you can access functions to do the following:
•Click Add to add TCP probes. For more information, see "Adding TCP Probes" section.
•Click Edit to edit a TCP probe. For more information, see "Editing TCP Probes" section.
•Select a TCP probe, then click Delete to delete the probe.
Adding TCP Probes
To add TCP Probes:
Step 1 Click Setup from the task bar. Click Probes in the left-most pane.
Step 2 Select Probes > TCP in the object selector.
Step 3 Click Add. The Add Probe dialog box appears.
The following details appears:
Field
|
Action/Description
|
Name
|
Enter the name of the probe.
The character string is limited to 15 characters.
|
Type
|
Type of probe.
Here it will be TCP.
|
Probe Interval
|
Enter the number of seconds to wait between probes from the end of the previous probe to the beginning of the next probe.
The range is from 2 to 65535. The default value is 120.
|
Failed Retry Interval
|
Enter the time in seconds before retrying a failed server; the range is from 2 to 65535. The default value is 300.
|
Open Time- Out
|
Enter the maximum time in seconds to wait for a TCP connection. The range is from 1-65535 Secs. The default value is 10.
|
Port
|
Enter the decimal TCP/UDP port number or port name. The range is from 1 to 65535.
|
Editing TCP Probes
To edit TCP Probes:
Step 1 Click Setup from the task bar. Click Probes in the left-most pane.
Step 2 Select Probes > FTP in the object selector.
Step 3 Click Edit. The Edit Probe dialog box appears.
The following details appears:
Field
|
Action/Description
|
Name
|
Name of the probe.
|
Type
|
Type of probe.
Here it will be TCP.
|
Probe Interval
|
Modify the number of seconds to wait between probes from the end of the previous probe to the beginning of the next probe.
The range is from 2 to 65535.
|
Failed Retry Interval
|
Modify the time in seconds before retrying a failed server; the range is from 2 to 65535.
|
Open Time- Out
|
Modify the maximum time in seconds to wait for a TCP connection. The range is from 1 to 65535 Secs.
|
Port
|
Modify the decimal TCP/UDP port number or port name. The range is from 1 to 65535.
|
Viewing UDP Probes
Note UDP probes cannot be viewed in the following IOS versions: 12.1(13)E, 12.2(14)SY and 12.2(14)SX1.
To view UDP Probes:
Step 1 Click Setup from the task bar. Click Probes in the left-most pane.
Step 2 Select Probes > UDP in the object selector.
The following details appears:
Field
|
Action/Description
|
Name
|
Name of the probe.
|
Interval
|
Number of seconds to wait between probes from the end of the previous probe to the beginning of the next probe.
|
Retry Count
|
Number of probes to wait before marking a server as failed.
|
Details
More details about the selected probe appear at the bottom of the table.
The following details appears:
Field
|
Action/Description
|
Probe Interval
|
Number of seconds to wait between probes from the end of the previous probe to the beginning of the next probe.
|
Port
|
Decimal TCP/UDP port number or port name.
|
Failed Retry Interval
|
Time in seconds before retrying a failed server.
|
Retry Count
|
Number of probes to wait before marking a server as failed.
|
Receive Time-Out
|
Maximum time in seconds to wait for a reply from real server.
|
Associated Server Farm
|
The Server Farm associated with the probe.
All servers in the server farm receive probes of the probe types that are associated with that server farm.
You can associate one or more probe types with a server farm.
|
From this page, you can access functions to do the following:
•Click Add to add UDP Probes. For more information, see "Adding UDP Probes" section.
•Click Edit to edit a UDP Probe. For more information, see "Editing UDP Probes" section.
•Select a UDP probe, then click Delete to delete the Probe.
Adding UDP Probes
To add UDP Probes:
Step 1 Click Setup from the task bar. Click Probes in the left-most pane.
Step 2 Select Probes > UDP in the object selector.
Step 3 Click Add. The Add Probe dialog box appears.
The following details appears:
Field
|
Action/Description
|
Name
|
Enter the name of the probe.
The character string is limited to 15 characters.
|
Type
|
Type of probe.
Here it will be UDP.
|
Probe Interval
|
Enter the number of seconds to wait between probes from the end of the previous probe to the beginning of the next probe.
The range is from 2 to 65535. The default value is 120.
|
Failed Retry Interval
|
Enter the time in seconds before retrying a failed server; the range is from 2 to 65535. The default value is 300.
|
Receive Time-Out
|
Enter the maximum time in seconds to wait for a reply from real server. The range is from 1 to 65535 Secs. The default value is 10.
|
Port
|
Enter the decimal TCP/UDP port number or port name. The range is from 1 to 65535.
|
Editing UDP Probes
To edit UDP Probes:
Step 1 Click Setup from the task bar. Click Probes in the left-most pane.
Step 2 Select Probes > UDP in the object selector.
Step 3 Click Edit. The Edit Probe dialog box appears.
The following details appears:
Field
|
Action/Description
|
Name
|
Name of the probe.
|
Type
|
Type of probe.
Here it will be UDP.
|
Probe Interval
|
Modify the number of seconds to wait between probes from the end of the previous probe to the beginning of the next probe.
The range is from 2 to 65535.
|
Failed Retry Interval
|
Modify the time in seconds before retrying a failed server; the range is from 2 to 65535.
|
Receive Time-Out
|
Modify the maximum time in seconds to wait for a reply from real server. The range is from 1-65535 Secs.
|
Port
|
Modify the decimal TCP/UDP port number or port name. The range is from 1 to 65535.
|
Viewing ICMP Probes
To view ICMP Probes:
Step 1 Click Setup from the task bar. Click Probes in the left-most pane.
Step 2 Select Probes > ICMP in the object selector.
The following details appears:
Field
|
Action/Description
|
Name
|
Name of the probe.
|
Probe Interval
|
Number of seconds to wait between probes from the end of the previous probe to the beginning of the next probe.
|
Retry Count
|
Number of probes to wait before marking a server as failed.
|
Details
More details about the selected probe appear at the bottom of the table
The following details appears:
Field
|
Action/Description
|
Probe Interval
|
Number of seconds to wait between probes from the end of the previous probe to the beginning of the next probe.
|
Retry Count
|
Number of probes to wait before marking a server as failed.
|
Failed Retry Interval
|
Time in seconds before retrying a failed server.
|
Address
|
The IP address of the probes.
|
Receive Time-Out
|
Maximum time in seconds to wait for a reply from real server.
|
Routed
|
Displays the check box status, Selected or unselected.
Specifies that the probe is routed according to the CSM routing table.
|
Associated Server Farm
|
The Server Farm associated with the probe.
All servers in the server farm receive probes of the probe types that are associated with that server farm.
You can associate one or more probe types with a server farm.
|
From this page, you can access functions to do the following:
•Click Add to add ICMP probes. For more information, see "Adding ICMP Probes" section.
•Click Edit to edit an ICMP probe. For more information, see "Editing ICMP Probes" section.
•Select a ICMP probe, then click Delete to delete the probe.
Adding ICMP Probes
To add ICMP Probes:
Step 1 Click Setup from the task bar. Click Probes in the left-most pane.
Step 2 Select Probes > ICMP in the object selector.
Step 3 Click Add. The Add Probe dialog box appears.
The following details appears:
Field
|
Action/Description
|
Name
|
Enter the name of the probe.
The character string is limited to 15 characters.
|
Type
|
Type of probe.
Here it will be ICMP.
|
Probe Interval
|
Enter the number of seconds to wait between probes from the end of the previous probe to the beginning of the next probe.
The range is from 2 to 65535. The default value is 120.
|
Failed Retry Interval
|
Enter the time in seconds before retrying a failed server; the range is from 2 to 65535. The default value is 300.
|
Receive Time-Out
|
Enter the maximum time in seconds to wait for a reply from real server The range is from 1 to 65535 Secs. The default value is 10.
|
Retry Count
|
Enter the number of probes to wait before marking a server as failed.
The range is from 0 to 65535. The defualt value is 3.
|
Address
|
Enter the IP address of the real server .
|
Routed
|
Select the check box to specify that the probe should be routed according to the CSM routing table.
|
Editing ICMP Probes
To edit ICMP Probes:
Step 1 Click Setup from the task bar. Click Probes in the left-most pane.
Step 2 Select Probes > FTP in the object selector.
Step 3 Click Edit. The Edit Probe dialog box appears.
The following details appears:
Field
|
Action/Description
|
Name
|
Name of the probe.
|
Type
|
Type of probe.
Here it will be icmp.
|
Probe Interval
|
Modify the number of seconds to wait between probes from the end of the previous probe to the beginning of the next probe.
The range is from 2 to 65535.
|
Failed Retry Interval
|
Modify the time in seconds before retrying a failed server; the range is from 2 to 65535.
|
Receive Time-Out
|
Modify the maximum time in seconds to wait for a reply from real server. The range is from 1 to 65535 Secs.
|
Retry Count
|
Enter the number of probes to wait before marking a server as failed.
The range is from 0 to 65535.
|
Address
|
Modify the IP address of the real server.
|
Routed
|
Displays the check box status, Selected or unselected.
Specifies that the probe is routed according to the CSM routing table.
|