|
|

Table Of Contents
Alarm and TCA Monitoring and Management
16.2 Alarm Counts on the LCD for a Node, Slot, or Port
16.3.1 Viewing Alarms by Time Zone
16.3.2 Controlling Alarm Display
16.3.5 Controlling the Conditions Display
16.3.7 Alarm History and Log Buffer Capacities
16.5.1 Creating and Modifying Alarm Profiles
16.5.6 Applying Alarm Profiles
16.6 External Alarms and Controls
16.7.1 Alarms Suppressed for Maintenance
16.7.2 Alarms Suppressed by User Command
16.8 Multishelf Configuration Alarming
16.8.1 Viewing Multishelf Alarmed Entities
16.8.2 Multishelf-Specific Alarming
16.9 Threshold Crossing Alert Suppression
16.9.2 G.709, SONET, and SDH TCA Groups
Alarm and TCA Monitoring and Management
This chapter describes Cisco Transport Controller (CTC) alarm and threshold crossing alert (TCA) monitoring and management. To troubleshoot specific alarms, refer to the Cisco ONS 15454 DWDM Troubleshooting Guide.
Note
Unless otherwise specified, "ONS 15454" refers to both ANSI and ETSI shelf assemblies.
Chapter topics include:
•
•
•
•
•
16.1 Overview
CTC detects and reports alarms generated by the Cisco ONS 15454 and the larger network. You can use CTC to monitor and manage alarms at the card, node, or network level. Default alarm severities conform to the Telcordia GR-474-CORE standard, but you can set alarm severities in customized alarm profiles or suppress CTC alarm reporting. For a detailed description of the standard Telcordia categories employed by Optical Networking System (ONS) nodes, refer to the Cisco ONS 15454 DWDM Troubleshooting Guide.
Note
16.2 Alarm Counts on the LCD for a Node, Slot, or Port
You can view node, slot, or port-level alarm counts and summaries using the buttons on the ONS 15454 LCD panel. The Slot and Port buttons toggle between display types; the Slot button toggles between node display and slot display, and the Port button toggles between slot and port views. Pressing the Status button after you choose the display mode changes the display from alarm count to alarm summary.
The ONS 15454 has a one-button update for some commonly viewed alarm counts. If you press the Slot button once and then wait eight seconds, the display automatically changes from a slot alarm count to a slot alarm summary. If you press the Port button to toggle to port-level display, you can use the Port button to toggle to a specific slot and to view each port's port-level alarm count. Figure 16-1 shows the LCD panel layout.
Figure 16-1 Shelf LCD Panel
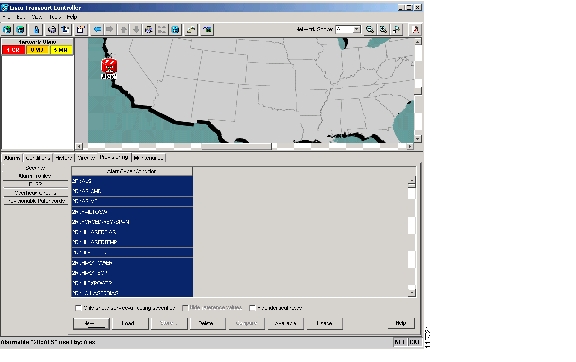
16.3 Alarm Display
In the card, node, or network CTC view, click the Alarms tab to display the alarms for that card, node, or network. The Alarms window shows alarms in compliance with Telcordia GR-253-CORE. This means that if a network problem causes two alarms, such as loss of frame (LOF) and loss of signal (LOS), CTC only shows the LOS alarm in this window because it supersedes the LOF and replaces it.
The Path Width column in the Alarms and Conditions tabs expands on the alarmed object information contained in the access identifier (AID) string (such as "STS-4-1-3") by giving the number of STSs contained in the alarmed path. For example, the Path Width tells you whether a critical alarm applies to an STS1 or an STS48c. The column reports the width as a 1, 3, 6, 12, 48, etc. as appropriate, understood to be "STS-N."
Table 16-1 lists the column headings and the information recorded in each column.
Table 16-2 lists the color codes for alarm and condition severities.
16.3.1 Viewing Alarms by Time Zone
By default, alarms and conditions are displayed with the time stamp of the CTC workstation where you are viewing them. However, you can set the node to report alarms (and conditions) using the time zone where the node is located.
16.3.2 Controlling Alarm Display
You can control the display of the alarms shown on the Alarms window. Table 16-3 shows the actions you can perform in the Alarms window.
16.3.3 Filtering Alarms
The alarm display can be filtered to prevent display of alarms with certain severities or alarms that occurred between certain dates and times. You can set the filtering parameters by clicking the Filter button at the bottom-left of the Alarms window. You can turn the filter on or off by clicking the Filter tool at the bottom-right of the window. CTC retains your filter activation setting. For example, if you turn the filter on and then log out, CTC keeps the filter active the next time you log in.
16.3.4 Conditions Tab
The Conditions window displays retrieved fault conditions. A condition is a fault or status detected by ONS 15454 hardware or software. When a condition occurs and continues for a minimum period, CTC raises a condition, which is a flag showing that this particular condition currently exists on the ONS 15454.
The Conditions window shows all conditions that occur, including those that are superseded. For instance, if a network problem causes two alarms, such as LOF and LOS, CTC shows both the LOF and LOS conditions in this window (even though LOS supersedes LOF). Having all conditions visible can be helpful when troubleshooting the ONS 15454. If you want to retrieve conditions that obey a root-cause hierarchy (that is, LOS supersedes and replaces LOF), you can exclude the same root causes by checking the "Exclude Same Root Cause" check box in the window.
Fault conditions include reported alarms and Not Reported or Not Alarmed conditions. Refer to the trouble notifications information in the Cisco ONS 15454 DWDM Troubleshooting Guide for more information about alarm and condition classifications.
16.3.5 Controlling the Conditions Display
You can control the display of the conditions on the Conditions window. Table 16-4 shows the actions you can perform in the window.
16.3.5.1 Retrieving and Displaying Conditions
The current set of all existing conditions maintained by the alarm manager can be seen when you click the Retrieve button. The set of conditions retrieved is relative to the CTC view. For example, if you click the button while displaying the node view (single-shelf mode) or shelf view (multishelf mode), node-specific conditions appear. If you click the button while displaying the network view, all conditions for the network (including ONS 15454 nodes and other connected nodes) appear, and the card view shows only card-specific conditions.
You can also set a node to display conditions using the time zone where the node is located, rather than the time zone of the PC where they are being viewed.
16.3.5.2 Conditions Column Descriptions
Table 16-5 lists the Conditions window column headings and the information recorded in each column.
Table 16-5 Conditions Column Description
Date
Date and time of the condition.
Node
Shows the name of the node where the condition or alarm occurred. (Visible in network view.)
Object
TL1 AID for the condition object. For an STSmon or VTmon, the object.
Eqpt Type
Card type in this slot.
Slot
Slot where the condition occurred (appears only in network and node view).
Port
Port where the condition occurred. For STSTerm and VTTerm, the port refers to the upstream card it is partnered with.
Path Width
Width of the data path.
Sev1
Severity level: CR (Critical), MJ (Major), MN (Minor), NA (Not Alarmed), NR (Not Reported).
SA 1
Indicates a service-affecting alarm (when checked).
Cond
The error message/alarm name; these names are alphabetically defined in the Cisco ONS 15454 DWDM Troubleshooting Guide.
Description
Description of the condition.
1 All alarms, their severities, and service-affecting statuses are also displayed in the Condition tab unless you choose to filter the alarm from the display using the Filter button.
16.3.5.3 Filtering Conditions
The condition display can be filtered to prevent display of conditions (including alarms) with certain severities or that occurred between certain dates. You can set the filtering parameters by clicking the Filter button at the bottom-left of the Conditions window. You can turn the filter on or off by clicking the Filter tool at the bottom-right of the window. CTC retains your filter activation setting. For example, if you turn the filter on and then log out, CTC keeps the filter active the next time your user ID is activated.
16.3.6 Viewing History
The History window displays historic alarm or condition data for the node or for your login session. You can chose to display only alarm history, only events, or both by checking check boxes in the History > Shelf window. You can view network-level alarm and condition history, such as for circuits, for all the nodes visible in network view. At the node level, you can see all port (facility), card, STS, and system-level history entries for that node. For example, protection-switching events or performance-monitoring threshold crossings appear here. If you double-click a card, you can view all port, card, and STS alarm or condition history that directly affects the card.
Note
Different views of CTC display different kinds of history:
•
•
•
Tip
If you check the History window Alarms check box, you display the node history of alarms. If you check the Events check box, you display the node history of Not Alarmed and transient events (conditions). If you check both check boxes, you retrieve node history for both.
16.3.6.1 History Column Descriptions
Table 16-6 lists the History window column headings and the information recorded in each column.
16.3.6.2 Retrieving and Displaying Alarm and Condition History
You can retrieve and view the history of alarms and conditions, including transient conditions (passing notifications of processes as they occur) in the CTC History window. The information in this window is specific to the view where it is shown (that is, network history in the network view, node history in the node view (single-shelf mode) or shelf view (multishelf mode), and card history in the card view).
The node and card history views are each divided into two tabs. In node view (single-shelf mode) or shelf view (multishelf mode), when you click the Retrieve button, you can see the history of alarms, conditions, and transients that have occurred on the node in the History > Node window, and the history of alarms, conditions, and transients that have occurred on the node during your login session in the History > Session window. In the card-view history window, after you retrieve the card history, you can see the history of alarms, conditions, and transients on the card in the History > Card window, or a history of alarms, conditions, and transients that have occurred during your login session in the History > Session window. You can also filter the severities and occurrence period in these history windows.
16.3.7 Alarm History and Log Buffer Capacities
The ONS 15454 alarm history log, stored in the TCC2/TCC2P RSA memory, contains four categories of alarms. These include:
•
•
•
•
Each category can store between 4 and 640 alarm chunks, or entries. In each category, when the upper limit is reached, the oldest entry in the category is deleted. The capacity is not user-provisionable.
CTC also has a log buffer, separate from the alarm history log, that pertains to the total number of entries displayed in the Alarms, Conditions, and History windows. The total capacity is provisionable up to 5,000 entries. When the upper limit is reached, the oldest entries are deleted.
16.4 Alarm Severities
ONS 15454 alarm severities follow the Telcordia GR-474-CORE standard, so a condition might be Alarmed (at a severity of Critical [CR], Major [MJ], or Minor [MN]), Not Alarmed (NA), or Not Reported (NR). These severities are reported in the CTC software Alarms, Conditions, and History windows at all levels: network, shelf, and card.
ONS equipment provides a standard profile named Default listing all alarms and conditions with severity settings based on Telcordia GR-474-CORE and other standards, but users can create their own profiles with different settings for some or all conditions and apply these wherever desired. (See the "Alarm Profiles" section.) For example, in a custom alarm profile, the default severity of a carrier loss (CARLOSS) alarm on an Ethernet port could be changed from major to critical. The profile allows setting to Not Reported or Not Alarmed, as well as the three alarmed severities.
Critical and Major severities are only used for service-affecting alarms. If a condition is set as Critical or Major by profile, it will raise as Minor alarm in the following situations:
•
•
Because of this possibility of being raised at two different levels, the alarm profile pane shows Critical as CR / MN and Major as MJ / MN.
16.5 Alarm Profiles
The alarm profiles feature allows you to change default alarm severities by creating unique alarm profiles for individual ONS 15454 ports, cards, or nodes. A created alarm profile can be applied to any node on the network. Alarm profiles can be saved to a file and imported elsewhere in the network, but the profile must be stored locally on a node before it can be applied to the node, its cards, or its cards' ports.
CTC can store up to ten active alarm profiles at any time to apply to the node. Custom profiles can take eight of these active profile positions. Two other profiles, Default profile and Inherited profile, are reserved by the NE, and cannot be edited.The reserved Default profile contains Telcordia GR-474-CORE severities. The reserved Inherited profile allows port alarm severities to be governed by the card-level severities, or card alarm severities to be determined by the node-level severities.
If one or more alarm profiles have been stored as files from elsewhere in the network onto the local PC or server hard drive where CTC resides, you can utilize as many profiles as you can physically store by deleting and replacing them locally in CTC so that only eight are active at any given time.
16.5.1 Creating and Modifying Alarm Profiles
Alarm profiles are created in the network view using the node view (single-shelf mode) or shelf view (multishelf mode) Provisioning > Alarm Profiles tabs. Figure 16-2 shows the default list of alarm severities. A default alarm severity following Telcordia GR-474-CORE standards is preprovisioned for every alarm. After loading the default profile or another profile on the node, you can clone a profile to create custom profiles. After the new profile is created, the Alarm Profiles window shows the original profile (frequently Default) and the new profile.
Figure 16-2 Network View Alarm Profiles Window
Note
Note
Note
Tip
Note
Wherever it is applied, the Default alarm profile sets severities to standard Telcordia GR-474-CORE settings. In the Inherited profile, alarms inherit, or copy, severity from the next-highest level. For example, a card with an Inherited alarm profile copies the severities used by the node housing the card. If you choose the Inherited profile from the network view, the severities at the lower levels (node and card) are copied from this selection.
You do not have to apply a single severity profile to the node-, card-, and port-level alarms. Different profiles can be applied at different levels. You could use the inherited or default profile on a node and on all cards and ports, but apply a custom profile that downgrades an alarm on one particular card. For example, you might choose to downgrade an OC-N unequipped path alarm (UNEQ-P) from Critical (CR) to Not Alarmed (NA) on an optical card because this alarm raises and then clears every time you create a circuit. UNEQ-P alarms for the card with the custom profile would not display on the Alarms tab (but they would still be recorded on the Conditions and History tabs.)
When you modify severities in an alarm profile:
•
•
The Load and Store buttons are not available for Retrieve and Maintenance users.
The Delete and Store options will only display nodes to delete profiles from or store profiles to if the user has provisioning permission for those nodes. If the user does not have the proper permissions, CTC greys out the buttons and they are not available to the user.
16.5.2 Alarm Profile Buttons
The Alarm Profiles window displays six buttons at the bottom of the screen. Table 16-7 lists and describes each of the alarm profile buttons and their functions.
16.5.3 Alarm Profile Editing
Table 16-8 lists and describes the five profile-editing options available when you right-click an alarm item in the profile column (such as Default).
16.5.4 Alarm Severity Options
To change or assign alarm severity, left-click the alarm severity you want to change in the alarm profile column. Seven severity levels appear for the alarm:
•
•
•
•
•
•
•
Inherited and Use Default severity levels only appear in alarm profiles. They do not appear when you view alarms, history, or conditions.
16.5.5 Row Display Options
In the network or node view (single-shelf mode) or shelf view (multishelf mode), the Alarm Profiles window (Alarm Profile Editor for node view) displays three check boxes at the bottom of the window:
•
•
•
16.5.6 Applying Alarm Profiles
In CTC node view (single-shelf mode) or shelf view (multishelf mode), the Alarm Behavior window displays alarm profiles for the node. In card view, the Alarm Behavior window displays the alarm profiles for the selected card. Alarm profiles form a hierarchy. A node-level alarm profile applies to all cards in the node except cards that have their own profiles. A card-level alarm profile applies to all ports on the card except ports that have their own profiles.
At the node level, you can apply profile changes on a card-by-card basis or set a profile for the entire node. At the card-level view, you can apply profile changes on a port-by-port basis or set alarm profiles for all ports on that card. Figure 16-3 shows alarm profiles for an OPT-BST card.
Figure 16-3 OPT-BST Card Alarm Profiles
16.6 External Alarms and Controls
External alarm inputs can be provisioned on the Alarm Interface Controller-International (AIC-I) card for external sensors such as an open door and flood sensors, temperature sensors, and other environmental conditions. External control outputs on these two cards allow you to drive external visual or audible devices such as bells and lights. They can control other devices such as generators, heaters, and fans.
Up to 12 external alarm inputs and four external controls are available with the AIC-I card. If you also provision the alarm extension panel (AEP), there are 32 inputs and 16 outputs. The AEP is compatible with the ONS 15454 ANSI shelf only. It is not compatible with the ONS 15454 ETSI shelf.
16.6.1 External Alarms
You can provision each alarm input separately. Provisionable characteristics of external alarm inputs include:
•
•
•
•
•
Note
Note
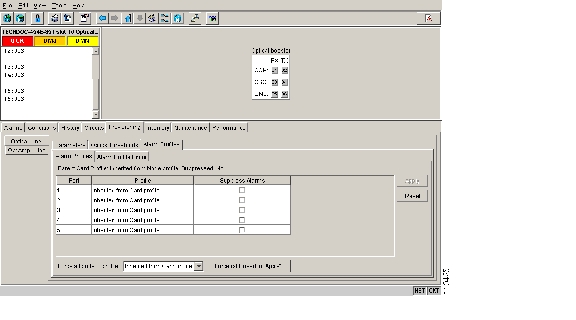
16.6.2 External Controls
You can provision each alarm output separately. Provisionable characteristics of alarm outputs include:
•
•
•
•
–
–
–
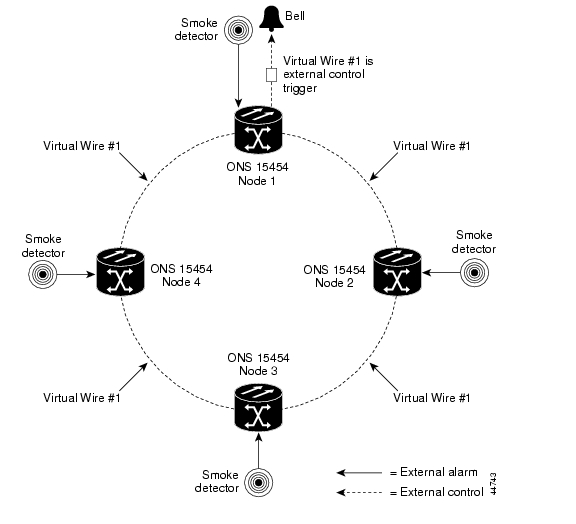
16.6.3 Virtual Wires
Provisioning the AIC and AIC-I card provides a "virtual wires" option used to route external alarms and controls from different nodes to one or more alarm collection centers. In Figure 16-4, smoke detectors at Nodes 1, 2, 3, and 4 are assigned to Virtual Wire #1, and Virtual Wire #1 is provisioned as the trigger for an external bell at Node 1.
Figure 16-4 External Alarms and Controls Using a Virtual Wire
When using AIC virtual wires, you can:
•
•
16.7 Alarm Suppression
The following sections explain alarm suppression features for the ONS 15454.
16.7.1 Alarms Suppressed for Maintenance
When you place a port in OOS,MT administrative state, this raises the alarm suppressed for maintenance (AS-MT) alarm in the Conditions and History windows1 and causes subsequently raised alarms for that port to be suppressed.
While the facility is in the OOS,MT state, any alarms or conditions that are raised and suppressed on it (for example, a transmit failure [TRMT] alarm) are reported in the Conditions window and show their normal severity in the Sev column. The suppressed alarms are not shown in the Alarms and History windows. (These windows only show AS-MT). When you place the port back into IS,AINS administrative state, the AS-MT alarm is resolved in all three windows. Suppressed alarms remain raised in the Conditions window until they are cleared.
16.7.2 Alarms Suppressed by User Command
In the node view (single-shelf mode) or shelf view (multishelf mode) Provisioning > Alarm Profiles tabs > Alarm Behavior tabs, the ONS 15454 has an alarm suppression option that clears raised alarm messages for the node, chassis, one or more slots (cards), or one or more ports. Using this option raises the alarms suppressed by user command, or AS-CMD alarm. The AS-CMD alarm, like the AS-MT alarm, appears in the Conditions, and History 1 windows. Suppressed conditions (including alarms) appear only in the Conditions window--showing their normal severity in the Sev column. When the Suppress Alarms check box is unchecked, the AS-CMD alarm is cleared from all three windows.
A suppression command applied at a higher level does not supersede a command applied at a lower level. For example, applying a node-level alarm suppression command makes all raised alarms for the node appear to be cleared, but it does not cancel out card-level or port-level suppression. Each of these conditions can exist independently and must be cleared independently.
Caution
16.8 Multishelf Configuration Alarming
Multishelf systems can share a single IP address among shelves and also correlate optical signal alarms. Ethernet alarm-raising for this configuration also differs from alarm-raising for single-shelf configurations. This section explains how alarms are viewed on a multishelf configuration, how alarm locations are determined, and how multishelf alarming differs from single-shelf alarming.
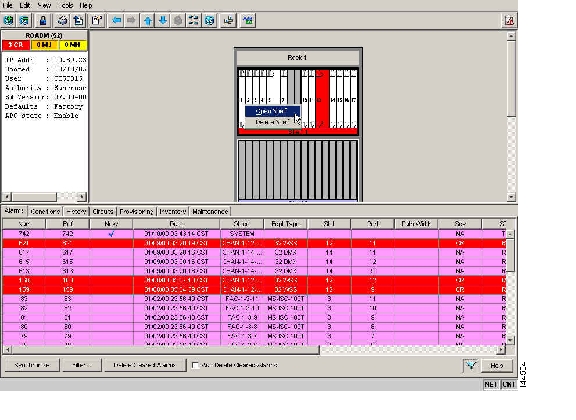
16.8.1 Viewing Multishelf Alarmed Entities
The multishelf view in CTC shows which slots are occupied in each shelf of the configuration ( Figure 16-5).
Figure 16-5 Navigating to Shelf View from Multishelf View
You can determine where an alarm is raised by viewing the Object column. The entry there (for example, FAC-1-3-1) tells you the entity ("fac," or facility), shelf, slot, and port. In shelf view, the Alarms and Conditions tabs also contain a Shelf column that indicates where the alarmed card is located.
16.8.2 Multishelf-Specific Alarming
The following sections explain how Ethernet communication alarms and correlated multishelf alarms are processed in the ONS 15454 DWDM system.
16.8.2.1 Ethernet Communication Alarms
The Ethernet interface card (MS-ISC) that is required for multishelf configurations does not raise traditional Ethernet alarms, such as CARLOSS, that apply to transponder (TXP) or muxponder (MXP) client ports. Instead, MS-ISC card alarms are raised on the shelf as EQPT alarms. These alarms include Duplicate Shelf ID (DUP-SHELF-ID) and Shelf Communication Failure (SHELF-COMM-FAIL).
16.8.2.2 Multishelf Correlated Alarms
ITU-T G.798-based alarm correlation simplifies alarm reporting for DWDM channels. Communication failures including Loss of Signal (LOS), Loss of Signal Payload (LOS-P), and Optical Power Receive Fail-Loss of Light (OPWR-LFAIL) generate multiple conditions at each affected node and channel. Correlation simplifies troubleshooting because a single alarm is reported for each root cause. (The original alarms retain their severity in the Conditions window.)
The Payload Missing Indication (PMI) condition is raised at the far end to correlate optical multiplex section (OMS) and optical transmission section (OTS) communication failures. A single PMI condition is sent when every channel on the aggregated port is lost, that is, when there are no pass-through channels or active added channels in service. If there are added channels on the node, the Forward Defect Indication (FDI) condition is raised at the near end to indicate there are no pass-through optical channels (OCH) in service.
16.9 Threshold Crossing Alert Suppression
This section describes threshold crosssing alert (TCA) suppression on TXP and MXP cards when they are installed in a DWDM node.
16.9.1 Overview
Threshold default settings define the default cumulative values (thresholds) beyond which a TCA will be raised. TCAs make it possible to monitor the network and detect errors early.
The following thresholds are monitored for TXP and MXP cards:
•
•
•
•
Threshold defaults are defined for near end and/or far end and at 15-minute or one-day intervals.
When LOS-P, LOS, or LOF alarms occur on the TXP./MXP cards, different TCAs are suppressed. Which TCAs are suppressed by an alarm depends on how the trunk is configured (ITU-T G.709, SONET, or SDH). The reason for suppressing the TCAs after the alarm occurs is to prevent a flood of TCAs after a system failure.
TCA suppression does not extend to optical thresholds such as OPR (optical power received). Optical threshold TCAs can effectively be suppressed by setting their thresholds to the maximum value.TCA suppression also does not extend to client ports; it only applies to TXP and MXP trunk ports when they are configured as ITU-T G.709, SONET, or SDH. TCA suppression does not extend to 10GE payloads.
Note
16.9.2 G.709, SONET, and SDH TCA Groups
This section lists the TCAs that are suppressed for each alarm. TCA suppression is determined by how framing is configured for TXP and MXP trunks.
Table 16-9 lists the TCAs for each type of trunk framing and alarm.
1 AS-MT can be seen in the Alarms window as well if you have set the Filter dialog box to show NA severity events.
![]()
![]()
![]()
![]()
![]()
![]()
![]()
![]()
Posted: Mon Oct 22 05:33:22 PDT 2007
All contents are Copyright © 1992--2007 Cisco Systems, Inc. All rights reserved.
Important Notices and Privacy Statement.