|
|

Table Of Contents
18.3.1 Optical Performance for Rings and Linear Networks with OADM Nodes
18.3.2 Optical Performance for Linear Networks Without OADM Nodes
18.3.3 Optical Performance for ROADM Rings and Linear Networks
18.3.4 Optical Performance for Single-Span Networks
18.4.1 APC at the Amplifier Card Level
18.4.2 APC at the Node and Network Levels
18.5 ROADM Power Equalization Monitoring
18.7 Network Optical Safety--Automatic Laser Shutdown
18.7.1 Scenario 1: Fiber Cut in Nodes Using OPT-BST/OPT-BST-E Cards
18.7.2 Scenario 2: Fiber Cut in Nodes Using OSC-CSM Cards
18.8 Network-Level Gain—Tilt Management of Optical Amplifiers
18.8.1 Gain Tilt Control at the Card Level
18.8.2 System Level Gain Tilt Control
Network Reference
This chapter explains the ONS 15454 dense wavelength division multiplexing (DWDM) network applications and topologies. The chapter also provides network-level optical performance references.
Note
Unless otherwise specified, "ONS 15454" refers to both ANSI and ETSI shelf assemblies.
Chapter topics include:
•
•
•
18.1 Network Applications
Cisco ONS 15454s can be provisioned for metro access and metro core DWDM network applications. Metro access networks are 60 km or less in size. Channels are not equalized and dispersion compensation is not applied. Metro access networks have few spans and very low span loss, so the signal link budget is the limiting factor for performance. Metro core networks can be up to 400 km in size. The channel power is equalized and dispersion compensation is applied. Metro core networks often include multiple spans and amplifiers, so the optical signal-to-noise ratio (OSNR) is the limiting factor for channel performance in metro core networks.
Within DWDM networks, the ONS 15454 uses a communications protocol, called node services protocol (NSP), to communicate with other nodes. NSP automatically updates nodes whenever a change in the network occurs. Each ONS 15454 DWDM node can:
•
•
•
18.2 Network Topologies
The ONS 15454 DWDM network topologies include hubbed, multihubbed, and meshed rings, and linear and single-span networks.
18.2.1 Hubbed Rings
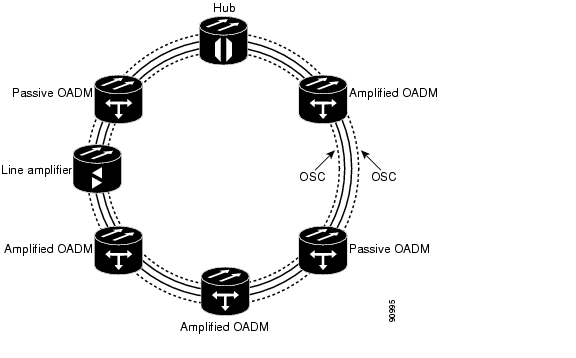
In the hubbed ring topology ( Figure 18-1), a hub node terminates all the DWDM channels. A channel can be provisioned to support protected traffic between the hub node and any node in the ring. Both working and protected traffic use the same wavelength on both sides of the ring. Protected traffic can also be provisioned between any pair of optical add/drop multiplexing (OADM) nodes, except that either the working or the protected path must be regenerated in the hub node.
Protected traffic saturates a channel in a hubbed ring, that is, no channel reuse is possible. However, the same channel can be reused in different sections of the ring by provisioning unprotected multihop traffic. From a transmission point of view, this network topology is similar to two bidirectional point-to-point links with OADM nodes.
For more information about hub nodes, see the "17.1.1 Hub Node" section on page 17-1.
Figure 18-1 Hubbed Ring
18.2.2 Multihubbed Rings
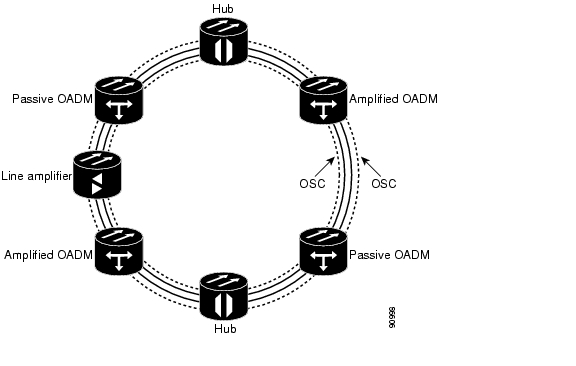
A multihubbed ring ( Figure 18-2) is based on the hubbed ring topology, except that two or more hub nodes are added. Protected traffic can only be established between the two hub nodes. Protected traffic can be provisioned between a hub node and any OADM node only if the allocated wavelength channel is regenerated through the other hub node. Multihop traffic can be provisioned on this ring. From a transmission point of view, this network topology is similar to two or more point-to-point links with OADM nodes.
Figure 18-2 Multihubbed Ring
18.2.3 Any-to-Any Rings
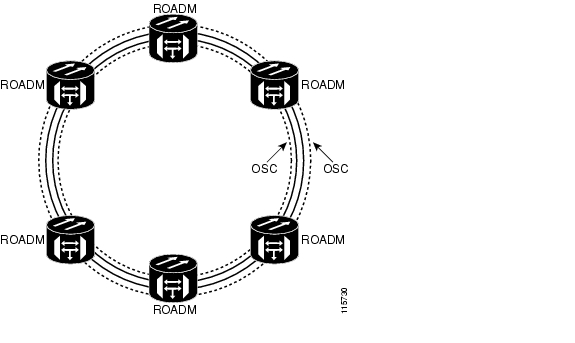
The any-to-any ring topology ( Figure 18-3) contains only reconfigurable OADM (ROADM) nodes, or ROADM nodes with Optical Service Channel (OSC) regeneration or amplifier nodes. This topology potentially allows you to route every wavelength from any source to any destination node inside the network.
See the "17.1.4 ROADM Node" section on page 17-8 for more information.
Figure 18-3 Any-to-Any Ring
18.2.4 Meshed Rings
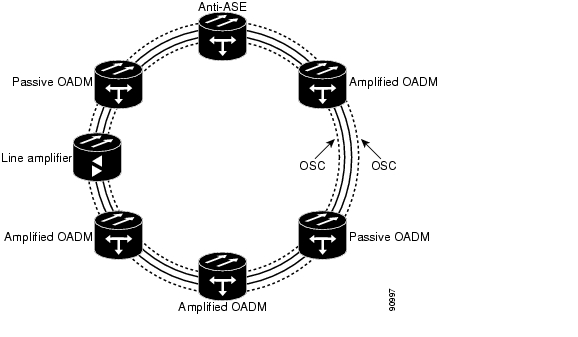
The meshed ring topology ( Figure 18-4) does not use hubbed nodes; only amplified and passive OADM nodes are present. Protected traffic can be provisioned between any two nodes; however, the selected channel cannot be reused in the ring. Unprotected multihop traffic can be provisioned in the ring. A meshed ring must be designed to prevent amplified spontaneous emission (ASE) lasing. This is done by configuring a particular node as an anti-ASE node. An anti-ASE node can be created in two ways:
•
•
For more information about OADM nodes, see the "17.1.3 OADM Node" section on page 17-4. For more information about anti-ASE nodes, see the "17.1.5 Anti-ASE Node" section on page 17-10.
Figure 18-4 Meshed Ring
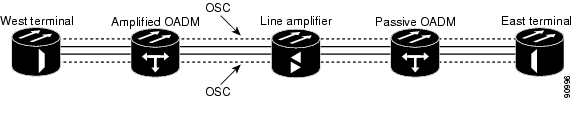
18.2.5 Linear Configurations
Linear configurations are characterized by the use of two terminal nodes (west and east). The terminal nodes can be equipped with a 32MUX-O card and a 32DMX-O card, or a 32WSS card with a 32DMX or 32DMX-O card. OADM or line amplifier nodes can be installed between the two terminal nodes. Only unprotected traffic can be provisioned in a linear configuration. Figure 18-5 shows five ONS 15454 nodes in a linear configuration with an amplified and a passive OADM node.
Figure 18-5 Linear Configuration with an OADM Node
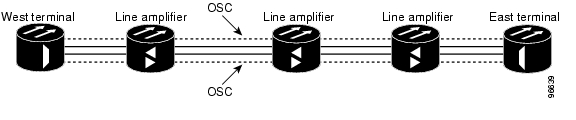
Figure 18-6 shows five ONS 15454 nodes in a linear configuration without an OADM node.
See the "17.1.2 Terminal Node" section on page 17-3 for more information.
Figure 18-6 Linear Configuration without an OADM Node
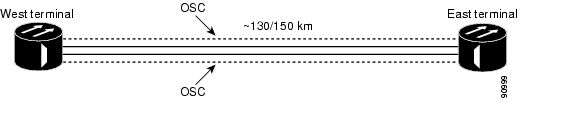
18.2.6 Single-Span Link
Single-span link is a type of linear configuration characterized by a single-span link with pre-amplification and post-amplification. A single-span link is also characterized by the use of two terminal nodes (west and east). The terminal nodes are usually equipped with a 32MUX-O card and a 32DMX-O card. However, a 32WSS card and a 32DMX or a 32DMX-O card can be installed. Software R4.7 and later also supports single-span links with AD-4C-xx.x cards. Only unprotected traffic can be provisioned on a single-span link.
Figure 18-7 shows ONS 15454s in a single-span link. Eight channels are carried on one span. Single-span link losses apply to OC-192 LR ITU cards. The optical performance values are valid assuming that the sum of the OADM passive node insertion losses and the span losses does not exceed 35 dB.
Figure 18-7 Single-Span Link
18.3 Optical Performance
This section provides optical performance information for ONS 15454 DWDM networks. The performance data is a general guideline based upon the network topology, node type, client cards, fiber type, number of spans, and number of channels. The maximum number of nodes that can be in an ONS 15454 DWDM network is 16. The DWDM topologies and node types that are supported are shown in Table 18-1.
Table 18-1 Supported Topologies and Node Types
32 channels
SMF-281
E-LEAF2
TW-RS3
Ring
Linear
Linear without OADM
Hub
Active OADM
Passive OADM
Terminal
Line
OSC regeneration
16 channels
SMF-28
Ring
Linear
Linear without OADM
Hub
Active OADM
Passive OADM
Terminal
Line
OSC regeneration
8 channels
SMF-28
Linear without OADM
Terminal
Line
1 SMF-28 = single-mode fiber 28
2 E-LEAF = enhanced large effective area fiber
3 TW-RS = TrueWave reduced slope fiber
DWDM client cards are grouped into nine classes, shown in Table 18-2. Span loss estimates are based on the number of spans in the network and the client card class. Some cards belong to more than one class depending on whether forward error correction (FEC) is enabled and on the payload data type provisioned for the card.
Table 18-2 ONS 15454 Client Card Classes
A
10 Gbps
TXP_2.5G_10G—FEC enabled
TXP_2.5G_10E—FEC enabled
TXP_MR_10G—FEC enabled
TXP_MR_10E—FEC enabled
B
10 Gbps
TXP_2.5G_10G—FEC not enabled
TXP_MR_10G—FEC not enabled
C
10 Gbps
OC-192 LR ITU
TXP_2.5G_10E—FEC not enabled
D
2.5 Gbps
TXP_MR_2.5G—FEC enabled
TXPP_MR_2.5G—FEC enabled
E
2.5 Gbps
TXP_MR_2.5G—3R payload data type; FEC disabled
TXPP_MR_2.5G—3R payload data type; FEC disabled
MXP_MR_2.5G
MXPP_MR_2.5G
F
2.5 Gbps
TXP_MR_2.5G—2R payload data type
TXPP_MR_2.5G—2R payload data type
G
2.5 Gbps
OC-48 ELR ITU
H
2.5 Gbps
2/4 port Gigabit Ethernet Transponder (GBIC WDM 100 GHz)
I
10 Gbps
TXP_2.5G_10E—E-FEC1 enabled
TXP_MR_10E—E-FEC enabled
1 Forward error correction
18.3.1 Optical Performance for Rings and Linear Networks with OADM Nodes
The following tables provide optical performance estimates for open and closed ONS 15454 rings and linear networks with OADM nodes.
Table 18-3 shows the optical performance for 32-channel networks using SMF fiber. Span losses shown in the table assume:
•
•
•
•
See Table 18-2 for a list of cards in each class. A dash (—) indicates spans that are not supported.
Table 18-3 Span Loss for 32-Channel Ring and Linear Networks with OADM Nodes Using SMF Fiber
1
35 dB
25 dB
25 dB
37 dB
37 dB
33 dB
30 dB
32 dB
34 dB
30 dB
2
29 dB
21 dB
20 dB
30 dB
31 dB
27 dB
25 dB
26 dB
28 dB
25 dB
3
26 dB
17 dB
15 dB
28 dB
29 dB
25 dB
23 dB
24 dB
26 dB
23 dB
4
24 dB
—
—
25 dB
26 dB
23 dB
20 dB
22 dB
24 dB
20 dB
5
23 dB
—
—
24 dB
25 dB
22 dB
16 dB
20 dB
23 dB
16 dB
6
21 dB
—
—
23 dB
24 dB
19 dB
—
17 dB
21 dB
—
7
201 dB
—
—
22 dB
23 dB
16 dB
—
—
19 dB
—
1 0.5 dB of OSNR impairment recovered by FEC margin @ BER > 10-6
Table 18-4 shows the optical performance for 16-channel networks using SMF fiber. Span loss values assume the following:
•
•
•
•
See Table 18-2 for a list of cards in each class. A dash (—) indicates the spans that are not supported.
Table 18-5 shows the optical performance for 32-channel networks using TW-RS fiber. Span loss values assume the following:
•
•
•
•
See Table 18-2 for a list of cards in each class. A dash (—) indicates the spans that are not supported.
Table 18-6 shows the optical performance for 32-channel networks using E-LEAF fiber. Span loss values assume the following:
•
•
•
•
See Table 18-2 for a list of cards in each class. A dash (—) indicates the spans that are not supported.
18.3.2 Optical Performance for Linear Networks Without OADM Nodes
The following tables list the reference optical performances for linear networks without OADM nodes. Table 18-7 shows the optical performance for 32-channel linear networks using SMF fiber. Span loss values assume the following:
•
•
•
See Table 18-2 for a list of cards in each class. A dash (—) indicates the spans that are not supported.
Table 18-8 shows the optical performance for 32-channel linear networks using TW-RS fiber. Span loss values assume the following:
•
•
•
See Table 18-2 for a list of cards in each class. A dash (—) indicates the spans that are not supported.
Table 18-9 shows the optical performance for 32-channel linear networks using E-LEAF fiber. Span loss values assume the following:
•
•
•
See Table 18-2 for a list of cards in each class. A dash (—) indicates the spans that are not supported.
Table 18-10 shows the optical performance for 16-channel linear networks using SMF fiber. Span loss values assume the following:
•
•
•
•
•
See Table 18-2 for a list of cards in each class.
Table 18-11 shows the optical performance for 8-channel linear networks with 8 dBm per channel using SMF fiber. Span loss values assume the following:
•
•
•
See Table 18-2 for a list of cards in each class. A dash (—) indicates the spans that are not supported.
18.3.3 Optical Performance for ROADM Rings and Linear Networks
The following tables list the reference optical performances for ROADM rings and linear networks. Table 18-12 shows the optical performance for 32-channel linear or ring networks using SMF fiber with only ROADM nodes installed. Span loss values assume the following:
•
•
•
See Table 18-2 for a list of cards in each class. A dash (—) indicates the spans that are not supported.
Table 18-12 Span Loss for 32-Channel Linear or Ring Networks with all ROADM Nodes Using SMF Fiber
1
35 dB
25 dB
25 dB
36 dB
37 dB
33 dB
30 dB
32 dB
34 dB
—
2
30 dB
21 dB
20 dB
32 dB
34 dB
28 dB
25 dB
26 dB
29 dB
—
3
28 dB
18 dB
17 dB
30 dB
32 dB
26 dB
23 dB
24 dB
27 dB
—
4
26 dB
—
—
28 dB
30 dB
24 dB
21 dB
22 dB
25 dB
—
5
25 dB
—
—
27 dB
29 dB
23 dB
20 dB
20 dB
23 dB
—
6
24 dB
—
—
26 dB
28 dB
22 dB
18 dB
19 dB
22 dB
—
7
23 dB
—
—
25 dB
27 dB
21 dB
14 dB
17 dB
20 dB
—
8
22 dB
—
—
24 dB
26 dB
20 dB
—
—
18 dB
—
9
21 dB
—
—
23 dB
25 dB
19 dB
—
—
—
—
10
21 dB
—
—
23 dB
25 dB
18 dB
—
—
—
—
11
181 dB
—
—
22 dB
24 dB
17 dB
—
—
—
—
12
171
—
—
21 dB
24 dB
15 dB
—
—
—
—
13
151
—
—
21 dB
23 dB
—
—
—
—
—
14
—
—
—
20 dB
23 dB
—
—
—
—
—
15
—
—
—
20 dB
22 dB
—
—
—
—
—
1 If the number of boosters is greater than 10 and power per channel is = to +1 dBm.
Table 18-13 shows the optical performance for 32-channel linear or ring network with ROADM and OADM nodes using SMF fiber. Span loss values assume the following:
•
•
•
See Table 18-2 for a list of cards in each class. A dash (—) indicates the spans that are not supported.
Table 18-13 Span Loss for 32-Channel Ring and Linear Networks with ROADM and OADM Nodes Using SMF Fiber
1
30 dB
23 dB
24 dB
31 dB
34 dB
31 dB
28 dB
29 dB
30 dB
28 dB
2
26 dB
19 dB
19 dB
27 dB
27 dB
26 dB
23 dB
26 dB
27 dB
23 dB
3
23 dB
—
—
25 dB
26 dB
23 dB
21 dB
23 dB
24 dB
21 dB
4
21 dB
—
—
23 dB
24 dB
22 dB
18 dB
21 dB
22 dB
18 dB
5
20 dB
—
—
22 dB
23 dB
20 dB
13 dB
20 dB
21 dB
13 dB
6
17 dB
—
—
19 dB
22 dB
18 dB
—
17 dB
18 dB
—
7
151 dB
—
—
17 dB
21 dB
16 dB
—
151
16 dB
—
1 0.5 dB of OSNR impairment recovered by FEC margin @ BER>10-6
The following tables show the pass/fail criteria for eight and sixteen ROADM nodes. Table 18-14 shows the pass/fail criteria for eight ROADM nodes (seven spans) required for any-to-any node circuit reconfigurations:
•
•
See Table 18-2 for a list of cards in each class. A dash (—) indicates the spans that are not supported.
Table 18-15 shows the pass/fail criteria for 16 ROADM nodes (15 spans) required for any-to-any node circuit reconfigurations.
•
•
See Table 18-2 for a list of cards in each class. A dash (—) indicates the spans that are not supported.
Table 18-15 Pass/Fail Criteria for 32-Channel, 16-Node ROADM Rings Using SMF Fiber
1
OPT-PRE only
<151
<151
<151
Yes
Yes
<151
<151
<151
<151
—
2
OPT-PRE only
<151
<151
<151
Yes
Yes
<151
<151
<151
<151
—
3
OPT-PRE only
<151
<151
<151
Yes
Yes
<151
<151
<151
<151
—
4
OPT-PRE only
<151
<151
<151
Yes
Yes
<151
<151
<151
<151
—
5
OPT-PRE only
<151
<151
<151
Yes
Yes
<151
<151
<151
<151
—
6
OPT-PRE only
<151
<151
<151
Yes
Yes
<151
<151
<151
<151
—
7
OPT-PRE and OPT-BST/
OPT-BST-E<151
<151
<151
Yes
Yes
<151
<151
<151
<151
—
8
OPT-PRE and OPT-BST/
OPT-BST-E<151
<151
<151
Yes
Yes
<151
<151
<151
<151
—
9
OPT-PRE and OPT-BST/
OPT-BST-E<151
<151
<151
Yes
Yes
<151
<151
<151
<151
—
10
OPT-PRE and OPT-BST/
OPT-BST-E<151
<151
<151
Yes
Yes
<151
<151
<151
<151
—
11
OPT-PRE and OPT-BST/
OPT-BST-E<151
<151
<151
Yes
Yes
<151
<151
<151
<151
—
12
OPT-PRE and OPT-BST/
OPT-BST-E<151
<151
<151
Yes
Yes
<151
<151
<151
<151
—
13
OPT-PRE and OPT-BST/
OPT-BST-E<151
<151
<151
Yes
Yes
<151
<151
<151
<151
—
14
OPT-PRE and OPT-BST/
OPT-BST-E<151
<151
<151
Yes
Yes
<151
<151
<151
<151
—
15
OPT-PRE and OPT-BST/
OPT-BST-E<151
<151
<151
Yes
Yes
<151
<151
<151
<151
—
1 Cisco MetroPlanner calculates the maximum ring circumference and number of nodes that can be supported.
18.3.4 Optical Performance for Single-Span Networks
Table 18-16 lists the span loss for a single-span link configuration with eight channels. The optical performance for this special configuration is given only for Classes A and C. This configuration assumes a maximum channel capacity of eight channels (8-dBm nominal channel power) used without any restrictions on the 32 available channels.
Table 18-17 lists the span loss for a single-span link configuration with 16 channels. The optical performance for this special configuration is given only for Class A and Class C. This configuration assumes a maximum channel capacity of 16 channels (5-dBm nominal channel power) used without any restrictions on the 32 available channels.
Table 18-18 lists the span loss for a single-span link configuration with AD-1C-x.xx cards, OPT-PRE amplifiers, and OPT-BST/OPT-BST-E amplifiers. The single-span link with a flexible channel count is used both for transmitting and receiving. If dispersion compensation is required, a DCU can be used with an OPT-PRE amplifier. The optical performance for this special configuration is given for Classes A through G (8-dBm nominal channel power) used without any restrictions on the 32 available channels.
Table 18-18 Span Loss for Single-Span Link with AD-1C-xx.x Cards, OPT-PRE Amplifiers, and OPT-BST/OPT-BST-E Amplifiers
With OSCM cards1
1
37 dB
31 dB
31 dB
37 dB
37 dB
37 dB
37 dB
Hybrid with OSC-CSM cards2
1
35 dB
31 dB
31 dB
35 dB
35 dB
35 dB
35 dB
1 OSCM sensitivity limits the performance to 37 dB.
2 OSC-CSM sensitivity limits the performance to 35 dB when it replaces the OSCM.
Table 18-19 lists the span loss for a single-span link configuration with one channel and OPT-BST/OPT-BST-E amplifiers. The optical performance for this special configuration is given for Classes A through G. Classes A, B, and C use 8-dBm nominal channel power. Classes D, E, F, and G use 12-dBm nominal channel power. There are no restriction on the 32 available channels. That is, a line card, transponder, or muxponder wavelength can be extracted from the 32 available wavelengths. Also, the optical service channel is not required.
Table 18-20 lists the span loss for a single-span link configuration with one channel, OPT-BST/OPT-BST-E amplifiers, OPT-PRE amplifiers, and ONS 15216 FlexLayer filters. ONS 15216 FlexLayer filters are used instead of the AD-1C-xx.x cards to reduce equipment costs and increase the span length, since the optical service channel is not necessary. The optical performance for this special configuration is given for Classes A through G. Classes A, B, and C use 8-dBm nominal channel power. Classes D, E, F, and G use 12-dBm nominal channel power. There are no restriction on the first 16 available wavelengths (from 1530.33 to 1544.53 nm).
18.4 Automatic Power Control
The ONS 15454 automatic power control (APC) feature performs the following functions:
•
•
•
Note
Amplifier software uses a control gain loop with fast transient suppression to keep the channel power constant regardless of any changes in the number of channels. Amplifiers monitor the changes to the input power and change the output power according to the calculated gain setpoint. The shelf controller software emulates the control output power loop to adjust for fiber degradation. To perform this function, the TCC2/TCC2P needs to know the channel distribution, which is provided by a signaling protocol, and the expected per-channel power, which you can provision. The TCC2/TCC2P compares the actual amplifier output power with the expected amplifier output power and modifies the setpoints if any discrepancies occur.
18.4.1 APC at the Amplifier Card Level
In constant gain mode, the amplifier power out control loop performs the following input and output power calculations, where G represents the gain and t represents time.
Pout (t) = G * Pin (t) (mW)
Pout (t) = G + Pin (t) (dB)
In a power-equalized optical system, the total input power is proportional to the number of channels. The amplifier software compensates for any variation of the input power due to changes in the number of channels carried by the incoming signal.
Amplifier software identifies changes in the read input power in two different instances, t1 and t2 as a change in the carried traffic. The letters m and n in the following formula represent two different channel numbers. Pin/ch represents the per-channel input power:
Pin (t1)= nPin/ch
Pin (t2) = mPin/ch
Amplifier software applies the variation in the input power to the output power with a reaction time that is a fraction of a millisecond. This keeps the power constant on each channel at the output amplifier, even during a channel upgrade or a fiber cut.
Amplifier parameters are configured using east and west conventions for ease of use. Selecting west provisions parameters for the preamplifier receiving from the west and the booster amplifier transmitting to the west. Selecting east provisions parameters for the preamplifiers receiving from the east and the booster amplifier transmitting to the east.
Starting from the expected per-channel power, the amplifiers automatically calculate the gain setpoint after the first channel is provisioned. An amplifier gain setpoint is calculated in order to make it equal to the loss of the span preceding the amplifier itself. After the gain is calculated, the setpoint is no longer changed by the amplifier. Amplifier gain is recalculated every time the number of provisioned channels returns to zero. If you need to force a recalculation of the gain, move the number of channels back to zero.
18.4.2 APC at the Node and Network Levels
The amplifier adjusts the gain to compensate for span loss. Span loss changes due to aging fiber and components, or changes in operating conditions. To correct the gain or express variable optical attenuator (VOA) setpoints, APC calculates the difference between the power value read by the photodiodes and the expected power value. The expected power values is calculated using:
•
•
•
Channel distribution is determined by the sum of the provisioned and failed channels. Information about provisioned wavelengths is sent to APC on the applicable nodes during circuit creation. Information about failed channels is collected through a signaling protocol that monitors alarms on ports in the applicable nodes and distributes that information to all the other nodes in the network.
ASE calculations purify the noise from the power level reported from the photodiode. Each amplifier can compensate for its own noise, but cascaded amplifiers cannot compensate for ASE generated by preceding nodes. The ASE effect increases when the number of channels decreases; therefore, a correction factor must be calculated in each amplifier of the ring to compensate for ASE build-up.
APC is a network-level feature. The APC algorithm designates a master node that is responsible for starting APC hourly or every time a new circuit is provisioned or removed. Every time the master node signals for APC to start, gain and VOA setpoints are evaluated on all nodes in the network. If corrections are needed in different nodes, they are always performed sequentially following the optical paths starting from the master node.
APC corrects the power level only if the variation exceeds the hysteresis thresholds of +/- 0.5 dB. Any power level fluctuation within the threshold range is skipped since it is considered negligible. Because APC is designed to follow slow time events, it skips corrections greater than 3 dB. This is the typical total aging margin that is provisioned during the network design phase. After you provision the first channel or the amplifiers are turned up for the first time, APC does not apply the 3 dB rule. In this case, APC corrects all the power differences to turn up the node.
Note
To avoid large power fluctuations, APC adjusts power levels incrementally. The maximum power correction is +/- 0.5 dB. This is applied to each iteration until the optimal power level is reached. For example, a gain deviation of 2 dB is corrected in four steps. Each of the four steps requires a complete APC check on every node in the network. APC can correct up to a maximum of 3 dB on an hourly basis. If degradation occurs over a longer time period, APC will compensate for it by using all margins that you provision during installation.
When no margin is available, adjustments cannot be made because setpoints exceed ranges. APC communicates the event to CTC, CTM, and TL1 through an APC Fail condition. APC will clear the APC fail condition when the setpoints return to the allowed ranges.
APC automatically disables itself when:
•
•
•
•
•
The APC state (Enable/Disable) is located on every node and can be retrieved by the CTC or TL1 interfaces. If an event that disables APC occurs in one of the network nodes, APC is disabled on all the others and the APC state changes to DISABLE - INTERNAL. The disabled state is raised only by the node where the problem occurred to simplify troubleshooting.
APC raises the following standing conditions at the port level in CTC, TL1, and SNMP:
•
•
After the error condition is cleared, signaling protocol enables APC on the network and the APC DISABLE - INTERNAL condition is cleared. Because APC is required after channel provisioning to compensate for ASE effects, all optical channel network connection (OCHNC) circuits that you provision during the disabled APC state are kept in the Out-of-Service and Autonomous, Automatic In-Service (OOS-AU,AINS [ANSI]) or Unlocked-disabled,automaticInService (ETSI) service state until APC is enabled. OCHNCs automatically go into the In-Service and Normal (IS-NR [ANSI]) or Unlocked-enabled (ETSI) service state only after APC is enabled.
18.4.3 Managing APC
The automatic power control status is indicated by four APC states shown in the node view status area:
•
•
•
•
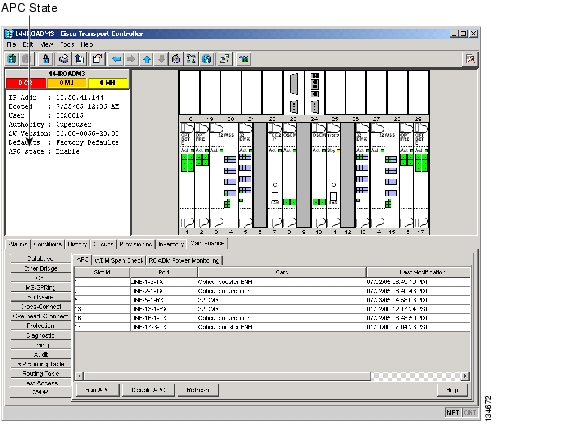
You can view the automatic power control information and disable and enable APC manually on the Maintenance > DWDM > APC subtab ( Figure 18-8).
Caution
Figure 18-8 Automatic Power Control
The APC subtab provides the following information:
•
•
•
•
•
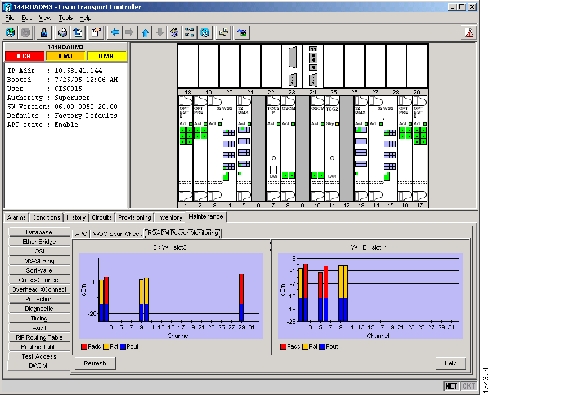
18.5 ROADM Power Equalization Monitoring
Reconfigurable OADM (ROADM) nodes allow you to monitor the 32WSS card equalization functions on the Maintenance > DWDM > Power Monitoring subtab ( Figure 18-9). The tab shows the input channel power (Padd), the express or pass-through (Ppt) power and the power level at output (Pout).
Figure 18-9 Power Monitoring Subtab
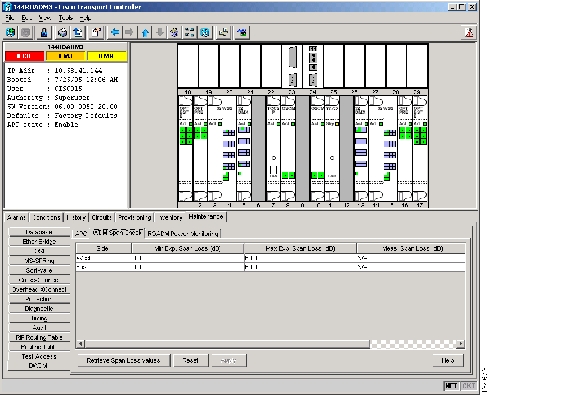
18.6 Span Loss Verification
Span loss measurements can be performed from the Maintenance > DWDM > WDM Span Check subtab ( Figure 18-10). The CTC span check compares the far-end OSC power with the near-end OSC power. A "Span Loss Out of Range" condition is raised when the measured span loss is higher than the maximum expected span loss. It is also raised when the measured span loss is lower than the minimum expected span loss and the difference between the minimum and maximum span loss values is greater than 1 dB. The minimum and maximum expected span loss values are calculated by Cisco MetroPlanner for the network and imported into CTC. However, you can manually change the minimum and expected span loss values.
CTC span loss measurements provide a quick span loss check and are useful whenever changes to the network occur, for example after you install equipment or repair a broken fiber. CTC span loss measurement resolutions are:
•
•
For ONS 15454 span loss measurements with higher resolutions, an optical time domain reflectometer (OTDR) must be used.
Figure 18-10 Span Loss Verification
18.7 Network Optical Safety--Automatic Laser Shutdown
Automatic laser shutdown (ALS) is a technique used to automatically shut down the output power of OSC laser transmitters (contained in the OSCM and OSC-CSM cards) and optical amplifiers (contained in OPT-BST cards) in the event of a fiber break. Cards with OSC laser transmitters and optical amplifiers (OPT-BST only) can be provisioned as follows with respect to ALS:
•
•
Note
•
•
In the following paragraphs, two ALS scenarios are given:
•
•
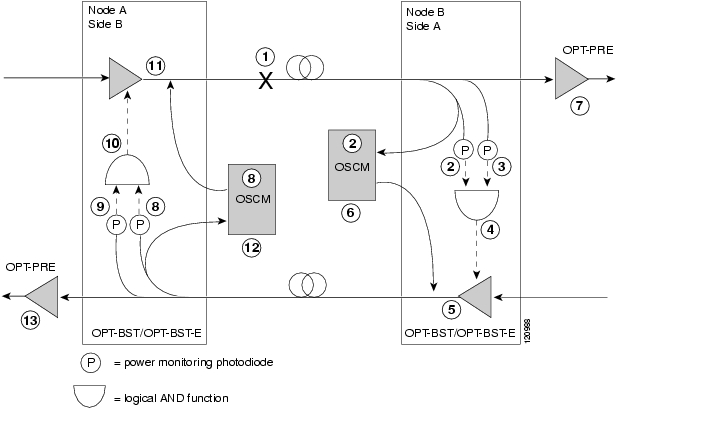
18.7.1 Scenario 1: Fiber Cut in Nodes Using OPT-BST/OPT-BST-E Cards
Figure 18-11 shows nodes using OPT-BST/OPT-BST-E cards with a fiber cut between them.
Figure 18-11 Nodes Using OPT-BST/OPT-BST-E Cards
Two photodiodes at Node B monitor the received signal strength for the optical payload and optical service channel (OSC) signals. When the fiber is cut, a loss of signal (LOS) is detected at both of the photodiodes. The AND function then indicates an overall LOS condition, which causes the OPT-BST/OPT-BST-E transmitter, OPT-PRE transmitter, and OSCM lasers to shut down. This in turn leads to a LOS for both the optical payload and OSC at Node A, which causes Node A to turn off the OSCM, OPT-PRE transmitter, and OPT-BST/OPT-BST-E transmitter lasers. The sequence of events after a fiber cut is as follows (refer to the numbered circles in Figure 18-11):
1.
2.
3.
4.
5.
6.
7.
8.
9.
10.
11.
12.
Note
13.
When the fiber is repaired, either an automatic or manual restart at the Node A OPT-BST/OPT-BST-E transmitter or at the Node B OPT-BST/OPT-BST-E transmitter is required. A system that has been shut down is reactivated through the use of a restart pulse. The pulse is used to signal that the optical path has been restored and transmission can begin. For example, when the far end, Node B, receives a pulse, it signals to the Node B OPT-BST/OPT-BST-E transmitter to begin transmitting an optical signal. The OPT-BST/OPT-BST-E receiver at Node A receives that signal and signals the Node A OPT-BST/OPT-BST-E transmitter to resume transmitting.
Note
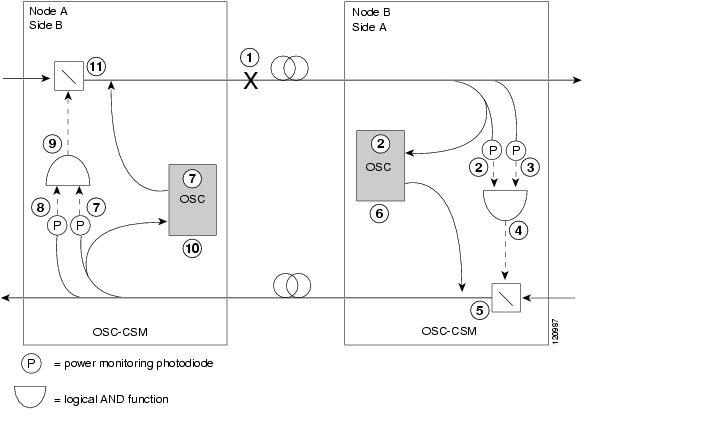
18.7.2 Scenario 2: Fiber Cut in Nodes Using OSC-CSM Cards
Figure 18-12 shows nodes using OSC-CSM cards with a fiber cut between them.
Figure 18-12 Nodes Using OSC-CSM Cards
Two photodiodes at the Node B OSC-CSM card monitor the received signal strength for the received optical payload and OSC signals. When the fiber is cut, LOS is detected at both of the photodiodes. The AND function then indicates an overall LOS condition, which causes the Node B OSC laser to shut down and the optical switch to block traffic. This in turn leads to LOS for both the optical payload and OSC signals at Node A, which causes Node A to turn off the OSC laser and the optical switch to block outgoing traffic. The sequence of events after a fiber cut is as follows (refer to the numbered circles in Figure 18-12):
1.
2.
3.
4.
5.
6.
7.
8.
9.
10.
11.
When the fiber is repaired, either an automatic or manual restart at the Node A OSC-CSM OSC or at the Node B OSC-CSM OSC is required. A system that has been shut down is reactivated through the use of a restart pulse. The pulse is used to signal that the optical path has been restored and transmission can begin. For example, when the far-end Node B receives a pulse, it signals to the Node B OSC to begin transmitting its optical signal and for the optical switch to pass incoming traffic. The OSC-CSM at Node A then receives the signal and tells the Node A OSC to resume transmitting and for the optical switch to pass incoming traffic.
18.8 Network-Level Gain—Tilt Management of Optical Amplifiers
The ability to control and adjust per channel optical power equalization is a principal feature of ONS 15454 DWDM Metro-Core network applications. A critical parameter to assure optical spectrum equalization throughout the DWDM system is the gain flatness of EDFA amplifiers.
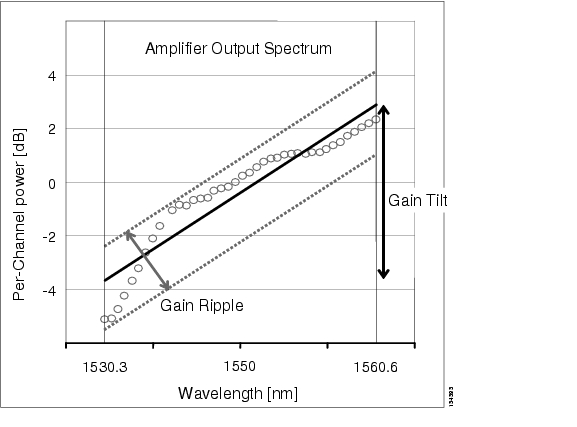
Two items, gain tilt and gain ripple, are factors in the power equalization of optical amplifier cards such as the OPT-BST/OPT-BST-E or OPT-PRE. Figure 18-13 is a graph of the amplifier output power spectrum and how it is affected by gain tilt and gain ripple.
Figure 18-13 Effect of Gain Ripple and Gain Tilt on Amplifier Output Power
Gain ripple and gain tilt are defined as follows:
•
•
Gain tilt is the only contribution to the power spectrum disequalization that can be compensated at the card level. A Variable Optical Attenuator (VOA) internal to the amplifier can be used to compensate for gain tilt.
An Optical Spectrum Analyzer (OSA) device is used to acquire the output power spectrum of an amplifier. The OSA shows the peak-to-peak difference between the maximum and minimum power levels, and takes into account the contributions of both gain tilt and gain ripple.
Note
18.8.1 Gain Tilt Control at the Card Level
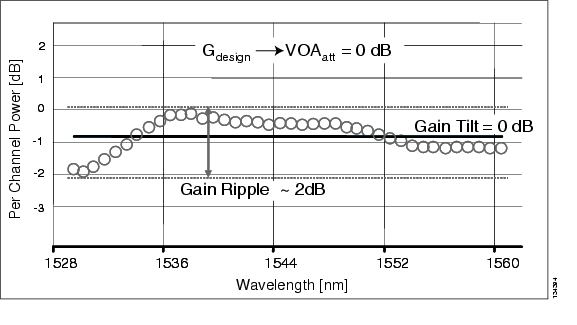
The OPT-BST/OPT-BST-E and OPT-PRE amplifier cards have a "flat" output (gain tilt = 0 dB) for only a specific gain value (Gdesign), based on the internal optical design (see Figure 18-14).
Figure 18-14 Flat Gain (Gain Tilt = 0 dB)
If the "working" gain setpoint of the amplifier is different from Gdesign, the output spectrum begins to suffer a gain tilt variation.
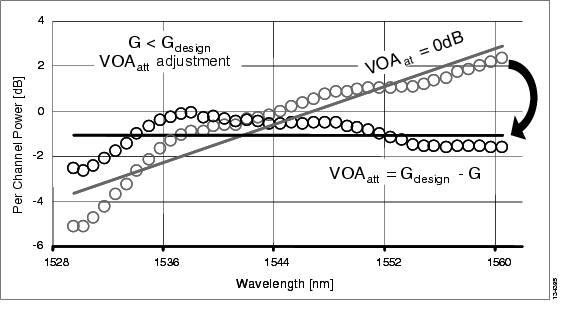
In order to compensate for the absolute value of the increase of the spectrum tilt, the OPT-BST/OPT-BST-E and OPT-PRE cards automatically adjust the attenuation of the VOA to maintain a flat power profile at the output, as shown in Figure 18-15.
Figure 18-15 Effect of VOA Attenuation on Gain Tilt
The VOA attenuator automatic regulation guarantees (within limits) a "zero tilt" condition in the EDFA amplifier for a wide range of possible gain setpoint values.
Table 18-22 shows the "flat output" gain range limits for the OPT-BST/OPT-BST-E and OPT-PRE cards, as well as the maximum (worst case) values of gain tilt and gain ripple expected in the specific gain range.
If the "operating" gain value is outside of the range shown in Table 18-22, the EDFA amplifier introduces a tilt contribution for which the card itself cannot directly compensate. This condition is managed in different ways, depending the amplifier card type:
•
•
18.8.2 System Level Gain Tilt Control
System level gain tilt control for OPT-PRE cards is achievable with two main scenarios:
•
•
18.8.2.1 System Gain Tilt Compensation Without ROADM Nodes
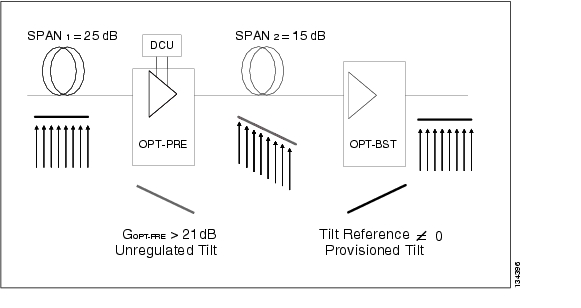
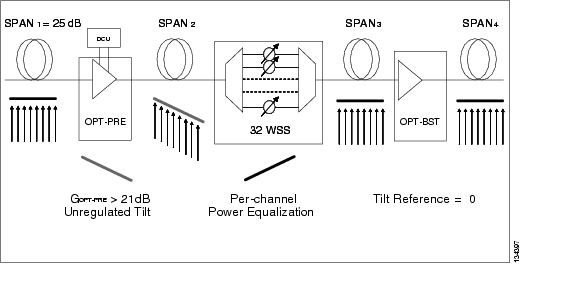
When an OPT-PRE card along a specific line direction (West to East or East to West) is working outside the "flat output" gain range (G > 21 dB), the unregulated tilt is compensated for in spans not facing ROADM nodes by configuring an equal but opposite tilt on one or more of the amplifiers in the downstream direction. The number of downstream amplifiers involved depends on the amount of tilt compensation needed and the gain setpoint of the amplifiers that are involved. See Figure 18-16.
Figure 18-16 System Tilt Compensation Without a ROADM
The proper Tilt Reference value is calculated by MetroPlanner and inserted in the Installation Parameter List imported during the Node Turn-Up procedure (see "NTP-G138 Import a Cisco MetroPlanner Configuration File" task on page 3-82). For both OPT-PRE and OPT-BST/OPT-BST-E cards, the provisionable Gain Tilt Reference range is between -3 dB and +3 dB.
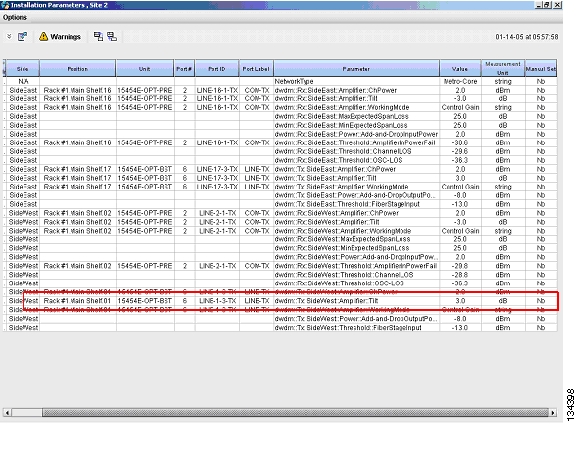
During the Automatic Node Setup (ANS) procedure, the Tilt value for the OPT-BST/OPT-BST-E or OPT-PRE card is provisioned by the TCC card (see Figure 18-17). The provisioned Tilt Reference Value is reported in the CTC OPT-PRE or OPT-BST/OPT-BST-E card view (Provisioning > Opt.Ampli.Line > Parameters > Tilt Reference).
Figure 18-17 MetroPlanner Installation Parameters
18.8.2.2 System Gain Tilt Compensation With ROADM Nodes
When an ROADM Node is present in the network, as shown in Figure 18-18, a per-channel dynamic gain equalization can be performed. Both gain tilt and gain ripple are completely compensated using the following techniques:
•
•
Figure 18-18 System Tilt Compensation With a ROADM
![]()
![]()
![]()
![]()
![]()
![]()
![]()
![]()
Posted: Mon Dec 3 03:45:18 PST 2007
All contents are Copyright © 1992--2007 Cisco Systems, Inc. All rights reserved.
Important Notices and Privacy Statement.