|
|

The Network Data Collector tool is made up of eight processes, each available in the Network Data Collector drawer. The processes are performed in the order shown below. Once one process is successfully completed, the next process will automatically begin.
1. Net Audit Settings
2. Device Import/Discovery
3. Device Selection
4. Access Verification
5. Interface/Ports Selection (VoIP audit only)
6. Data Collection
7. Data Collection Status
8. Data Packaging
The following shows an overview of the Net Audit process performed using the Network Data Collector Tool.
Step 2 Import and/or add devices.
Step 3 Select devices to be tested for telnet access capability.
Step 4 Run selected devices through telnet access verification test.
Step 5 From the devices that passed access verification, select the ones to include in the data collection.
Step 6 Start or schedule data collection.
Step 7 Start data packaging.
Step 8 Upload files to CCO.
The initialization phase of setting up an audit is done here. The following information can be entered on this screen:
Procedure
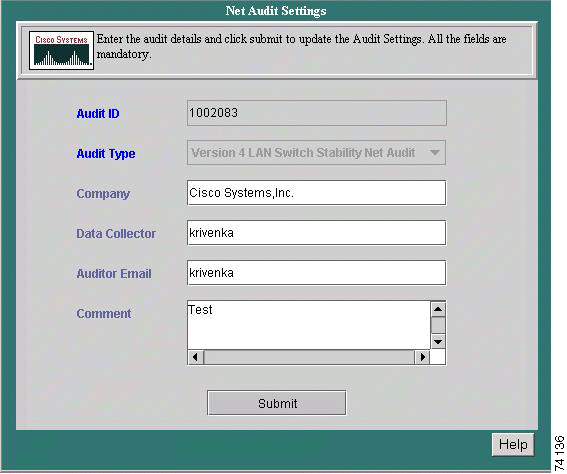
Step 2 Enter the name of the company the audit is being peformed for in the Company field.
Step 3 Enter the name of the company contact person in the Audit Engineer field.
Step 4 Enter the email address of the audit engineer in the Auditor Email field.
Step 5 Enter any information deemed pertinent in regards to the audit being performed in the Comment field.
Step 6 Click Submit.
Important
Select the Import method to choose which devices to include in the Net Audit. The methods available include Discovery and Network Management System import.
Use this option to specify the device discovery method for your network. Choose from CDP, Pingsweep Starting IP Address, or Pingsweep IP Address Range. An Advanced Settings link containing the following Resource Management Essentials (RME) tools is also available from within each method:
Discovers only CDP (Cisco Discovery Protocol) enabled Cisco devices. This method takes the least time to complete and is most useful in networks made up entirely of Cisco devices. Products acquired by Cisco do not support CDP. CDP is found in IOS 10.0 and later, and is not supported by WAN switches.
Devices running CDP periodically send out CDP hello messages that are picked up by other CDP-enabled devices and formulate a table of connected devices.
Procedure
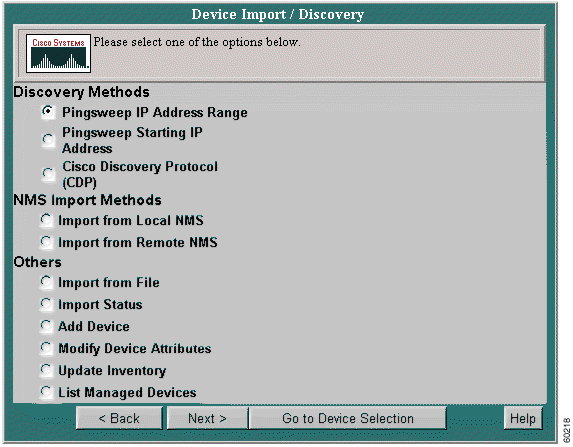
Step 2 Click the radio button next to Cisco Discovery Protocol (CDP).
Step 3 Click Next. The Cisco Discovery Protocol-Starting IP Address & Hops screen appears.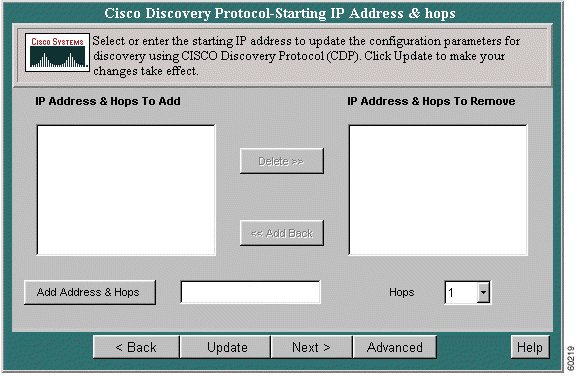
Step 4 To delete an entry from the IP Address & Hops To Add window, select it, then click Delete. The entry is moved to the IP Address & Hops To Remove window.
Step 5 To return a deleted entry to the IP Address & Hops To Add window, select it, then click Add Back.
Step 6 To add a new IP address, enter the address in the Add Address & Hops window.
Step 7 Select the number of hops to be run from the Hops pull-down menu.
Step 8 Click Update. The new entries appear in the IP Address and Hops window.
Discovers all SNMP-enabled Cisco devices in your network. This method takes the longest time to complete but is the most comprehensive. In this method, device discovery finds all devices connected to the device whose IP address is given. The process is repeated recursively until all devices are reached.
Procedure
Step 2 Click the radio button next to Pingsweep Starting IP Address.
Step 3 Click Next. The Pingsweep Starting IP Address screen appears.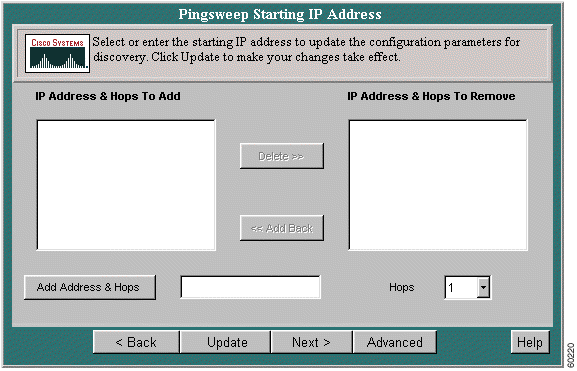
Step 4 To delete an entry from the IP Address & Hops To Add window, select it, then click Delete. The entry is moved to the IP Address & Hops To Remove window.
Step 5 To return a deleted entry to the IP Address & Hops To Add window, select it, then click Add Back.
Step 6 To add a new IP address, enter the address in the Add Address & Hops window.
Step 7 Select the number of hops to be run from the Hops pull-down menu.
Step 8 Click Update. The new entries appear in the IP Address and Hops window.
Discovers a specific range of SNMP-enabled Cisco devices in your network. This method takes more time to complete than the CDP method but less time than the Pingsweep Starting IP Address method. This method is useful if you know the unique IP subnets in the network. In this method, device discovery finds all the devices within a range of user-supplied IP addresses. It also provides the ability to find unique IP address ranges from a single device and perform device discovery using the address ranges.
Procedure
Step 2 Click the radio button next to Pingsweep IP Address Range.
Step 3 Click Next. The Pingsweep IP Address Range screen appears.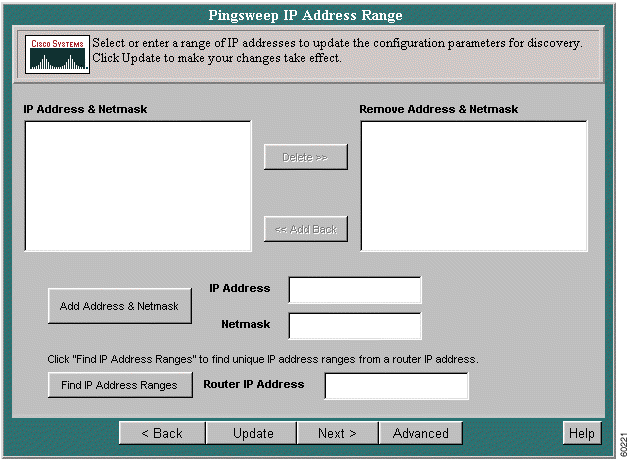
Step 4 To delete an entry from the IP Address & Netmask window, select it, then click Delete. The entry is moved to the IP Address & Netmask To Remove window.
Step 5 To return a deleted entry to the IP Address & Netmask window, select it, then click Add Back.
Step 6 To add a new IP address and netmask, enter the address in the Add Address & Netmask window and click Add Address & Netmask.
Step 7 If you do not know the unique IP address ranges, enter the main router IP address in the Router IP Address window and click Find IP Address Ranges. The IP address ranges will be found.
Step 8 Click Update. The new entries appear in the IP Address and Netmask window.
The NMS Import module will allow the device list to be imported from an existing Network Management System (NMS). Select to import from either a Local NMS or a Remote NMS.
Local NMS Import gets the list of devices being managed by the specified local NMS and makes them available to RME applications.
You can populate your RME server with device inventory data by importing the data from a supported network management system database residing on the local host.
Procedure
Step 2 Click the radio button next to Import from Local NMS.
Step 3 Click Next. The Local NMS Import screen appears.
Step 4 Select the database you are importing from the NM Product drop-down list box. Only applicable products appear.
Step 5 Click a radio button in the Reconciliation Criteria list. This specifies the conflict resolution method to apply if there is a conflict between a device you try to import and a managed device with the same hostname and domain name.
Step 6 Select Cisco Devices Only or Customize or both under Special Options, then click Next. To change default import options, click Customize.
Step 7 Click Finish. The Add/Import Status Summary displays the number of devices that are managed, alias, pending, conflicting, suspended, and not responding.
Remote NMS Import gets the list of devices being managed by the specified remote NMS and makes them available to RME applications.
You can populate your RME server with device inventory data by importing the data from a supported network management system database residing on a remote host. Device import supports the following NMS databases.
Procedure
Step 2 Click the radio button next to Import from Remote NMS.
Step 3 Click Next. The Remote NMS Import dialog box appears.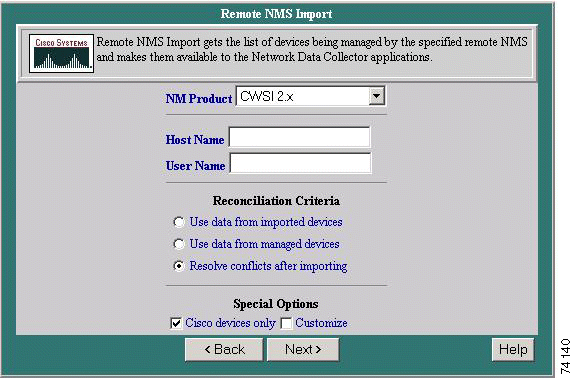
Step 4 In the Host Name field, enter the network name of the host on which the remote NMS resides. In the User Name field, enter the name of the remote user.
Step 5 Click a radio button from the Reconciliation Criteria list. This specifies the conflict resolution method to apply if there is a conflict between a device you try to import and a managed device with the same host and domain names.
Step 6 Select Cisco Devices Only or Customize or both from Special Options, then click Next. If you are importing non-Cisco devices or you want to enter device information, click Customize.
Step 7 Click Finish. The Add/Import Status Summary displays the number of devices that are managed, alias, pending, conflicting, suspended, and not responding.
Import a device from a file, check the status of an import, add a device, modify a device, update inventory, or list managed devices.
You can add multiple devices to Network Data Collector from a data source other than a supported NMS. Instead of adding each device individually using the online dialog box, you can perform a bulk device import from two kinds of files:
CSV files are the recommended way to import devices. They are generally easier to create, and they provide most, but not all, of the DIF functionality. If you cannot import device information from a CSV file, you can try importing from a DIF.
To validate device addresses before importing from a file, run the checkaddr.pl utility from the command line (from <your installation folder>/bin/checkaddr.pl).
Procedure
Step 2 Click the radio button next to Import from File.
Step 3 Click Next. The Import from File screen appears.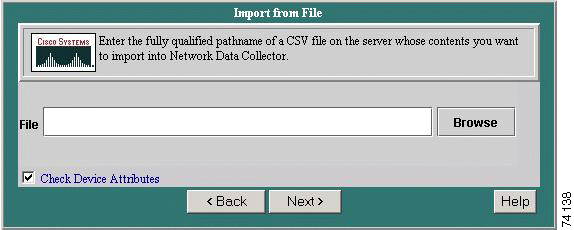
Step 4 Enter the fully qualified pathname of a CSV file on the server whose contents you want to import.
Step 5 Click Next to add the file.
The Add/Import Status Summary dialog box appears when you open it directly from the navigation tree and automatically when you add or import devices into Network Data Collector. Use the Add/Import Status Summary dialog box to:
The Add/Import Status Summary displays device states of managed, alias, pending, conflicting, suspended, not responding, as well the number device attribute errors (if any). The pending count shows 0 when all devices have been added or imported.
Procedure
Step 2 Click the radio button next to Import Status.
Step 3 Click Next. The Add/Import Status Summary screen appears.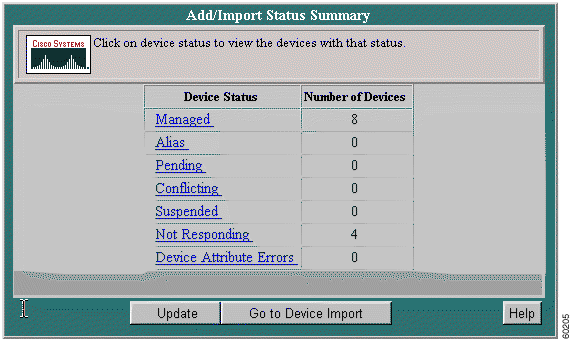
Step 4 Click Update to refresh the display during the operation. You can continue to update the display until the pending count goes to 0.
Step 5 To display a read-only list of managed devices, click Managed.
Add devices individually to the Network Data Collector inventory by specifying basic device information for each device. The device will become managed if the device is reached and SNMP data acquired. If you use this option to add a device that duplicates an already managed device (same device and domain names), RME discards any preexisting device data and polls the device for new data.
Procedure
Step 2 Click the radio button next to Add Device.
Step 3 Click Next. The Add a Single Device dialog box appears.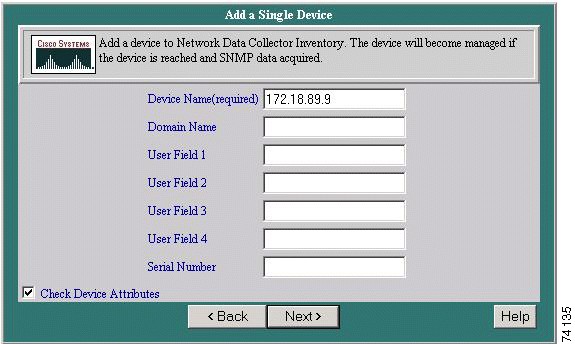
Step 4 Enter the device access, user, and serial number information:
Step 5 Select Check Device Attributes if RME is installed and you want verify device attribute information after the device is added.
Step 6 Click Next. The Enter Login Authentican Information dialog box appears.
Step 7 Enter the login authentication information for Telnet login mode:
Step 8 Click Next. The Enter Enable Authentican Information dialog box appears.
Step 9 Enter the enable authentication information for Telnet enable mode:
Step 10 Click Finish. The Single Device Add dialog box shows that the device has been added to the Pending list. After adding a device, you can click Add Another to add another device.
Step 11 Click View Status to display the Add/Import Status Summary of the number of devices that are managed, alias, pending, conflicting, suspended, and not responding:
Step 12 Click Update to display the most recent information.
Add, change, and delete the following attributes for one or more managed devices:
Except for device serial numbers, any changes are applied to all selected devices.
Procedure
Step 2 Click the radio button next to Modify Device Attributes.
Step 3 Click Next.The Modify Device Attributes screen appears.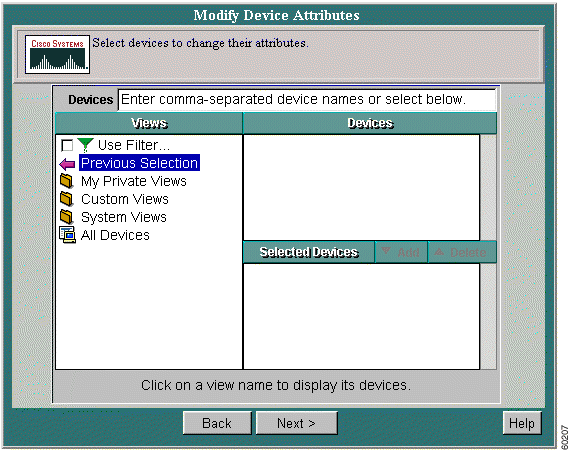
Step 4 Select the devices whose device information you want to edit, then click Next. The Change dialog box displays the following options:
Select one or more options, then click Next. A dialog box appears for each option you select (selecting All displays each dialog box). The dialog box fields are blank; they do not display the current information.
Step 5 Edit the dialog box:
Step 6 When you finish:
Run inventory collection as a one-time event for specific devices. To collect inventory at regular intervals (hourly, daily, or weekly), use the Start/Stop Data Collection procedure. Both procedures update your inventory database and show changes in all associated inventory reports.
For inventory collection to work, your devices must have accurate read community strings entered.
Procedure
Step 2 Click the radio button next to Update Inventory.
Step 3 Click Next. The Update Inventory dialog box appears.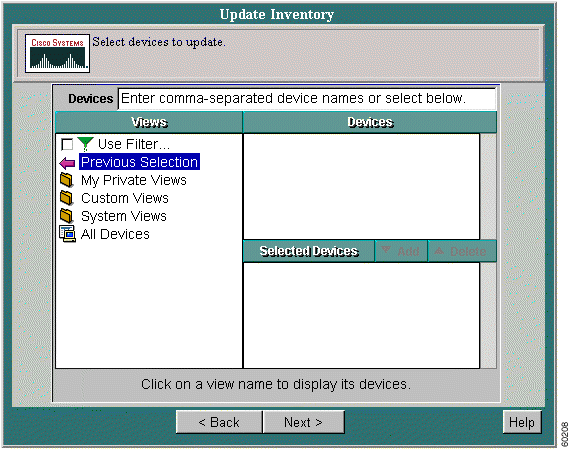
Step 4 Select the devices you want polled for new information, then click Finish.
The Update Inventory dialog box displays inventory collection status. The status field shows that the IcServer:
Step 5 If the IcServer is running, click Update. Continue to click Update until the IcServer is ready, indicating that inventory collection is complete.
Display a read-only list showing all currently managed devices.
Procedure
Step 2 Click the radio button next to List Managed Devices.
Step 3 Click Next. The List Managed Devices screen appears.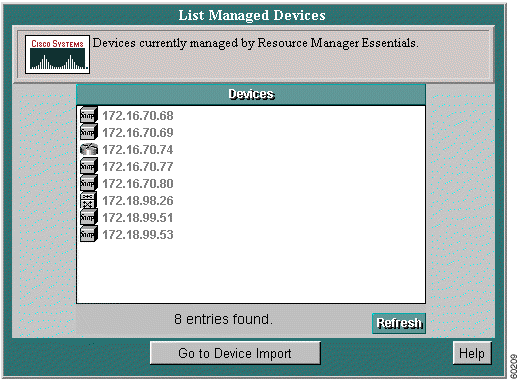
Step 4 The List Managed Devices dialog box displays the names of the managed devices.
Step 5 To refresh the list, click Refresh.
Step 6 Click Go to Device Import to return to the Device Import/Discovery dialog box.
All eligible routers and/or switches added or imported in the Device Import & Discovery section will appear in their respective Switch List or Router List screen. Select one or more of each to include in the audit. The devices selected be will tested using the Access Verifier as explained in the Starting/Stopping Telnet Access Verification section. Devices on the Switch List and Router List screens will appear in one of the following two columns:
Procedure
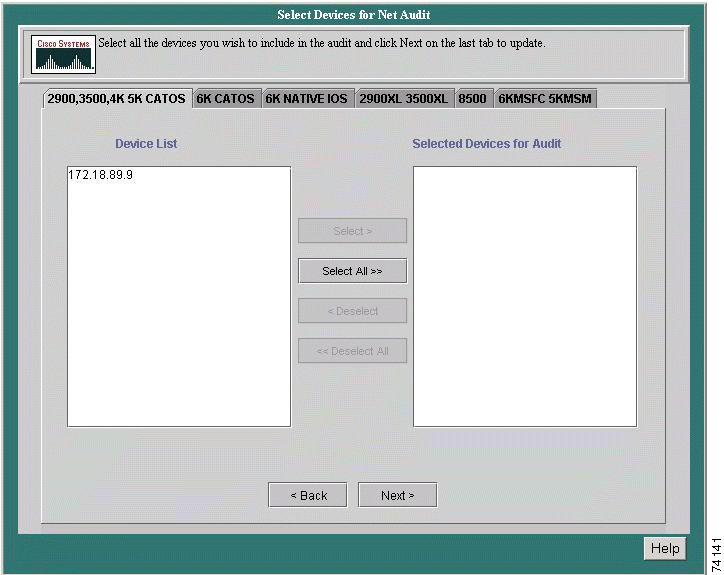
Step 2 Highlight the device (or devices) in the Device List window to be included in the audit.
Step 3 Click Select. The highlighted router(s) will be moved to the Selected Devices for Audit window (or click on Select All to move all devices to the Selected Devices for Audit window).
Step 4 To unselect a device, highlight the device in the Selected Devices for Audit window and click on Deselect to return it to the Device List window (or Deselect All to return all devices).
Step 5 Click on Next to proceed to Access Verification (or the Switch List window if a VoIP audit is being run. Repeat stpes 4 through 6 and click Next again to advance to Access Verification).
Access verification tests for access problems before data collection begins. All devices chosen from the Select Devices for Audit page will be tested using the Telnet Access Verifier. Data collection fails if the maximal failure rate is exceeded while collecting data.
If an error or failure is detected, it must be fixed before the audit can be performed. Depending on the type of error, it may be necessary to return to the Device Import & Discovery page. From this page, use the Modify Device Attributes feature to make the necessary changes. You can add, change, and delete the following attributes for one or more managed devices:
Procedure
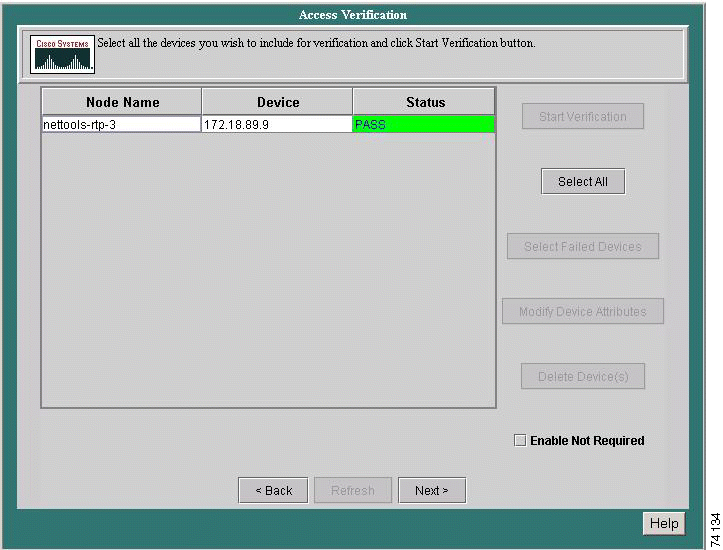
Step 2 Select the device(s) in the Node Name column to run through the telnet access verification process. Use the Ctrl or Shift keys to select multiple devices, or click on Select All to choose all the devices listed.
Step 3 Click Start Verification. Once the telnet access verification process is complete, the result of the test will appear in the Status column next to each device. If no errors were detected, click Finished.
Any errors detected during the telnet access verification process must be fixed before the audit can be completed. Do the following to fix an error, or to simply change the attribute of a particular device:
Step 2 Click Modify Device Attributes. The Modify Device Attributes dialog box appears.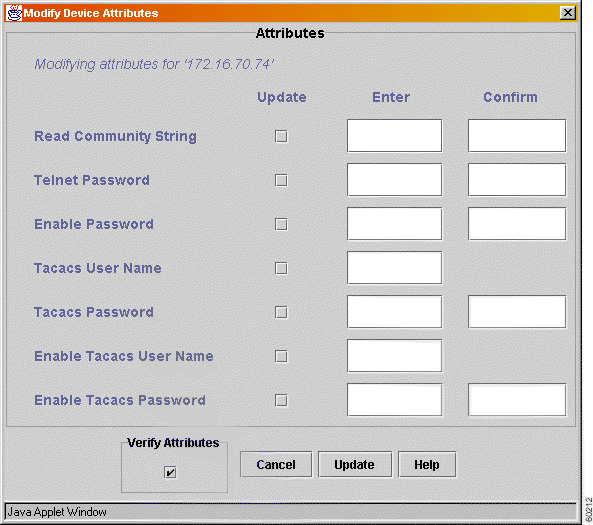
Step 3 Make the change in the Enter column to the right of the desired topic. Re-enter the change in the Confirm column (for verification purposes) if required.
Step 4 Click in the checkbox next to the attribute changed. Only attributes checkmarked will be updated.
Step 5 Click in the Verify Attributes checkbox to have the new attributes verified immediately. Leave unchecked if you only wish to update an attribute.
Step 6 Click Update to return to Access Verification. Verification will automatically begin if the Verify Attributes checkbox was checked.
Step 7 If the Verify Attributes checkbox was not checked (see step 4), highlight the device(s) to re-test in the Node Name column and click Start Verification.
Step 8 Click Finished once device(s) pass verification.
The interfaces and ports of all routers and/or switches that passed the telnet access verification test will appear in their respective Router Interface Selection or Switch Port Selection screen. Select one or more of each to add to the device list for data collection. Interfaces/ports on the Router Interface Selection and Switch Port Selection screens will appear in one of two columns. The left column lists all devices that passed the telnet access verification test and are elegible for data collection; the right column shows the devices actually selected for data collection. Both columns are split into the following two fields:
Procedure
Step 2 Highlight the interface (interfaces) in the left column to be included in the audit.
Step 3 Click on Select. The highlighted interface(es) will be moved to the right column (or click on Select All to move all intefaces to the right column at once).
Step 4 Click on Next to proceed to the Switch Port Selection window.
Step 5 Highlight the port (or ports) in the the left column to be included in the audit.
Step 6 Click on Select. The highlighted port(s) will be moved to the right column (or click on Select All to move all ports to the right column at once).
Step 7 Click Next to proceed to start or schedule the data collection.
Start the data collection immediately or use the scheduler to set a time within in the next five years to begin data collection. You can stop data collection or change the schedule at any time. When scheduling a data collection, the following parameters can be set:
Procedures
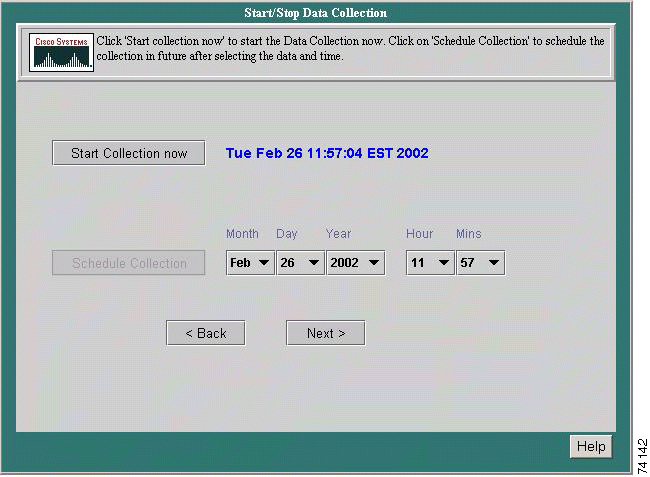
Step 2 Click Start Collection.
Step 2 Select Schedule Collection.
Step 3 Select the month to begin the data collection from the Month pull-down menu.
Step 4 Select the day to begin the data collection from the Day pull-down menu.
Step 5 Select the year to begin the data collection from the Year pull-down menu.
Step 6 Select the hour to begin the data collection from the Hour pull-down menu
Step 7 Select the minute to begin the data collection from the Minute pull-down menu.
Step 8 Click Next.
The Data Collection Status screen allows you to monitor the status of the current data collection process. The information displayed on this page reflects cumulative data for all routers and switches from the beginning of the collection up to the time the Data Collection Status screen was accessed. The Net Audit Success Rate is used to determine the success/failure of the audit. The success rate must be 80% or higher for the audit to pass.
The node status can be in one of three states:
The % Success number indicates the ratio of nodes tested to nodes passed.
Procedures
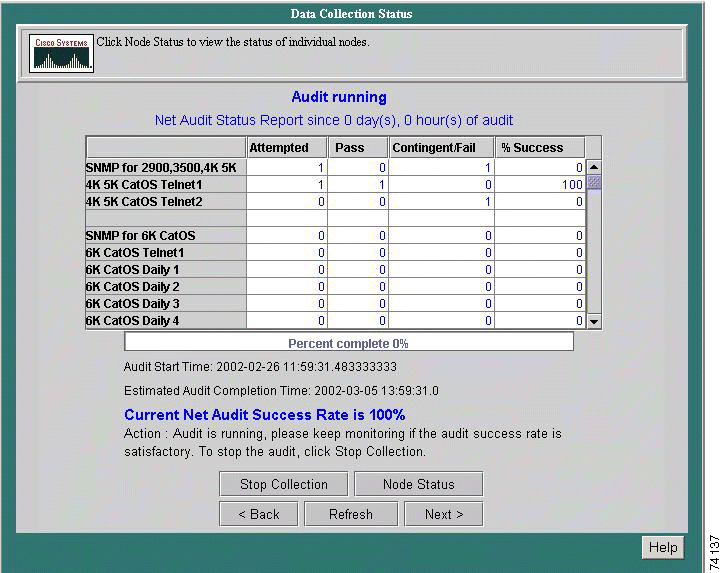
Step 2 Select Stop Collection to end the current data collection process if needed.
Step 3 Click Node Status to advance to the Node Status screen. A more detailed breakdown of the current data collection process can be viewed there.
Step 4 Click Next to advance to Data Packaging.
The Node Status Report screen displays a breakdown of the information listed on the Data Collection Status screen. The information displayed on this page reflects data for specific routers and switches from the beginning of the collection up to the time the Data Collection Status screen was accessed. Information for the routers and switches in the current data collection are displayed in separate windows.
If a node is not at an 80% SNMP success and unable to reach 80% or higher by the end of the audit, it will shown as failed without explanation.
Procedures
Step 2 Click Node Status. The Network Data Collector Node Status screen appears.
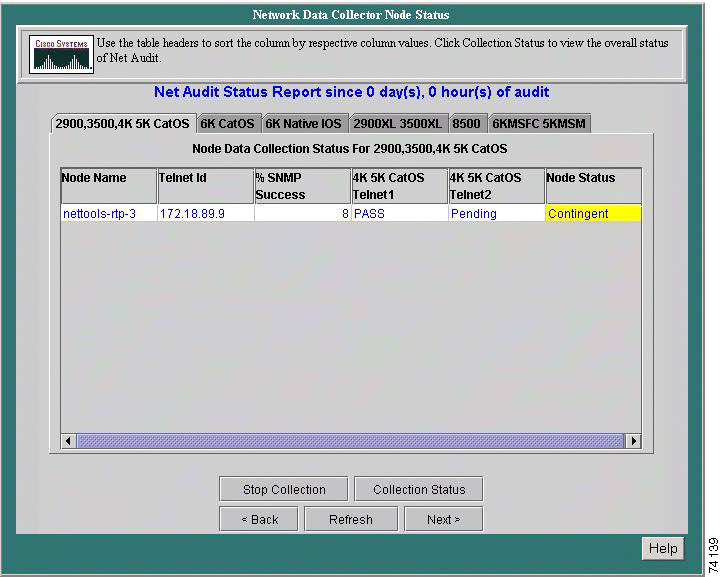
Step 3 Click Collection Status to return to the Data Collection Status screen (or Stop Collection to end the current collection process).
The output path is automatically set to the location on your local computer where the compressed and packaged files created during the data upload are to be stored. These files can then be sent via an encrypted link back to a location at Cisco.
Data packaging can be performed before, during or after an audit. If started prior to an audit (so just to keep packaged data), all files and sub directories will be packaged. During an audit, data packaging can be performed even if iteration fails or the poller crashes.The audit must be running to do this, however.
Procedure
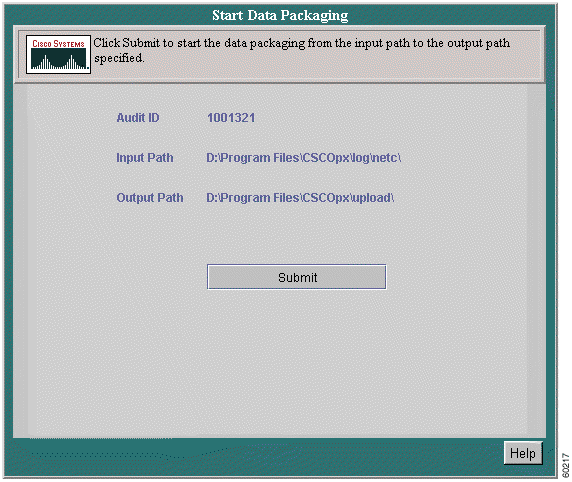
Step 2 Verify all settings and click Submit.
Once the compressed and packaged files are stored on your local computer, you'll need to upload them to a CCO server. To upload the files to CCO, do the following:
Step 2 Change directory to /incoming/netcollector.
Step 3 Set transfer mode to binary.
Step 4 Select the compressed and packaged file from where it is stored on the local computer (Network Data Collector server).
Step 5 Initiate the FTP (put the files onto CCO).
Step 6 Close the connection after FTP is done.
The above upload procedure can also be performed using the following commandline format:
C:\>ftp nettools-upload.cisco.com
ftp>username: anonymous
ftp>password: <email_id>@domainname.com
ftp>cd /incoming/netcollector
ftp>bin
ftp>lcd c:\progra~1\cscopx\upload
ftp>put A1000.out
ftp>bye
C:\>
FTP Upload allows you to upload the collected data to Cisco. The data will be uploaded from <NETCHOME>/upload to Cisco.
Before performing this step, however, you should package the data using the Network Data Collector --> Data Packaging tool.
If you need to configure the FTP with proxy details, go to Network Data Collector -> Advanced Settings -> Audit Details --> FTP Settings to make any changes.
Procedures
Step 2 Click Start Upload to immediately start uploading the collected data to Cisco.
Network Data Collector also comes with an Advanced Settings folder, which contains a collection of useful links from RME and CiscoWorks 2000 utilities. The folder contains the following sub-folders:
The following table shows the tools found in the above sub-folders.
| Discovery | Inventory | Adudit Details | Process Management | Administration |
|---|---|---|---|---|
|
|
|
|
|
| Trouble- shooting |
|---|
|
Click the Help button while in any of the above tools to learn more about that tool and how to use it.
You can export your device and device access information to an output file in a predefined directory in either comma separated values (CSV) or data integration file (DIF) format. This file lets you view information before importing it into your own spreadsheet or database. You can also change the information from within the file, then import the data to Network Data Collector in either file format.
Procedure
Step 2 Enter the full pathname of the file to which you want to write the data.
Step 3 Select the output version (version 1.0 or version 2.0).
Step 4 Click Next. A confirmation message appears. If the file already exists, you will be asked to confirm overwriting the file.
![]()
![]()
![]()
![]()
![]()
![]()
![]()
![]()
Posted: Mon Mar 25 15:15:24 PST 2002
All contents are Copyright © 1992--2002 Cisco Systems, Inc. All rights reserved.
Important Notices and Privacy Statement.