|
|

Table Of Contents
1.2 General Model of Problem Solving
1.3 Maintaining Network Information
1.4 Network and System Management
1.5 Third-Party Troubleshooting Tools
1.6 Using General Diagnostic Commands
1.8 Configuring Online Diagnostics
1.8.1 Displaying the Online Diagnostics Configuration and Results
1.9.1 Configuring Power-On Diagnostics
1.9.2 Displaying the Power-On Diagnostic Test Results
1.10 Checking Release Notes for Workarounds
1.10.2 Checking Cisco IOS Release Notes
1.11 Initial Troubleshooting Checklist
Troubleshooting Overview
This chapter gives a brief overview of the Cisco ONS 15530 Troubleshooting Guide as well as a troubleshooting overview of the various areas that might require troubleshooting. This chapter includes the following sections:
•
Overview
•
•
•
•
•
•
•
•
Basic troubleshooting processes, such as troubleshooting Ethernet connections, that are not specific to the Cisco ONS 15530 are not described in this document. This information is found online in other troubleshooting guides such as the Cisco IOS Internetwork Troubleshooting Guide.
1.1 Overview
The Cisco ONS 15530 is a modular and scalable optical switching and aggregation platform designed to supplement the Cisco ONS 15540 ESP and Cisco ONS 15540 ESPx. With the Cisco ONS 15530, users can take advantage of the availability of dark fiber to build a common infrastructure that supports data, SAN (storage area network), and TDM (time-division multiplexing) traffic.
The Cisco ONS 15530 uses DWDM (dense wavelength-division multiplexing) to transport up to 32 wavelengths on a single fiber pair, and Cisco ONS 15530 systems can be stacked together for expansion and aggregation.
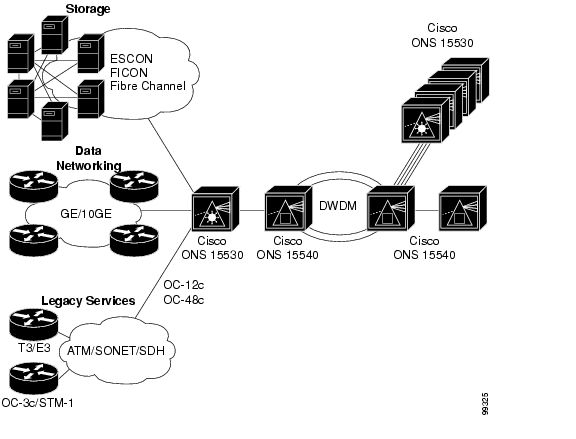
The Cisco ONS 15530 transports a wide variety of traffic including SONET/SDH and ATM at OC-3/STM-1, OC-12/STM-4, and OC-48/STM-16; Fast Ethernet and Gigabit Ethernet for data networking; and ESCON, Fiber Connectivity (FICON), and Fibre Channel for storage networking. Wavelengths carrying disparate traffic types can be multiplexed together onto a single fiber pair providing multiservice transport. See Figure 1-1.
Figure 1-1 Cisco ONS 15530
The flexibility of the Cisco ONS 15530 and the variety of applications it is used in can make troubleshooting system problems difficult. This guide provides information on basic troubleshooting, various troubleshooting tools and diagnostics available, and specific symptom related troubleshooting procedures.
The general problem solving model, your network and system information, along with the numerous troubleshooting tools presented in this chapter, take much of the difficulty out of troubleshooting the Cisco ONS 15530.
1.2 General Model of Problem Solving
When troubleshooting the Cisco ONS 15530 in a network environment, define the specific symptoms, identify all potential problems that could be causing the symptoms, and then systematically eliminate each potential problem (from most likely to least likely) until the symptoms disappear.
Figure 1-2 illustrates the general problem-solving model. This process is not a rigid outline for troubleshooting. It is a foundation on which you can build a problem-solving process for your environment.
Figure 1-2 General Model of Problem Solving
The following steps detail the problem-solving process outlined in Figure 1-2:
Step 1
Step 2
Step 3
Step 4
Step 5
Step 6
Step 7
Step 8
Make sure that you undo anything you changed while implementing your action plan. Remember that you want to change only one variable at a time.
Note
1.3 Maintaining Network Information
Maintaining the following details about your system configuration and network helps with troubleshooting your system:
•
•
•
•
•
1.4 Network and System Management
This section describes the network management tools available for the Cisco ONS 15530.
CiscoWorks 2000 supports a suit of network management applications of which the following are supported on the Cisco ONS 15530:•
•
1.4.1 CiscoView
CiscoView is a device management application providing dynamic status, monitoring, and configuration information for a range of Cisco internetworking products including the Cisco ONS 15530. CiscoView displays a physical view of a device chassis, with color-coding of modules and ports for at-a-glance status. Monitoring capabilities display performance and other statistics. Configuration capabilities allow changes to devices if security privileges are granted.
Cisco ONS 15530 is supported by Embedded CiscoView and server based CiscoView. Online help for CiscoView is available for the server based CiscoView.
1.4.2 CTM
CTM (Cisco Transport Manager) is the EMS (element management system) for the Cisco ONS 15530. CTM provides standard fault, configuration, performance, and security management capabilities across the element and network management layers of the TMN (Telecommunications Management Network) reference architecture. The robust client/server-based platform easily scales to manage up to 100 simultaneous client (user) sessions and up to 1000 NEs (network elements).
1.4.3 DFM
DFM (Device Fault Manager) reports faults that occur on Cisco devices, often identifying fault conditions before users of network services realize that the condition exists. DFM analysis technology differs from the traditional rules-based approach to event analysis. DFM analysis uses a top-down approach that starts by identifying the fault conditions that affect managed systems. Because the event information necessary to diagnose fault conditions is present in the analysis model, DFM monitors only the events necessary to diagnose the condition. DFM can operate as an independent management system or can integrate with existing management applications to add fault management to the functionality already in place.
1.5 Third-Party Troubleshooting Tools
In many situations, third-party troubleshooting tools can be helpful. For example, attaching an optical analyzer to a network is less intrusive than using the debug commands, which are CPU switch module intensive.
Here are some typical third-party tools used for troubleshooting internetworks:
•
•
Note
•
•
•
•
•
•
1310 nm and five with 10 dB at 1310 nm, are a good start.•
•
1.6 Using General Diagnostic Commands
You can use the show, debug, ping, and traceroute commands to monitor and troubleshoot your internetwork.
1.6.1 show Commands
You can use the show commands to perform many functions such as the following:
•
•
•
•
•
Table 1-1 lists some of the most commonly used show commands:
For more information about show commands, refer to the Cisco ONS 15530 Command Reference and the
Cisco IOS Configuration Fundamentals Command Reference publication.1.6.2 debug Commands
The debug privileged EXEC commands provide information about the traffic on (or not seen) on an interface, error messages generated by nodes on the network, protocol-specific diagnostic packets and cells, and other useful troubleshooting data.
Caution
In many situations, third-party diagnostic tools can be more useful and less intrusive than using debug commands. See the "Third-Party Troubleshooting Tools" section.
1.6.3 ping Command
To check host reachability and network connectivity, use the ping user EXEC or privileged EXEC command. This command can be used to confirm basic network connectivity on IP networks.
For IP, the ping command sends ICMP (Internet Control Message Protocol) echo messages. If a station receives an ICMP echo message, it sends an ICMP echo reply message back to the source.
Using the extended command mode of the ping privileged EXEC command, you can specify the supported IP header options, which allow the Cisco ONS 15530 to perform a more extensive range of test options. To enter ping extended command mode, enter the ping command at the command prompt followed by a return.
To see how the command works under normal conditions, use the ping command when the network is functioning properly. When you are troubleshooting, you can then see the difference between normal and abnormal operation.
For detailed information about using the ping and extended ping commands, refer to the
Cisco IOS Configuration Fundamentals Command Reference publication.1.6.4 traceroute Command
The traceroute user EXEC command discovers the routes packets follow when traveling to their destinations. With the traceroute privileged EXEC command, the supported IP header options are specified, and the Cisco ONS 15530 can perform a more extensive range of test options.
The traceroute command works by using the error message generated by a Cisco ONS 15530 when a datagram exceeds its TTL (Time-To-Live) value. First, probe datagrams are sent with a TTL value of one. This causes the first Cisco ONS 15530 to discard the probe datagrams and send back
time exceedederror messages. The traceroute command then sends several probes, and displays the round-trip time for each. After every third probe, the TTL increases by one.Each outgoing packet can result in one of two error messages. A
time exceedederror message indicates that an intermediate Cisco ONS 15530 has seen and discarded the probe. Aport unreachableerror message indicates that the destination node has received the probe and discarded it because it could not deliver the packet to an application. If the timer goes off before a response comes in, the traceroute command displays an asterisk (*).The traceroute command terminates when the destination responds, when the maximum TTL is exceeded, or when the user interrupts the traceroute command with the escape sequence.
To see how the command works under normal conditions, use the traceroute command when the network is functioning properly. When you are troubleshooting, you can then see the difference between normal and abnormal operation.
For detailed information about using the traceroute command, refer to the Cisco ONS 15530 Configuration Guide. For additional information on using debug commands refer to the Cisco IOS Debug Command Reference.
1.7 Online Diagnostics
This section describes the online diagnostics available for troubleshooting your Cisco ONS 15530. Online diagnostics provide the following types of tests:
•
•
The Cisco ONS 15530 displays an error message on the console when it detects a hardware failure or problem.
Note
1.7.1 Accessibility Test
The accessibility tests ensure connectivity, at a configurable interval, between the following:
•
•
•
•
•
•
•
•
•
•
•
1.7.2 OIR Test
OIR tests check the functioning of the CPU switch module and interfaces on a per-port basis. The CPU switch module performs these tests when the system boots up and when you insert a module or motherboard into a slot. The OIR test sends a packet to the interface loopback and expects to receive it within a certain time period. If the packet does not reach the port within the expected time period, or the received packet is corrupted, an error is registered and the port is changed to an administratively down state. Packets that are 1000 bytes in size are used in the test.
1.8 Configuring Online Diagnostics
To configure online diagnostics, use the following global configuration commands:
Examples
The following example shows how to enable all online diagnostic tests:
Switch# diag onlineThe following example shows how to enable online diagnostic tests for the components in slot 3:
Switch# diag online slot 3The following example shows how to enable debugging for online diagnostics:
Switch# debug diag online1.8.1 Displaying the Online Diagnostics Configuration and Results
To display the online diagnostics configuration and results, use the following EXEC command:
show diag online [[detail | oir]| slot slot]
Displays information about the online diagnostic tests and the test results.
Example
The following example shows how to display detailed access test information:
Switch# show diag online---------------------------------------------------Online Diagnostics Current Summary Information~~~~~~~~~~~~~~~~~~~~~~~~~~~~~~~~~~~~~~~~~~~~~~On ACTIVE CPU card Slot: 5CPU Uptime: 1d02hSlot CardType Enabled Bootup/ Periodic PreviousInsertion Background Failurestests tests~~~~~~ ~~~~~~~~~~~~~~ ~~~~~~~ ~~~~~~~~~ ~~~~~~~~~~ ~~~~~~~~0/ 0/* PROTO-HAMPTONS-MUX Yes Disabled Pass No0/ 1/* PROTO-HAMPTONS-MUX Yes Disabled Pass No5/*/* 15530-CPU= Yes Disabled Pass No6/*/* 15530-CPU= Yes Disabled Pass NoExample
The following example shows how to display diagnostic test status and details:
Switch# show diag online details-----------------------------------------------------Online Diagnostics was DISABLED at 0 minutesThis information is the LAST status before disablingSpecific Slots maybe configured as enabled-----------------------------------------------------Online Diagnostics Detailed Information~~~~~~~~~~~~~~~~~~~~~~~~~~~~~~~~~~~~~~~On ACTIVE CPU card Slot: 5CPU Uptime: 1 day, 1 hour, 8 minutes___________________________________________________________________________Slot[0]Online Insertion TestsSlot CardType TestType Status LastRunTime LastFailTime~~~~~~ ~~~~~~~~~~~~~~ ~~~~~~~~~ ~~~~~~ ~~~~~~~~~~~ ~~~~~~~~~~~~~0/ 0/* PROTO-HAMPTONS-MUX idpromAcc Disabled nev nev0/ 1/* PROTO-HAMPTONS-MUX idpromAcc Disabled nev nevOnline Background TestsSlot CardType TestType Status LastRunTime LastFailTime~~~~~~ ~~~~~~~~~~~~~~ ~~~~~~~~~ ~~~~~~ ~~~~~~~~~~~ ~~~~~~~~~~~~~0/ 0/* PROTO-HAMPTONS-MUX idpromAcc Disabled nev nev0/ 1/* PROTO-HAMPTONS-MUX idpromAcc Disabled nev nev___________________________________________________________________________Slot[5]Online Insertion TestsSlot CardType TestType Status LastRunTime LastFailTime~~~~~~ ~~~~~~~~~~~~~~ ~~~~~~~~~ ~~~~~~ ~~~~~~~~~~~ ~~~~~~~~~~~~~5/*/* 15530-CPU= srcStatus Disabled nev nevIdpromAcc DisabledOnline Background TestsSlot CardType TestType Status LastRunTime LastFailTime~~~~~~ ~~~~~~~~~~~~~~ ~~~~~~~~~ ~~~~~~ ~~~~~~~~~~~ ~~~~~~~~~~~~~5/*/* 15530-CPU= srcStatus Disabled nev nevIdpromAcc Disabled___________________________________________________________________________Slot[6]Online Insertion TestsSlot CardType TestType Status LastRunTime LastFailTime~~~~~~ ~~~~~~~~~~~~~~ ~~~~~~~~~ ~~~~~~ ~~~~~~~~~~~ ~~~~~~~~~~~~~6/*/* 15530-CPU= srcStatus Disabled nev nevIdpromAcc DisabledOnline Background TestsSlot CardType TestType Status LastRunTime LastFailTime~~~~~~ ~~~~~~~~~~~~~~ ~~~~~~~~~ ~~~~~~ ~~~~~~~~~~~ ~~~~~~~~~~~~~6/*/* 15530-CPU= srcStatus Disabled nev nevIdpromAcc Disabled1.9 Power-On Diagnostics
Power-on diagnostics test the accessibility and basic functionality of the components and isolates the faults to FRU level on the Cisco ONS15530. All power-on diagnostic tests are enabled by default. All power-on diagnostic tests can be disabled and monitored by using the following commands.
Note
1.9.1 Configuring Power-On Diagnostics
All power-on diagnostic tests are enabled by default. To enable the power-on diagnostic tests, use the following global configuration commands in configuration mode, use the no form of the command to disable the power-on diagnostic tests:
Example
The following example shows how to enable all power-on diagnostic tests:
Switch(config)# diag power-onRefer to the Cisco ONS 15530 Command Reference for more information on the power-on diagnostic commands.
1.9.2 Displaying the Power-On Diagnostic Test Results
To display the power-on diagnostic test results, use the following EXEC command:
Example
The following example shows how to display the summarized power-on diagnostic results.
Switch# show diag power-on--------------------------------------------------------------------------------Power-on Diagnostics: Version 1.0System-wide result: PASSEDRan on: Mon Mar 13 2000 At: 03:45:13 UTC CPU was: Primary--------------------------------------------------------------------------------Slot/Subslot Card-type Result~~~~~~~~~~~~ ~~~~~~~~~ ~~~~~~0/1 mdx Passed1/* tsp1 Passed3/* itu2 Passed4/* tsp1 Passed6/* cpu Passed7/* tsp1 Passed8/* carrier-mb Passed8/0 oscm Passed8/1 oscm Passed9/* escon-10p Passed10/* tsp1 PassedExample
The following example shows how to display detailed access test information:
Switch# show diag power-on detail--------------------------------------------------------------------------------Power-on Diagnostics: Version 1.0System-wide result: FAILEDRan on: Mon Mar 13 2000 At: 03:45:13 UTC CPU was: Primary--------------------------------------------------------------------------------Subslot: 0/1 mdx Result: PassedH/w Ver: 1.0 FPGA func ver: N/A Versions compatible: N/ATest-name Result Cause-code~~~~~~~~~ ~~~~~~ ~~~~~~~~~~idprom Passed ---------------------------------------------------------------------------------Slot: 1/* tsp1 Result: PassedH/w Ver: 5.10 FPGA func ver: 3.12 Versions compatible: YesTest-name Result Cause-code~~~~~~~~~ ~~~~~~ ~~~~~~~~~~jtag-access Passed -lrc-access Passed -backplane-eth-lb Passed -aps-msg-int-bus Passed -hudjr-access Passed -hudjr-ingress-inter Passed -hudjr-ingress-serde Passed -hudjr-egress-intern Passed -hudjr-egress-serdes Passed ---------------------------------------------------------------------------------Slot: 3/* itu2 Result: PassedH/w Ver: 4.9 FPGA func ver: 2.31 Versions compatible: YesTest-name Result Cause-code~~~~~~~~~ ~~~~~~ ~~~~~~~~~~jtag-access Passed -lrc-access Passed -backplane-eth-lb Passed -aps-msg-int-bus Passed -component-access Passed -sii-memory Passed -qphy-fabric-lb Passed -om-fifo Passed ---------------------------------------------------------------------------------Slot: 4/* tsp1 Result: PassedH/w Ver: 5.8 FPGA func ver: 3.12 Versions compatible: YesTest-name Result Cause-code~~~~~~~~~ ~~~~~~ ~~~~~~~~~~jtag-access Passed -lrc-access Passed -backplane-eth-lb Passed -aps-msg-int-bus Passed -hudjr-access Passed -hudjr-ingress-inter Passed -hudjr-ingress-serde Passed -hudjr-egress-intern Passed -hudjr-egress-serdes Passed ---------------------------------------------------------------------------------Slot: 6/* cpu Result: FAILEDH/w Ver: 4.6 FPGA func ver: 1.43 Versions compatible: YesTest-name Result Cause-code~~~~~~~~~ ~~~~~~ ~~~~~~~~~~cpu-l1-cache Passed -cpu-l2-cache Passed -gt-pci0 Passed -iofpga-access Passed -nvram Passed -system-tod Passed -bootflash Passed -src-access Passed -src-timer Passed -sw-fabric-config Passed -bcom-sw-access Passed -bcom-sw-config Passed -gt-mii0-internal-lb Passed -gt-mii1-internal-lb Passed -gt-mpsc-internal-lb Passed -bp-idprom-test FAILED 1power-supply0 FAILED 3power-supply1 Passed -temp-sensor Passed -gt-interrupt Passed -interrupt0 Passed -interrupt2 Passed -interrupt3 Passed -interrupt7 Passed -interrupt8 Passed ---------------------------------------------------------------------------------Slot: 7/* tsp1 Result: PassedH/w Ver: 5.8 FPGA func ver: 3.12 Versions compatible: YesTest-name Result Cause-code~~~~~~~~~ ~~~~~~ ~~~~~~~~~~jtag-access Passed -lrc-access Passed -backplane-eth-lb Passed -aps-msg-int-bus Passed -hudjr-access Passed -hudjr-ingress-inter Passed -hudjr-ingress-serde Passed -hudjr-egress-intern Passed -hudjr-egress-serdes Passed ---------------------------------------------------------------------------------Slot: 8/* carrier-mb Result: PassedH/w Ver: 4.2 FPGA func ver: 1.37 Versions compatible: YesTest-name Result Cause-code~~~~~~~~~ ~~~~~~ ~~~~~~~~~~jtag-access Passed -lrc-access Passed -backplane-eth-lb Passed -aps-msg-int-bus Passed ---------------------------------------------------------------------------------Subslot: 8/0 oscm Result: PassedTest-name Result Cause-code~~~~~~~~~ ~~~~~~ ~~~~~~~~~~hudjr-access Passed -idprom Passed -hudjr-internal-lb Passed -serdes-lb Passed ---------------------------------------------------------------------------------Subslot: 8/1 oscm Result: PassedTest-name Result Cause-code~~~~~~~~~ ~~~~~~ ~~~~~~~~~~hudjr-access Passed -idprom Passed -hudjr-internal-lb Passed -serdes-lb Passed ---------------------------------------------------------------------------------Slot: 9/* escon-10p Result: PassedH/w Ver: 3.4 FPGA func ver: 2.36 Versions compatible: YesTest-name Result Cause-code~~~~~~~~~ ~~~~~~ ~~~~~~~~~~jtag-access Passed -lrc-access Passed -backplane-eth-lb Passed -aps-msg-int-bus Passed -component-access Passed -encap-lb Passed -qphy-lb Passed -fabric-lb Passed ---------------------------------------------------------------------------------Slot: 10/* tsp1 Result: PassedH/w Ver: 5.9 FPGA func ver: 3.12 Versions compatible: YesTest-name Result Cause-code~~~~~~~~~ ~~~~~~ ~~~~~~~~~~jtag-access Passed -lrc-access Passed -backplane-eth-lb Passed -aps-msg-int-bus Passed -hudjr-access Passed -hudjr-ingress-inter Passed -hudjr-ingress-serde Passed -hudjr-egress-intern Passed -hudjr-egress-serdes Passed ---------------------------------------------------------------------------------Example
The following example shows how to display detailed test information for a specific slot:
Switch# show diag power-on slot 5Power-on Diagnostics:Version 1.0System-wide result:PassedRan on:Fri Dec 13 2002 At:22:29:11 UTC CPU was:Primary--------------------------------------------------------------------------------Slot:5/* cpu Result:PassedH/w Ver:6.1 FPGA func ver:1.43 Versions compatible:YesTest-name Result Cause-code~~~~~~~~ ~~~~~~ ~~~~~~~~~~cpu-l1-cache Passed -cpu-l2-cache Passed -gt-pci0 Passed -iofpga-access Passed -nvram Passed -system-tod Passed -bootflash Passed -src-access Passed -src-timer Passed -sw-fabric-config Passed -bcom-sw-access Passed -bcom-sw-config Passed -gt-mii0-internal-lb Passed -gt-mii1-internal-lb Passed -gt-mpsc-internal-lb Passed -bp-idprom-test Passed -power-supply0 Passed -power-supply1 N/A -temp-sensor Passed -gt-interrupt Passed -interrupt0 Passed -interrupt2 Passed -interrupt3 Passed -interrupt7 Passed -interrupt8 Passed ---------------------------------------------------------------------------------1.10 Checking Release Notes for Workarounds
There are two methods you can use to check for Cisco IOS software bugs (defect tracking tool numbers [DDTs]) in your version of the Cisco IOS software. You can use the Bug Navigator II or check the release notes. Often, your problems with the Cisco ONS 15530 have been fixed or a workaround has been determined in a more recent version of software.
1.10.1 Using Bug Toolkit
Bug Toolkit is a tool to search for known bugs based on software version, feature set, and keywords. The resulting matrix shows when each bug was integrated, or fixed if applicable.
You can access Bug Navigator II on the World Wide Web at http://www.cisco.com/cgi-bin/Support/Bugtool/launch_bugtool.pl. Then follow these steps:
Step 1
Step 2
Step 3
Step 4
•
•
•
Note
Step 5
The entire window is replaced with a Bug Search Results window with a list of DDTS containing your search criteria. Look at the Bug reports listed in the titles column. An existing bug entry that describes the problem you are having may have been fixed in a more recent version of the Cisco IOS software. Look in the Fixed-in column for a later version of the Cisco IOS software. All you might have to do to solve your problem is upgrade your software.
If a software upgrade is not listed as a way to solve your problem, double-click on the bug title and read the DDTS details; a workaround might be listed there.
1.10.2 Checking Cisco IOS Release Notes
Release notes describe the features and caveats for Cisco IOS software releases. The release notes are listed by both product and Cisco IOS release number.
The "Caveats" section of the release notes lists known caveats by tracking the DDTS number and the release number, and indicates whether the caveat has been corrected.
The "Caveat Symptoms and Workarounds" section summarizes caveat symptoms and suggested workarounds. You can also search through this section online, using either a word string or the DDTS number.
1.11 Initial Troubleshooting Checklist
Before you start the troubleshooting process, confirm that the network and client connections were designed correctly using the information in the Cisco ONS 15530 Planning Guide and the interfaces were configured correctly using the information in the Cisco ONS 15530 Configuration Guide and the Cisco ONS 15530 Command Reference.
Next confirm the integrity of the hardware and its installation by performing the following:
•
•
•
•
•
•
![]()
![]()
![]()
![]()
![]()
![]()
![]()
![]()
Posted: Mon Apr 30 14:56:57 PDT 2007
All contents are Copyright © 1992--2007 Cisco Systems, Inc. All rights reserved.
Important Notices and Privacy Statement.