|
|

This chapter explains how to monitor the Catalyst 3000 using Out-of-band ("outside" of the network) management, through a directly connected console. To use SNMP (in-band, "through the network" management), see Chapter 9, "Monitoring Port Activity with Application Software."
This chapter covers the following topics:
The information on the screens in this chapter is typically for monitoring purposes only. This information is usually the result of input data from the configuration menus (see Chapter 7, "Console Configuration." The specifications presented on the Statistic Screens normally can not be modified.
Information within the Statistics menus are updated (screens are refreshed) every 5 seconds.
This section explains how to access the menus and the following section describes the information and sub-menus of the Statistics Menu.
Unless specified differently, all the screens or menus are accessed in the following way: use the ARROW keys (also referred to as cursor keys) to move the highlight over the selections that you want to access, and then press the RETURN key:
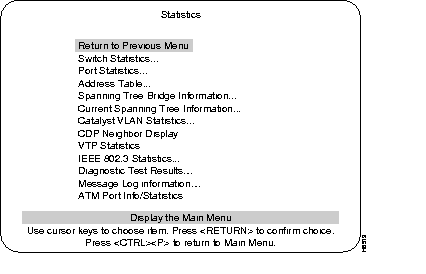
The following is a brief explanation of menu headings in the Statistics screen. More information about these menus, their screens, and sub-menus, follows this list.
Select a heading, at the console, to view the corresponding menu.
Displays information about switch utilization.
Displays information about a particular port.
Port and system address tables.
Displays information about the current Spanning Tree configuration.
Displays the current Spanning Tree port information.
An explanation of Catalyst VLANs is in the Spanning Tree Protocol (STP) section in Chapter 7, "Console Configuration."
An explanation of Cisco Discovery Protocol (CDP) is in the Spanning Tree Protocol (STP) section in Chapter 7, "Console Configuration."
An explanation of VTP is in the section Spanning Tree Protocol (STP) (VTP) in Chapter 7, "Console Configuration."
Displays transmission error information for individual ports.
Displays a screen showing results of diagnostic tests and any errors that might have occurred during diagnostics.
Displays any messages recorded by the system.
An explanation of ATM is in the Spanning Tree Protocol (STP) section in Chapter 7, "Console Configuration."
The Switch Statistics screen shows statistics and information about stations connected to the Catalyst 3000.
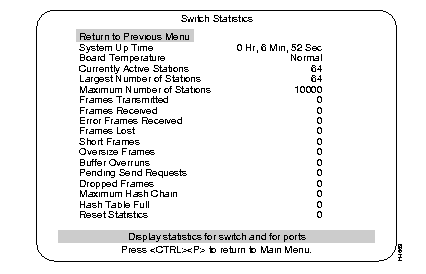
Pertains to the Catalyst 3000 with that Box number when the Catalyst 3000 is part of a stack.
Length of time since the last reset or power cycle.
Indicates whether the Catalyst 3000 is operating at normal or unacceptably high (over 122°F or 50°C) temperatures.
Number of entries in the address table, representing the number of currently active stations (MAC addresses), or nodes, on all ports of the Catalyst 3000.
The most stations (MAC addresses) ever active on all ports at one time since the last reset or power cycle.
This is the most stations (MAC addresses) the Catalyst 3000 can support simultaneously. This is different from the Maximum Number of Stations value that appears in the Port Statistics Menu, which is the number of addresses for a specific port. The amount of DRAM memory installed determines the maximum amount:
Each of the following headings has an associated numerical value that is presented on the same line and to right of the heading on the screen.
This value is the number of times there has been an occurrence of that particular heading within the CPU of the Catalyst 3000.
Use the Port Statistics screen to view detailed information about a particular port.
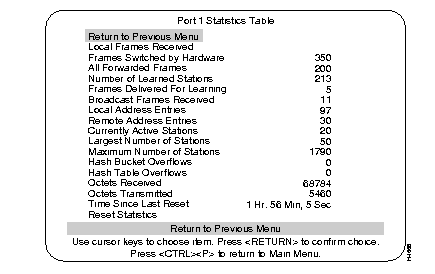
Number of frames that are local to this segment (not forwarded).
Number of frames received on this port and forwarded by the Catalyst 3000 hardware to another port.
Number of broadcast, multicast, and unicast frames switched by the hardware or forwarded by the software.
Number of stations that frames were received for, and then forwarded to the system module for processing, because the source or destination station address was not in the port's forwarding table.
Number of frames received on this port and forwarded to the system module for processing. For example: frames for which the address was unknown, PING frames, or SNMP traffic.
Number of Broadcast frames received on this port.
Number of MAC addresses on this port that belong to the local segment.
Number of MAC addresses on this port that belong to another segment.
Sum of local and remote MAC addresses on this port.
Largest number of MAC addresses active since the last reset of the Catalyst 3000 or port.
Maximum number of MAC addresses that the port can support simultaneously.
Informational results of hashing. Used for technical system evaluation and troubleshooting.
Informational results of octet handling. Used for technical system evaluation and troubleshooting.
Hours, minutes, and seconds since the port traffic counters were last reset.
Resets the traffic counters for this port.
Use the Address Table menu to select which address table statistics you want to view.
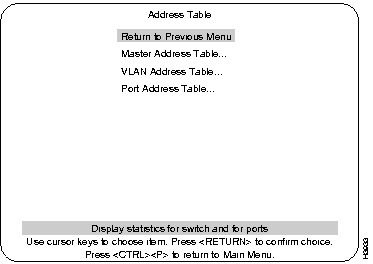
The following list contains brief explanations of the menus for the Address Table screen. More information on each of these menus, their screens, and submenus follows this list.
Displays a table of station addresses from all ports known to the Catalyst 3000.
Displays the VLAN address table for all ports in a VLAN.
Displays the address table for a selected port.
The Master Address Table contains MAC addresses of all ports known to the Catalyst 3000. The table can contain up to 6,000 entries with standard memory, or up to 10,000 entries with optional expanded memory.
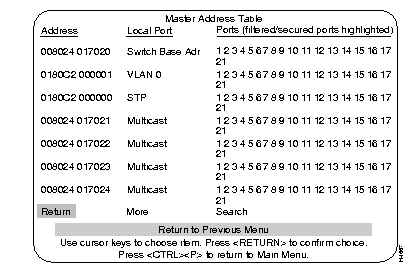
Describes the type of address or association of the address with the listed port:
The ports whose address tables include this MAC address; filtered ports are highlighted.
Refreshes a one-page table or displays subsequent entries on a larger table.
Prompts you to enter the MAC address of a node and the ports whose address tables you want to search, then displays the ports whose address tables contain the MAC address.
The VLAN Address Table contains MAC addresses of all ports known to the Catalyst 3000 within a selected VLAN.
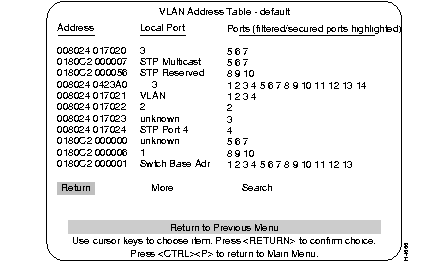
Describes the type of address or association of the address with the listed port:
The ports whose address tables include this MAC address; filtered ports are highlighted.
Refreshes a one-page table or displays subsequent entries on a larger table.
Prompts you to enter the MAC address of a node you want to search. The address table display is refreshed starting from the matching address entry.
The Port Address Table displays the MAC addresses of nodes connected to a specific port. The table includes MAC addresses from which this port has received packets or octets, to which it has sent packets or octets. It can contain up to 1,700 entries.
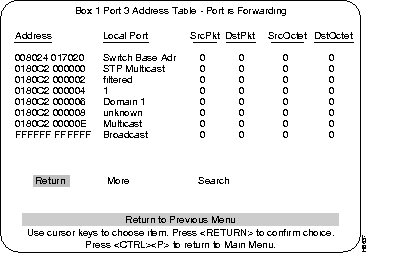
MAC address of a node. Ports that belong to an EtherChannel are designated as either primary or secondary.
Describes the association of the address with the listed port or the type of address:
Number of packets received and transmitted.
Number of octets received and transmitted.
Refreshes a one-page table or displays subsequent entries on a larger table.
Prompts you to enter the MAC address of a node you want to search. The address table display is then refreshed starting from the matching address entry.
The Spanning Tree Bridge Information screen is displayed from the main Statistics menu. Its information relates to the Spanning tree configuration. The settings on this screen cannot be changed.
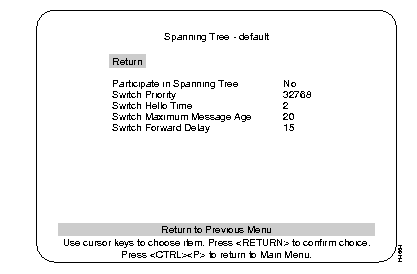
Whether the Catalyst 3000 is participating in the Spanning Tree.
The priority value for this Catalyst 3000. The Catalyst 3000 with the lowest priority value in a Spanning Tree becomes the root bridge.
The time, in seconds, between configuration messages when this switch is root.
The maximum message age advertised when this switch is root.
The time, in seconds, the switch waits between transitions from listening to learning, and from learning to forwarding.
Use the Current Spanning Tree Information screen to view a summary of all Spanning Tree information for each port. Information cannot be changed on this screen. When the Spanning Tree is turned off--that is, you have selected No for the "Participate in Spanning Tree" prompt (at the Configuration menus)--this menu will only display the headers with no information below them.
When the Catalyst 3000 is configured with EtherChannels, Spanning Tree Hello packets use the primary port of the EtherChannel.
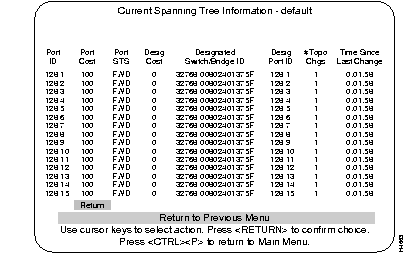
The port ID, used to determine the role of the port in the Spanning Tree. The port ID is expressed in the form <port priority>.<port number>. All ports in an EtherChannel have the same ID number.
The Port Path Cost for each port on the switch. The Port Path Cost helps determine the role of the port in the Spanning Tree network.
Current state of this port within the Spanning Tree: DSB (disabled), BLK (blocked), LSN (listening), LRN (learning), FWD (forwarding), or Link Down.
DSB - the port has been manually disabled or failed to pass diagnostics.
BLK - the port receives STP BPDUs, but will not forward any packets.
LSN - STP perceives that the port should no longer be blocked because of some topology change. It transmits BPDUs, but forwards no packets.
LRN - if after transmitting BPDUs for a set amount of Forward Delay seconds, no contradictory information is learned, the port address table is cleared and addresses begin to be learned and then forwarding begins. All ports that are going to change states from blocking to forwarding will have done so after:
FWD - port begins forwarding packets normally.
Link Down - see the next section, "Virtual Switch Statistics Menu," for Link Down information.
The rules that define the state of the port are as follows:
The cost for a packet to travel from this port to the root in the current Spanning Tree configuration. The slower the media, the higher the cost.
Priority and MAC address of the device through which this port has determined it must communicate with the root of the Spanning Tree.
Port on the designated device through which this switch will communicate with the root of the Spanning Tree. This information is useful if the Catalyst 3000 is the designated bridge on one or more network segments. (Port ID is <port priority>.<port number>.)
Number of topology changes, which is the number of times the port has entered the forwarding state plus the number of times the port has made the transition from forwarding to blocking. The counter is reset when the switch is reset or the Spanning Tree is turned on: whichever is most recent.
The time since the last time the port entered the forwarding state or made the transition from forwarding to blocking.
Use the Virtual Switch Statistics menu to view the current number, largest number, and maximum number of MAC address entries in the master address table for the selected VLAN.
This screen shows the default VLAN when no other VLANs are selected.
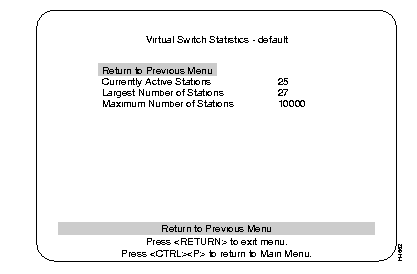
Number of MAC addresses currently in the master address table that are recognized as ports belonging to this VLAN.
Largest number of MAC addresses in the master address table--since the last reset or power cycle--that are recognized by ports belonging to this VLAN.
Maximum number of MAC addresses available in the Master Address Table.
The IEEE 802.3 Statistics screen displays the statistics associated with the Ethernet MIB (RFC1643).
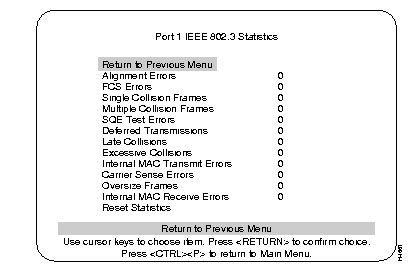
The IEEE 802.3 Statistics Screen is a list showing specific errors that have occurred at a specified port. The port is selected by highlighting the IEEE 802.3 heading at the main Statistics menu and pressing RETURN. At the following prompt: Enter a port number: enter the port number you want to view. The IEEE 802.3 Statistics screen, as shown above, appears.
The data shown on this screen is for monitoring statistical information only, and is meant for network personnel experienced with this type of information. The explanation of this information is extensive and therefore would not be appropriate for a user guide. However, the instructions on how to access this information are provided so that the user can view the data to provide information for problem solving. If excessive errors are being reported and you can not find a cause, contact the Cisco Technical Assistance Center (TAC).
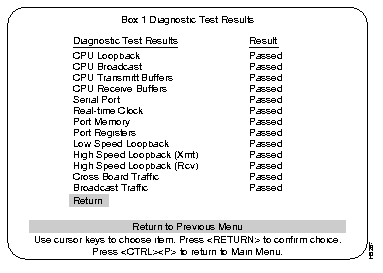
The Diagnostic Test Results screen is a list showing whether errors or a specific diagnostic test has failed on a switch or a specified box (switch) when it is part of a Stack. This display is selected by highlighting the Diagnostic Test Result heading at the main Statistics menu and pressing RETURN. At the prompt, enter the box number you want to view.
The data that is shown on this screen is for monitoring information only, and is meant for network personnel experienced with this type of information. The explanation of this information is extensive and therefore would not be appropriate for this guide. However, the instructions on how to access this information are provided so that the user can view the data to provide information for problem solving. If this menu is reporting errors and you can not find a cause, contact Cisco Support.
|
|