|
|

Table Of Contents
When to View Events and Log Files
Historical Database Event Data
Retrieving Historical Event Data
Creating a File Type Association
Event Management
Intelligent Contact Management software tracks events for processes and applications running in the system. An event is any significant occurrence within the ICM system that you might want to know about. Events are recorded on a local and system-wide basis to aid you in maintaining the ICM system.
This chapter provides an overview of event logging and management in the ICM system. It also describes how to use the ICM's event viewing tool.
Overview
Intelligent Contact Management software is a distributed call routing system with components that span several networks. The major components of ICM software generate event data that can be useful in troubleshooting and maintaining the system.
The ICM Event Management System (EMS) logs events from processes throughout the system and stores the event data in the central database. For example, a typical EMS event might record that a system component has been disconnected.
The EMS also saves events from individual processes in per-process log files on the local computer. These files document events for a specific process running on a specific computer.
Several components and processes log events through the EMS:
•
Peripheral Gateways
•
•
•
These ICM components are critical to the effective routing of calls in the ICM system. As a system administrator, you need to be informed almost immediately when significant events occur on these components. Admin Workstations also log EMS events, but only to the NT Application event log. This is because Admin Workstations are not as critical to call routing as the other components of ICM software.
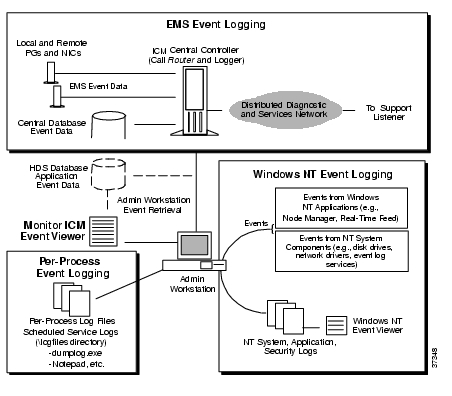
Figure 7-1 summarizes how EMS logs events.
Figure 7-1 Event Logging Overview
As shown in Figure 7-1, event logging in the ICM system involves central and remote system components. The Event Management System (EMS) enables ICM components and the processes that run on them to report events back to the Central Controller. The Central Controller then forwards the events to the Logger for storage in the central database. If the Historical Data Server (HDS) option used, events are also forwarded to the HDS database on the Distributor AW. Some of these EMS events are also forwarded to the Customer Support Center Listener process by the Distributed Diagnostic and Services Network (DDSN).
The DDSN and Listener are described in Chapter 8, "Support Facilities."
ICM software classifies events based on their severity. Table 7-1 lists the severity levels for ICM events.
Trace events are stored in log files, but not in the ICM database.
Event Data Storage
Table 7-2 summarizes the types of events stored in different locations.
All computers that have SQL Server also contain SQL Server transaction log files. These files are found under the SQL installation directory on individual computers. You can examine the transaction logs using a standard text editing tool such as Notepad.
For more information on SQL Server log files, see the Microsoft SQL Server System Administrator's Guide.
Event Viewing Tools
Viewing event data in the ICM system requires that you use different tools to view the event data that reside in different parts of the system.
You can use the following tools to view event data:
•
•
•
•
When to View Events and Log Files
The following guidelines apply to examining the different types of event data collected by the ICM system:
•
•
•
Historical Database Event Data
The EMS event data can give you a good idea of activity throughout the ICM system. You can retrieve this data on demand at any Admin Workstation by using the Monitor ICM Event Viewer.
Note
Purging the Event Data
The EMS event data is stored in the Application_Event and Event tables of the central or HDS database until the data are purged. When you set up the ICM Logger and the HDS machine, you can specify the number of days for which these data are maintained.
For more information on data retention in the central and HDS databases, see Chapter 4, "Database Sizing."
Viewing the Event Data
Monitor ICM provides an Event Monitor and an Event Viewer to help you manage events in the ICM system. The Event Monitor is a simple counter that counts, in real-time, the number of EMS events being logged to the central or HDS database. The Event Viewer is a tool that allows you to retrieve event data from the database and display it at the Admin Workstation. Once the data is displayed, it can be sorted, filtered, printed, or exported in any of several file formats.
For a Limited AW, the Event Monitor and Event Viewer take information from the Application_Event table. In other environments, they take information from the Event table.
Event Monitor
The Event Monitor appears each time you start Monitor ICM. It allows you to see how many events of each severity (error, warning, and informational) are occurring in the system. Each time an event is logged at the central database, the real-time feed signals the Distributor Admin Workstation and one of the counts is incremented. If the Real-Time Client or Distributor processes are inactive, these counts are not incremented.
You can clear the Event Monitor counts by clicking on the colors. You can close the Event Monitor by choosing Close from the Event Monitor Control menu. Once the Event Monitor is closed, you can redisplay it by choosing View > Event Monitor from the Monitor ICM menu.
The Cisco ICM Software Supervisor Guide provides more details on using the Event Monitor.
Event Viewer
The Monitor ICM Event Viewer allows you to view the event data that is stored in the central database. These data include EMS-generated events that indicate potential hardware, application, or communications problems within the ICM system. ICM software records the specific process that generated the event and provides other details that can help you pinpoint the cause of the problem.
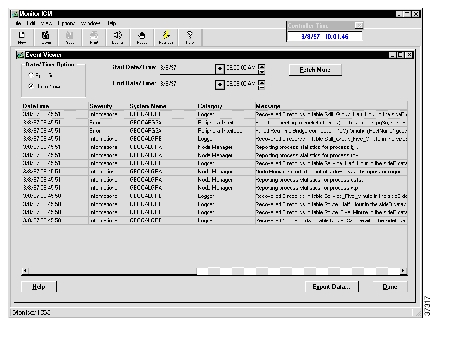
To display the Event Viewer:
Start Monitor ICM by double-clicking the Monitor ICM icon in the Admin Workstation group.Click the Events button or choose View >Event Viewer. The Event Viewer window appears:
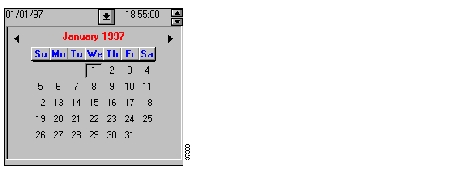
On initial display, the Event Viewer displays the most recent event data. If you need to see earlier event data, specify your own start and end dates and times by using the Specified option.
For information on retrieving data from an earlier time period, see " Retrieving Historical Event Data," later in this chapter.
Table 7-3 lists the categories of events shown in the Monitor ICM Event Viewer.
Note
Event Indication
The Event Monitor remains open while you view event data in the Event Viewer. It continues incrementing the counts as new events are received at the central database. Counts are incremented only for those events that meet the current event filter settings. Other event data might also be accumulating in the central database, but this accumulation is not indicated through the Event Monitor.
For more information on filtering event data, see " Filtering Events," later in this chapter.
The Fetch More button is disabled as long as no new events are being logged to the central database. When the Fetch More button becomes enabled, it indicates that new events have been logged. You can retrieve this new event data by clicking the Fetch More button.
Retrieving Historical Event Data
You may want to view events that took place earlier in the day or on previous days. Remember that only events that match the event filter settings are retrieved from the ICM central database. To retrieve other events, you must set the event filter appropriately.
For information on the event filter settings, see " Filtering Events," later in this chapter.
To retrieve historical event data:
Step 1
Step 2
Step 3
Step 4
Step 5
Step 6
Step 7
Step 8
Step 9
Note
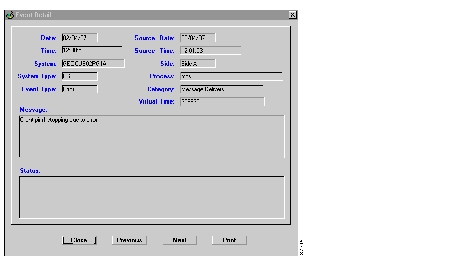
Viewing Event Details
Once you have a list of events displayed, you can choose an event entry and get more detailed information such as the specific process that generated the event.
To view more details about an event:
Step 1
Step 2
Step 3
Step 4
Filtering Events
Monitor ICM allows you to filter events so that only specific event types are displayed in the Event Viewer and counted by the Event Monitor. Event data for the entire ICM system is still logged to the central database, but only event data that meets the event filter criteria is displayed at the Admin Workstation.
For example, you might set the event filter to display only errors and warnings that are associated with the Logger. These filter settings would exclude any event data from processes in the ICM system other than the Logger. In addition, only errors and warnings would be counted in the Event Monitor. The informational event counter would not be incremented.
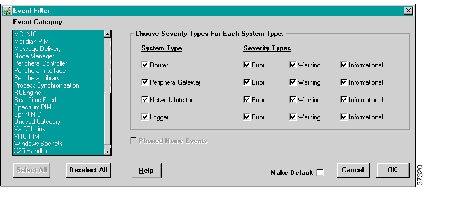
To set the Event Filter:
Step 1
By default, the Event Monitor and the Event Viewer display events for all processes in the ICM system and for all three severity levels. However, you can choose your own event filter options and set them as the default.
Step 2
Step 3
Events are displayed for the categories, system types, and severity levels you select. Items that are not selected are excluded from the Event Viewer and from the Event Monitor. Events for the items that are not selected are still logged to the central database, but they are not displayed at the Admin Workstation.
The filter settings remain in effect only for the current Event Viewer session. Optionally, you can save the settings and make them the new default.
To make the current filter settings the default:
Click the Make Default check box. The filter settings remain set for subsequent Monitor ICM sessions until you change them again.
Sorting Events
The Event Viewer provides several options for sorting events once they are displayed. The sorting options help you further organize the list of events. By default, events are sorted first according to the time they were received at the ICM central controller. The most recent events are listed at the top of the list followed by older events.
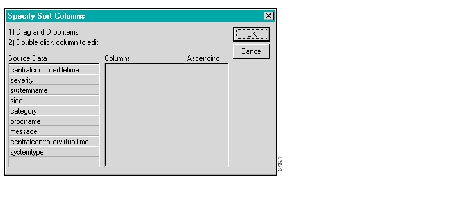
To sort events in the Event Viewer:
Step 1
Step 2
Step 3
Step 4
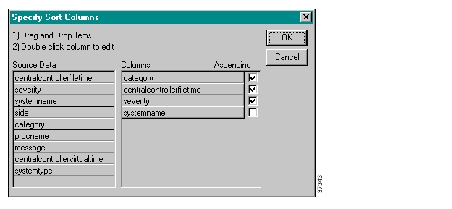
Note
The Ascending sort order check box is selected by default for all sorting options. If you want Descending sort order, you can deselect the Ascending checkbox:
If required, you can edit individual column expressions to change how they sort data. If you double-click on a column name in the Columns box, the Modify Expression Dialog box appears. Typically, you do not need to modify any of the column expressions.
Exporting Event Data
Monitor ICM supports data export to several file formats. You can export the event data in a format for use in another application or simply save the data in a text file format. You can also use the export feature to record specific events that you want to distribute to the Customer Support Center (CSC).
For more information on using event data and forwarding files to the Customer Support Center, see Chapter 8, "Support Facilities."
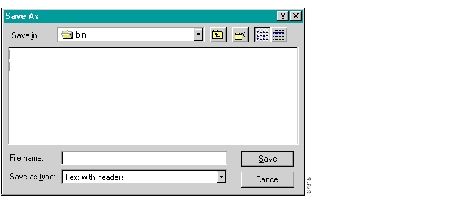
To export event data:
Monitor ICM saves all the data displayed in the Event Viewer columns. Be sure to filter out any event data that you do not need; otherwise, you may create a file that is too large to be viewed using a standard text editor.
Step 1
Step 2
Step 3
Step 4
Step 5
Step 6
Step 7
Note
Windows NT Event Logs
Each Windows NT computer logs NT events to its own local NT System, Application, and Security event logs. You can view NT event data through the Windows NT Event Viewer (on the local computer or from a remote computer). Windows NT computers include CallRouters, Loggers, PGs, and Admin Workstations. Windows NT does not track events for DOS-based NICs.
All EMS events that are logged to the central database with an Error or Warning severity level are also logged to the local computer's Windows NT Application Event Log. This ensures that ICM events are logged at the source and can be viewed locally through the NT Event Viewer.
NT Event Log Settings
ICM software requires the NT Event Log settings shown in Table 7-4.
Table 7-4 NT Event Log Settings
Application
1024K
Overwrite as Needed
System
1024K
Overwrite Events Older than 7 days
Security
1024K
Overwrite Events Older than 7 days
These values ensure that none of the logs becomes full. The 1024K setting ensures that large log files can be accommodated in any of the logs. The Application log must overwrite events as needed because it logs EMS Errors and Warnings, NT application events, and SQL Server events. If it could not overwrite events, the Application log could quickly become full.
Viewing the NT Event Logs
The Microsoft Windows NT Event Viewer allows you to view and manage events on a system-by-system basis. You can use the NT Event Viewer to isolate problems on specific computers. Typically, you first check for unusual event activity in the system by using the Monitor ICM Event Viewer. Once you identify an individual computer as generating errors, you can use the Windows NT Event Viewer to view the computer's local NT event data. All EMS-generated Error and Warning events are logged to the local computer's Windows NT Application Event Log.
The Windows NT event logging process starts automatically each time a Windows NT system is started. At an Admin Workstation, you can use the NT Event Viewer to view event data for that computer or for other locally connected computers. For example, you might select a PG or a Logger and view the NT event data for those computers.
Note
To start the Windows NT Event Viewer:
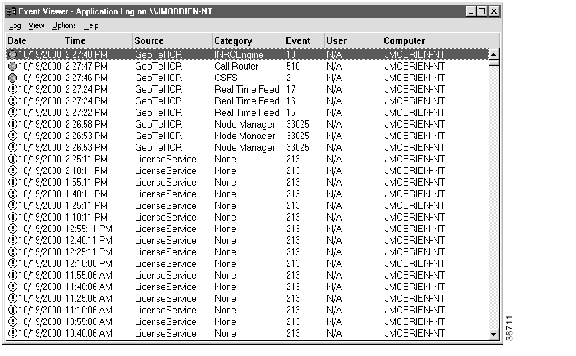
In the Administrative Tools group in the Windows NT Program Manager, double-click the Event Viewer icon. The Event Viewer window is displayed:
You can change to different logs (for example, the Application, System, or Security logs) by choosing Options from the Log menu.
Windows NT Logs and Event Types
You can choose between three different logs, depending on the type of event data you want to view. You can view these log files for any Windows NT computer. The Application log is typically the most useful log since it contains ICM-related events.
•
•
•
The event types in the Windows NT Event Viewer (Error, Warning, and Informational) have similar meanings to those listed earlier in Figure 7-1. The NT Event Viewer provides two additional event types related to system security:
•
•
For more information on the NT Event Viewer, see the Microsoft Windows NT System Guide.
Viewing Event Data from Other Systems
When you first start the Windows NT Event Viewer, event data for the local computer is displayed. However, you can connect to another computer in the local network (for example, a Peripheral Gateway) in order to examine its event data.
Note
To connect to another computer:
Step 1
Step 2
Step 3
Per-Process Log Files
The per-process EMS log files are stored in the ICM component \logfiles directory on the local computer as well as forwarded to the central database. For example, per-process log files on Admin Workstations are stored in the aw\logfiles directory. EMS log files have the suffix .ems.
The \logfiles directory also contains command log files (.log), which document how commands such as printrpt executed. For information on these files, see the section, " Command Logs," later in this chapter.
Purging the Log Files
The purgeold command deletes old per-process log files. ICM software automatically schedules purgeold to run nightly and delete any log files more than 30 days old. This ensures that log files do not accumulate and take up too much disk space.
Not all log files are deleted; only those files or entries that are older than 30 days. This ensures that at least 30 days of data are kept on-line.
The setpurge command allows you to change the 30 day default. For example, the following command entered at the Command Prompt makes the purgelog job purge files that are older than 20 days:
setpurge 20
Note
Naming Conventions
Each per-process log file has a prefix that indicates the process within ICM that generated the event. Each file name includes the date and time the log was created. All log files end with an .ems file extension.
Table 7-5 lists the process names and prefixes and provides brief descriptions of each process. The following example shows the format of a log file name:
PPP_YYMMDD_HHMMSS.ems
The PPP is a prefix that indicates the process. For example, the following log file is for the real-time distributor process. It was created on February 8, 1996 at 9:48:39 A.M.
rtd_960208_094839.ems
The timestamp on a log file is in 24-hour format. For example, 3:00 P.M. is indicated as 15:00; 9:00 A.M is indicated as 09:00.
Sample File
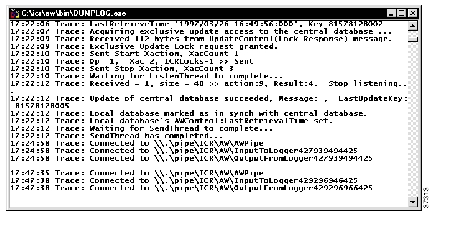
The EMS creates a new log file each time a process initializes. This means that messages documenting the end of a process can always be found at the end of a log file; messages documenting the initialization of a process can always be found at the beginning of the log file.
The following is an example of a typical per-process log file:
Viewing Per-Process Log Files
You can view per-process log files by using the dumplog.exe command. The dumplog.exe command reads the file, formats the event data, and writes the formatted data to the workstation screen. You can also redirect output to a file using either the /o or /of arguments.
To view per-process log files:
Step 1
Step 2
You have several options for viewing log files. The most common option is to display the most recent events for a process on the screen.
To display today's events on the screen, type:
dumplog rtr
This command displays all of today's CallRouter (rtr) events. You can specify any process prefix. You can build on this basic dumplog command by adding date and time arguments.
To dump events for a specific day:
dumplog rtr /bd 1/15/97
This command displays all rtr information that was logged on January 15, 1997 (the begin date, /bd). To see more than one day's log, use the end date (/ed) argument.
The complete syntax for the dumplog command is as follows:
dumplog [ProcessName(s)] [/dir Dirs] [/if InputFile] [/o] [/of OutputFile] [/c] [/bd BeginDate(mm/dd/yyyy)] [/bt BeginTime(hh:mm:ss)] [/ed EndDate(mm/dd/yyyy)] [/et EndTime(hh:mm:ss)] [/hr HoursBack] [/all] [/last] [/prev] [bin] [/m MatchString] [/x ExcludeString] [/ms] [/debug] [/help] [?]
The specific parameters are shown in Table 7-6.
Table 7-6 Dumplog Parameters
ProcessName(s)
Specifies a process prefix from Table 7-5. The command dumps the current day's log for that process, unless you specify different dates or times with other arguments.
[/dir Dirs] Directory
Specifies the location of the log files for any processes listed on the command line after the /dir switch. If no /dir switch is used, the current directory is used by default.
[/if] InputFile
Specifies a specific .ems file to dump. The /if token is optional. If you specify an input file, the /bd, /bt, /ed, /et, /hr, and /all arguments are ignored.
/o
Writes output to a text file in the \logfiles directory. The filename is formed by adding the .txt suffix to the specified process prefix or input file name (without the .ems suffix). The file is written to the current directory.
/of OutputFile
Specifies an output text file; for example, c:\temp\mylog.txt.
/c
Specifies continuous output. The command does not exit after reaching the end of the log. Instead, it waits and writes any further any entries that appear in the log.
/bd BeginDate(mm/dd/yyyy)
Specifies the begin date. If specified with /bt, this specifies a range of dates. Otherwise, dumplog dumps events for only the specified date.
/bt BeginTime(hh:mm:ss)
Specifies the begin time. Use with /et to specify a range of time.
/ed EndDate(mm/dd/yyyy)
Specifies the end date. Use with /bd to specify a range of days.
/et EndTime(hh:mm:ss)
Specifies the end time. Use with /bt to specify a range of time.
/hr HoursBack
Specifies a number of hours back from the current time.
/all
Displays all information from the specified process's log files.
/last
Displays information from the most recent log file for the process.
/prev
Displays information from the next to last log file for the process.
/m MatchString
Displays only events that contain a match for the specified string.
/x ExcludeString
Displays only events that do not contain a match for the specified string.
[/ms]
Displays milliseconds in time stamps.
[/mc]
Use multiple colors when dumping merged logs. Each process is given a different color.
You must specify either a ProcessPrefix or an InputFile. If you give only a ProcessPrefix value (for example, rtr, nm, or lgr), dumplog displays the current day's log for that process by default.
To view redirected log files through Notepad:
If you save the log file to a text file (using the dumplog /of argument), you can open the text file from the command prompt by typing:
notepad filename
You can also print the file or include it in an E-mail message. To deliver a log file to the Customer Service Center, save it as a text file and place it in the Logger's export directory. The Distributed Diagnostic and Service Network (DDSN) automatically delivers the file to Customer Support.
For more information on the DDSN, see Chapter 8, "Support Facilities."
Creating a File Type Association
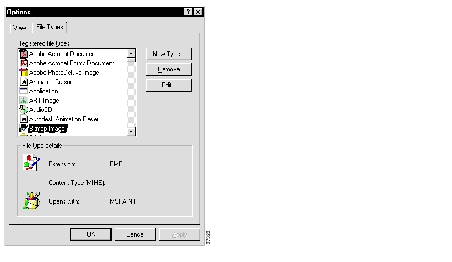
You can make an association for .ems files in Windows NT. A file association allows you to invoke dumplog automatically by double-clicking on a log file name (any .ems file) within Windows NT Explorer.
To set up an association for .ems files:
Step 1
Step 2
Step 3
Step 4
Step 5
Step 6
Step 7
Step 8
Step 9
Step 10
After you add the file association, you can double-click on any .ems log file in File Manager or NT Explorer to display a command window that contains the event data. You can also open log files that are currently logging event data. The command window shows events as they occur.
Command Logs
Certain ICM commands write information to their own log files. The log confirms whether the job properly executed. The log also contains any error messages the job generates.
These command logs are stored along with the per-process log files in the \logfiles directory. However, unlike the per-process log files, you can view command logs directly with a text editor such as Notepad or WordPad.
The ICM command logs include the following:
•
•
•
•
The purgecmd.pl job automatically removes entries older than 10 days from icrprint.log and printAT.log. This job is schedule to run automatically every night.
Chapter 6, "Scheduled Jobs," provides more information about viewing and managing the ICM command log files for scheduled jobs.
![]()
![]()
![]()
![]()
![]()
![]()
![]()
![]()
Posted: Mon Dec 6 14:07:24 PST 2004
All contents are Copyright © 1992--2004 Cisco Systems, Inc. All rights reserved.
Important Notices and Privacy Statement.