|
|

This chapter describes the traps and alarms used in Cisco 6400 SCM application.
The Cisco 6400 UAC supports a number of alarm sources, including SNMP traps and SNMP alarm tables from Cisco 6400 MIBs. Additionally, a number of event derivations can be made by the Cisco 6400 SCM.
All alarm sources of the Cisco 6400 SCM display in windows, providing an integrated fault management solution.
This section outlines the sources of Cisco 6400 SCM alarm information and shows how these sources are represented within the Cisco 6400 SCM and Cisco EMF applications.
Event Browser is an application that allows you to view events flagged by the system.

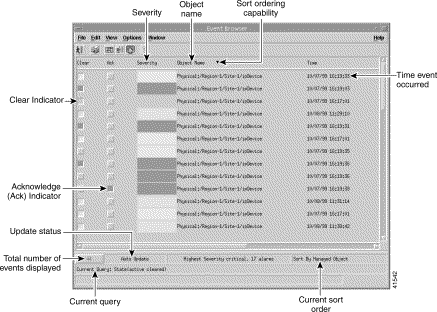
Click the Events icon in the CEMF Launchpad (see Figure 7-1) to open the Event Browser window. The Event Browser window appears (see Figure 7-2).

The Event Browser window displays the following information in a tabular format:
All events are saved within the Event Browser, which displays both current and historical data.
All network objects are color-coded reflecting their operational status. Alarms are raised up the element hierarchy according to severity. Table 7-1 identifies alarm types and their associated color codes.
| Alarm Type | Color |
|---|---|
Critical | Red |
Major | Orange |
Minor | Yellow |
Informational | White |
You can navigate directly from a single event to the affected object to perform detailed configuration activities.
One example of a major (orange) alarm is loss of connectivity to any Cisco 6400 component. This appears as an orange alarm in the Map Viewer window. When this occurs, you should view the Event Browser window for details of the alarm.
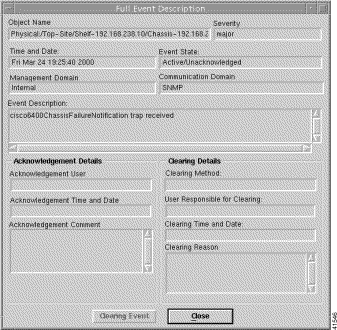
Double-click on an event for further details of the alarm event. The Full Event Description window appears (see Figure 7-3).

 |
Note When the event has not been cleared, the Event State displays Active and the Clearing Method, User Responsible for Clearing, Clearing Time and Date, and Acknowledgement Details sections are disabled. The information displayed cannot be altered. When an event has been cleared, you can view the method used to clear it by clicking the Clearing Event button. |
The Full Event description window displays the following information:
The Full Event description window displays the following information:
The Full Event description window displays the following information:
Click Close to exit the Full Event Description window. Click Close to exit the Event Browser window.
Refer to the Cisco Element Management Framework User Guide for further information on Event Browser.
Cisco EMF events is the primary information used by Network Operations Center (NOC) personnel for fault management tasks. Alarms (or Cisco EMF events) are generated from three sources of fault information, as follows:
1. SNMP traps
2. Trap directed polling, where alarm information is retrieved from Cisco 6400 UAC SNMP tables
3. Presence polling: SNMP polling of the Cisco 6400 hardware components to detect whether they are still functional (at least at a basic level)
The Cisco 6400 SCM software processes four traps sent from the Cisco 6400 UAC hardware:
Table 7-2 describes mapping between the alarms raised in the chassis alarm table and the traps that are dispatched from the Cisco 6400 UAC. For a simple integrated fault management solution, the SCM uses mapping to raise alarms on Cisco EMF objects.
| Alarm | Trap | Meaning |
coreTemp | ChassisFail | Core temperature exceeding limit |
inletTemp | ChassisFail | Inlet temperature exceeding limit |
totalFanFail | ChassisFail | Cisco chassis fan fault alarm |
partialFanFail | ChassisFail | Cisco chassis fan partial fault alarm |
fanMissing | ChassisFail | Cisco chassis fan not present alarm |
pem0Fail | ChassisFail | Failure of power module 1 |
pem1Fail | ChassisFail | Failure of power module 2 |
sonetLineFail | linkUp / linkDown | SONET line failure |
cardOIRAlarm | ChassisChange | Alarm card online insertion/removal (OIR) or wrong card |
cardFail | ChassisChange | Card failure for non-redundant card, redundant primary card |
cardPartialFail | ChassisChange | This alarm is raised when a secondary NSP is resident, and the primary NSP has detected a failure condition in the secondary NSP |
The Cisco 6400 SCM displays "Lost Comms" alarms when SNMP polls to the affected module fail.
The Cisco 6400 SCM uses both traps (detailed in Table 7-2) and the alarms raised in the chassis alarm table sent from the Cisco 6400 UAC to raise event conditions against the appropriate Cisco 6400 component. Alarms on the Faults tab in the Cisco 6400 Chassis Management window are represented explicitly against each object on which they occur. This allows any problems that exist involving the chassis, NSP, NRP, node line card or ATM port objects to be quickly identified by the change of color severity.When an alarm exists its color severity is either yellow (indicating a minor alarm), orange (indicating a major alarm), or red (indicating a critical alarm). Full alarm descriptions can then be viewed using Event Browser.
Alarms that occur on physical objects are raised on the objects in the Cisco 6400 SCM as they occur. Similarly, as the alarm condition on the physical object is cleared, then the alarm against the object is cleared both in the Event Browser and by the color severity.
 |
Note In order for alarms to be raised and cleared as intended, the Cisco 6400 NSP hardware must be configured to send SNMPv2c traps to your management station. |
The Cisco 6400 also stores alarm information in SNMP tables. Because Cisco EMF is based on a protocol-independent event model, these alarm conditions are presented to you in the same manner as SNMP traps.
Table 7-3 shows the alarm conditions available from the Cisco 6400 SNMP tables:
| Alarm Message | Alarm Description | Relevant Objects |
coreTemp | Core temperature exceeding limit | NSP |
inletTemp | Inlet temperature exceeding limit | NSP |
totalFanFail | Cisco chassis fan fault alarm | NSP |
partialFanFail | Cisco chassis fan partial fault alarm | NSP |
fanMissing | Cisco chassis fan not present alarm | NSP |
pem0Fail | Cisco chassis power supply PS0 alarm | NSP |
pem1Fail | Cisco chassis power supply PS1 alarm | NSP |
sonetLineFail | SONET line failure | ATM Port |
cardOIRAlarm | Alarm card online insertion/removal (OIR) or wrong card | NSP, NRP, LineCard |
cardFail | Card failure for non-redundant card, redundant primary card | NSP, NRP, LineCard |
cardPartialFail | Card partial failure alarm for redundancy secondary card failure | NSP, NRP, LineCard |
 |
Note There are other alarms that can be raised against the ATM port that currently have no corresponding message string. |
These alarms are available through the Cisco EMF Event Browser and through the Cisco EMF Map Viewer. These applications serve as a single integrated fault management interface for the Cisco 6400 UAC.
![]()
![]()
![]()
![]()
![]()
![]()
![]()
![]()
Posted: Fri Aug 4 01:56:47 PDT 2000
Copyright 1989-2000©Cisco Systems Inc.