|
|

This chapter tells you how to use the Cisco 6200 Manager to monitor and test a Cisco 6200 DSLAM. This chapter includes the following sections:
The Cisco 6200 Manager provides you with detailed information about the status of the Cisco 6200 DSLAM and its cards and ports. You should monitor the system and identify and respond to problems that may impact system performance.
Many of the status alarms are represented by color-coded status indicators in the Cisco 6200 Manager. Indicator colors are given in Table 5-1.
Color-Coded Status Indicators
The Cisco 6200 Manager displays alarm information in several windows.
The Server Polling Status window (Figure 4-1) displays the server name, IP address, and server status. The server alarm states are listed in Table 5-2.
Table 5-2 Server Status Alarms
To find out which Cisco 6200 DSLAM is sending the alarm, click twice on the server name to access the Element Status Display window.
In addition to the hostname, IP address, and system type, the Element Status Display window (Figure 4-4) indicates system up time and system status. System up time can help you estimate system reliability and set maintenance schedules; entries in the status column can warn you of an immediate or impending problem.
Table 5-3 describes the Element Status Display window status alarms.
Note If an Subscriber Line Card (SLC) reports separate, individual failures on all of its modems at once, the chassis still reports a minor alarm status, even though no traffic is flowing through the SLC. In alarm processing, the quality of the alarm is more important than the quantity. Multiple lower-level alarms are not converted into a higher-level alarm.
To learn more about the cause of system status alarms, click twice on Cisco 6200 DSLAM to access the Component Status window.
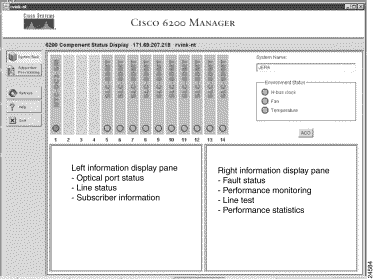
After you click the Display button in the Element Status Display window, the Component Status window appears (see Figure 5-1). From this window you can check the status of card and environment alarms, monitor and test cards, and add new subscribers. For information on adding new subscribers, see the section "Provisioning Subscribers" in "Configuring with the Manager."
The upper display area of the Component Status Display window features
Depending on the procedure you choose, the lower part of the display allows you to monitor and test NTC or SLC. For more information, see the section below "Card and Port Monitoring and Testing."
In addition, you can view and update subscriber information from the Component Status Display window. For more information on this, refer to "Configuring with the Manager."
The environment status is displayed in the upper right of the Component Status Display window (Figure 5-1). The Cisco 6200 Manager shows only the higher level of alarms at the system level. The environment status display provides the following information:
Below the Environment Status display is the alarm cutoff (ACO) button. Use this button to turn off audible alarms.

The Component Status Display window (Figure 5-1) includes a graphical representation of the cards in a Cisco 6200 DSLAM chassis. The representation shows
To access detailed information about a card, click on a card in the upper part of the Component Status Display window (Figure 5-2). Information about the card appears in the panes at the bottom of the window. (If the pane displays subscriber information, not status information, click on the System Rack button on the upper left of the window.)
The information displayed in these panes depends on what card or slot you have selected in the upper portion of the Component Status Display window. You can monitor an NTC or SLC. The Manager does not provide information about the MPC.
To monitor and test an NTC, perform the following steps:
Step 2 Move your mouse cursor on top of the graphical image in the Optical Port Status pane. A message appears indicating the status of the port.
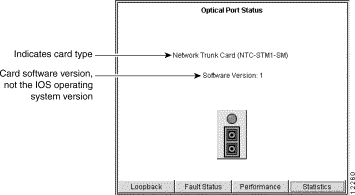
To get more information or to run a loopback test, click one of the buttons at the bottom of the Optical Port Status pane.
To monitor optical port fault status, click on the Fault Status button in the Optical Port Status pane. The Optical Port Fault Status pane is displayed (see Figure 5-4). In that pane, the Near End Alarms column refers to alarms that occur at the CO side, and the Far End Alarms column refers to alarms that occur at the CPE side.
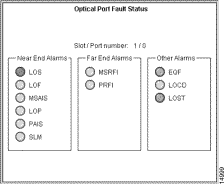
Table 5-4 lists the fault conditions that are detected and treated as critical alarms for the NTC (OC-3 trunk card). For more information on these terms, refer to "Glossary."
Sometimes one failure can trigger numerous fault detectors. For example, when a SONET signal is lost, framing is also lost. Fault detection software uses a hierarchical principle, however, in that it reports only the fault that is most likely to be the root cause of a problem.
Table 5-5 lists the fault detection hierarchy for the OC-3-based NTC.
Table 5-5 Fault Detection Hierarchy
| When this fault occurs...1 | These faults are set to Unknown or Suppressed |
|---|---|
| 1See Table 5-4 for an expansion of these fault condition acronyms. |
To see how a port is being used, click the Performance button in the Optical Port Status pane. The Performance Monitoring pane is displayed (Figure 5-5).

The pane provides the following information:
To get performance statistics, click the Statistics button in the Optical Port Status pane. The Performance Statistics pane is displayed (Figure 5-6).
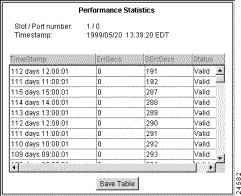
The Performance Statistics display provides the following information: :
You can run loopbacks to test the ATM line. This test is performed with third-party test equipment. For more information about loopback tests, refer to the Cisco 6200 User Guide.
To run loopback on a port, click the Start Loopback button in the Optical Port Status pane and choose Yes when the Confirm window appears. Once you start a loopback test, a Stop Loopback button appears, which you can click at any time.
Note When you click the Start Loopback button, you disrupt service for all customers on this port. When you click the Stop Loopback button, service is resumed.
When you monitor and test an SLC, you use the Line Status pane. This pane has eight connectors labeled Port 0 to Port 7. If the connector is filled (for example, Figure 5-7, CAP Port 0), the corresponding subscriber port is provisioned and enabled. If a connector is empty (for example, CAP Port 1 in the same figure), the corresponding port is unprovisioned. If the connector is crossed out (for example, CAP Port 7 in the figure), the corresponding port is provisioned but disabled.
To monitor and test an SLC, perform the following steps:
Step 2 Move your mouse cursor on top of one of the ports in the Optical Port Status pane. A message appears indicating the status of the port, such as whether it is enabled and active.
To get more information or to run a line test, click one of the buttons at the bottom of the Line Status pane.

To monitor line fault status, select a port and click the Fault Status button in the Line Status pane. The Line Fault Status pane is displayed. The Line Fault Status pane for SLCs is shown in Figure 5-8.
In addition to subscriber name and slot/port number, this pane indicates the following:
The pane also provides status indicators for upstream loss of cell delineation (LOCD), DMT upstream loss of signal (LOS), DMT upstream loss of frame (LOF), and DMT downstream loss of power (LPR).

To see how a port is being used, click the Performance button in the Line Status pane. The Performance Monitoring pane is displayed (see Figure 5-9).
The pane provides the following information:
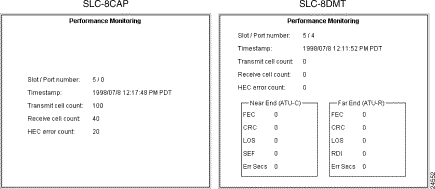
For DMT cards, the system displays additional information for the ADSL transmission unit (ATU) in the central office (C) and at the remote location (R). This information is listed under the headings Near End (ATU-C) and Far End (ATU-R). Data is provided for
To get performance statistics for SLC-8 DMTs, click the Statistics button in the Optical Port Status pane. The Performance Statistics pane is displayed (Figure 5-6).

The Performance Statistics reports statistics for the near-end (from CPE to CO) and far-end (from CO to CPE). The pane displays the following information:
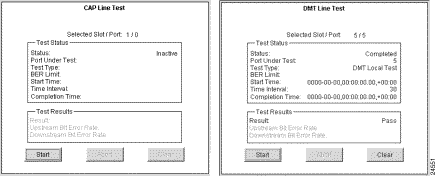
The Cisco 6200 Manager allows you to run several types of line tests. Figure 5-11 shows CAP and DMT Line Test panes. These panes are used to start, abort, and clear tests and to view test results. The system provides you with the following information about the test:
If a field is not applicable to a particular test, it is grayed out in the appropriate Line Test pane.
Step 2 Clear the statistics in the Line Test pane by clicking Clear.
Step 3 Click Start in the Line Test pane.
The DMT test is used to test the status of the SLC-8DMT chipset. After you click Start in a DMT Line Test pane, the DMT test starts immediately. The results are displayed in the Line Test pane.
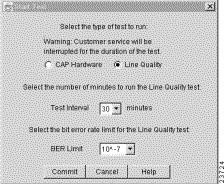
If you are testing an SCL-8CAP card, CAP Start Test window displays after you click the Start button in the Line Test pane. The CAP Start Test window is shown in Figure 5-12.
You can choose between two types of CAP tests:
Customer service is interrupted while these tests are running.
Step 2 Click Commit.
The test status and results display in the CAP Line Test pane.
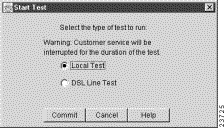
You can run loopbacks on the SLC-8DMT. This test is performed with third-party test equipment. For more information about loopback tests, refer to the Cisco 6200 User Guide.
Step 2 Select either a local test or a DSL line test.
Step 3 Click Commit.
Customer service is interrupted while these tests are running.
Note When you click the Start Loopback button, you disrupt service for all customers on this port. When you click the Stop Loopback button, service is resumed.
![]()
![]()
![]()
![]()
![]()
![]()
![]()
![]()
Posted: Thu Feb 6 21:44:18 PST 2003
All contents are Copyright © 1992--2002 Cisco Systems, Inc. All rights reserved.
Important Notices and Privacy Statement.