2.2. Digital audio demystified
Sound is converted to digital information by means of a circuit that creates a set of numbers corresponding to the shape of an incoming electrical wave or current. Two sets of binary values represent digitized waveforms: sampling rate and bit-depth. A sample is the value and position assigned to a point of an electrical waveform. The number of samples taken per second is called the sampling rate. Bit-depth refers to the size of the binary numbers assigned to describe the dynamic value of each sample.
Sampling is the most important part of the digitizing process. A sample is simply a snapshot of a sound at a given point in time. The sampling rate is a measurement of how many snapshots are taken. To understand this, think about film. A movie camera takes 24 still photographs per second. When they are played back at a certain speed in the theater, the result is almost indistinguishable from reality. Each frame of film is a sample; 24 frames per second is the sampling rate. If you were to film at a lower sampling rate, there would be less information for each second of film. The result would be jerky motion. If you filmed at an even slower rate, the illusion of motion would disappear completely; the film would look like a sequence of still images (which it is).
Digital audio encoding standard
The sampling rate of 44,100 Hz was deemed sufficient for audio reproduction by the governing standards committee at the time audio CD technology was born. Many audio professionals argue that a higher sampling rate is required to accurately reproduce the full dynamic range and upper harmonics of sound and are actively pushing to develop standards that include a sampling rate of 88.4 kHz or 96 kHz.
Just as some audio professionals question the 44,100 Hz sampling rate standard, many have successfully pushed for audio systems with higher 20- and 24-bit encoding capabilities. The higher bit-depth audio systems reproduce more of the subtleties of softer sounds and long decays that are lost in 16-bit recordings.
Higher sampling rate and bit-depth encoding for basic studio recording and editing requires enormous storage space and computing speed in order to process and store the digitized audio. A stereo 16-bit, 44,100 Hz audio file requires the computing of 1,411,200 bits (1.4 Mbit) per second and 10 MB of storage space for every minute of recorded audio. A 20-bit, 96 kHz audio file needs more than twice that bandwidth and disk space and requires the computing of 3.8 Mbit per second.
Read Chapter 5, "Introduction to Streaming Media" for more details about data compression for streaming web audio.
As with film, it takes a certain number of snapshots to realistically capture the reality of an analog sound. The magic number is generally agreed upon as 44,100 Hz. This number became the audio standard because it is the lowest rate that can accurately reproduce the highest frequencies of our audible hearing range. A 44,100 Hz sampling rate accurately reproduces frequencies up to and slightly beyond the 20,000 Hz hearing limit.
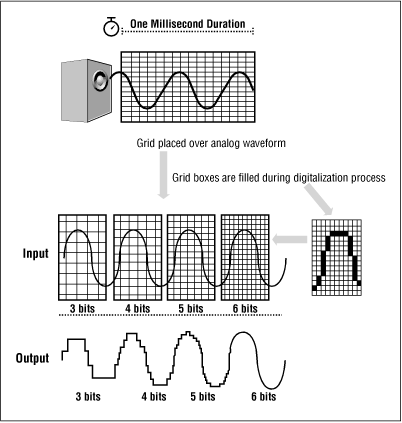
What happens when you sample at less than this rate? It's kind of like scanning a photograph at low resolutions. A 72 pixel-per-inch scan might be recognizable, but it will be of low-quality; you'll see the pixels, and the transitions between colors will be very choppy. If you scan even lower, say 10 ppi, the image will be unrecognizable, just a series of colored blocks. We can visualize digital audio the same way. If you place a grid over an analog waveform, you'll get better reproduction with a fine grid and worse reproduction with a coarse grid. Figure 2-11 illustrates this point.

Figure 2-11. Digital resolution can be visualized by overlaying a waveform on a grid. The finer the grid, the higher the resolution. The fineness of the grid is controllable by the sampling rate and bit-depth.
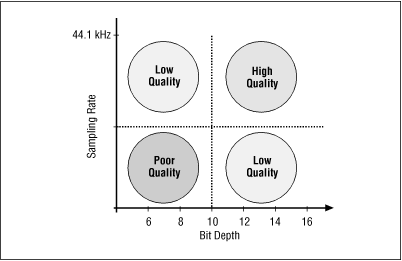
Once we've sampled the sound at the optimal rate, we just need to store it as data. How much space do we take to store that data? For CD-quality sound, the answer is 16 bits. That's a measurement of bit-depth. Unfortunately, CD quality isn't practical for the Web, so we start throwing data out by reducing bit-depth. By the time we get to 8-bit sound, we've compromised quality quite a bit, but we've also arrived at some reasonable file sizes. Optimizing sound for the Web is a process of backing off from optimal sampling rates and bit-depths to arrive at something of acceptable quality and file size. Figure 2-12 shows the relationship between these two concepts.

Figure 2-12. It takes both a high sampling rate and a high bit-depth to get high-quality audio.

Copyright © 2002 O'Reilly & Associates. All rights reserved.


