|
|

Table Of Contents
View Last Completed Run Report
Schedule CLI Collection for BPX/IPG/IPX
Schedule CLI Collection for MGX 8220 (Axis)
Schedule CLI Collection for MGX 8230
Schedule CLI Collection for MGX 8250/8850 Release 1
Schedule CLI Collection for MGX 8850 Release 2
Schedule CLI Collection for MGX 8950
Schedule CLI Collection for BPX-SES
Schedule CLI Collection for BPX Report
View CLI Collection for BPX/IGX/IPX
View CLI Collection for MGX 8220 (Axis)
View CLI Collection for MGX 8230
View CLI Collection for MGX 8250/8850 Release 1
VIew CLI Collection for MGX 8850 Release 2
View CLI Collection for MGX 8950
View CLI Collection for BPX-SES
View Scheduled Reports for BPX Devices
Logging, Error Rotation and Reporting Levels
Error Report and Message Log Format
Using NATKit 3
This section introduces you to the functions found in the Network Analysis Toolkit drawer in Network Analysis Toolkit (NATKit) 3.
Browser Requirements
Before logging in to NATKit, make sure your web browser is one of the versions listed below:
•
Netscape Navigator 4.77, 4.78, and 4.79 (Windows, AIX 4.3.3, HP-UX 11.0)
•
Caution
•
•
Accessing the Server
When you access the NATKit Server, the NATKit 3 CiscoWorks 2000 screen appears with the Login Manager displayed. To access the server from a client system, enter the URL of the server in your web browser as follows:
•
•
HTTPs://server_name:1742•
HTTP://server_name:port_numberwhere server_name is the name of the server on which NATKit 3 has been installed and port_number is the port number assigned to access the GUI interface of the server.
Logging In
To perform server setup tasks, you must log in as the system administrator by following these steps:
Procedure
Step 1
Please contact your Advanced Services engineer if you need GUI access to the NATKit server.
Step 2
Browser Problems
If the desktop buttons do not work, Java and JavaScript are not enabled. Make sure you enable Java and JavaScript.
Make sure the browser cache is not set to zero.
Do not resize the browser window while the desktop main page is loading. This can cause a Java error.
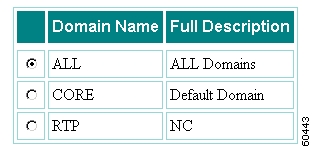
Change Domain
This function allows you to view all (default) devices or just the members of a single domain. This allows you to reduce the number of devices in each view to only members of a single group.
See Domains for more information on domain set up and use.
Setup
The following sections describe NATKit setup functions.
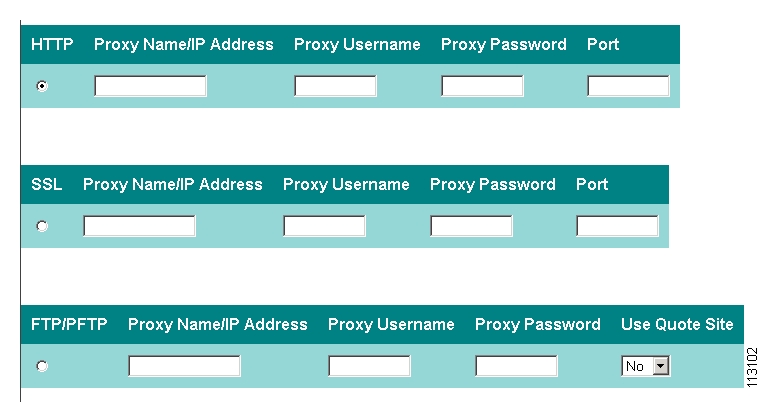
Transport
This function allows you to provide access information to a proxy server if NATKit needs to connect to a proxy server in order to do data uploads to natkit-upload.cisco.com via HTTP, SSL, and PFTP/FTP. By default, NATKit uploads data directly to natkit-upload.cisco.com.
NATKit enables SSL download with key-based data transfer. Every NATKit client has a public/private key. Data transfer is initiated only after proper key exchange is achieved with the backend server at Cisco.
ProcedureFor HTTP:
Step 1
Step 2
Step 3
Step 4
Step 5
Step 6
Step 7
For SSL:
Step 1
Step 2
Step 3
Step 4
Step 5
Step 6
Step 7
For FTP/PFTP:
Step 1
Step 2
Step 3
Step 4
Step 5
Step 6
Step 7
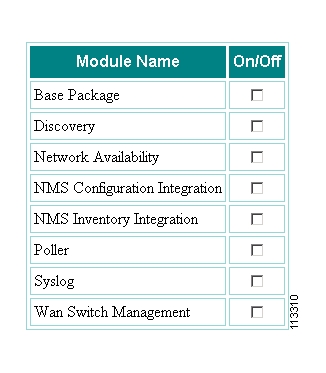
Downloads
This function allows you to specify which modules to include in the daily upload. In NATKit, if the package to upload is greater than the maximum configurable size selected, the download module splits the file into packets (each packet can be up to the maximum configurable size) and then downloads each packet. These packets are reassembled and processed on the backend at Cisco.
Procedure
Step 1
Step 2
•
•
•
•
•
•
•
•
Step 3
Distributed NATKit
If you have multiple NATKit servers residing on your network, a NATKit can be configured to act as a slave and transmit the data to download to another NATKit to send back to Cisco. Slave NATKits use HTTP to transmit the data to download to the master NATKit. The master NATKit downloads the data received by the slave NATKit to Cisco using HTTP, FTP, or PFTP/FTP but not SSL. Please contact your Advanced Services Engineer to learn more about this feature and configure NATKit as a slave.
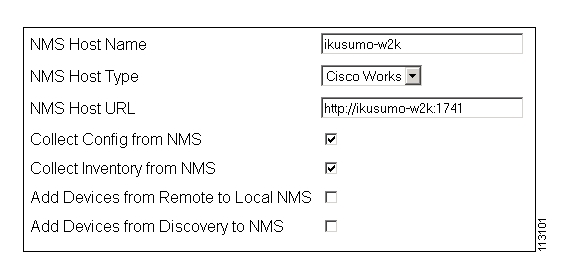
Remote NMS
Remote NMS Integration allows you to slave the NATKit to a remote NMS system. This helps reduce the effort required to keep the NATKit system updated with changes to the devices and device access information.
You can also select to slave NATKit to the remote system for Inventory, Configurations or both. This cuts the traffic to the customer network by NATKit to just about zero. The NATKit administrator can define the NMS for synchronization. Any Remote NMS that needs to be integrated must run a software client that constantly communicates with NATKit. Changes in device attributes and the addition/deletion of devices in NMS are communicated to NATKit immediately.
NATKit initiates a full compare sync operation every few hours to take care of unmanaged devices that don't get published in CiscoWork's Event Distribution System.
Note
Procedure
Step 1
Step 2
Step 3
Step 4
Step 5
Step 6
Step 7
Note
Step 8
Step 9
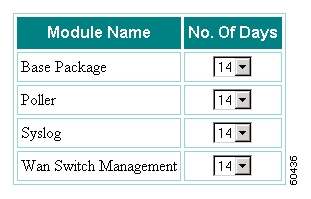
Purger
The Purge Data Configuration form allows you to specify the number of days worth of data stored in NATKit each time the data is purged. For example, if the Syslog Module is set to 14 days, all Syslog data stored in NATKit is removed every 24 hours for two weeks except for the prior 14 days.
A purge time can be set for:
•
•
•
•
•
Domains
A Domain is a group of devices that share a common characteristic or group of characteristics. The administrator of an RME system can keep all devices in a single domain (default) or use the function Create Domain (Network Analysis Toolkit > Setup > Domains) to define the characteristics of the members of a Domain.
Creating a Domain
This function is used to create new domains. A domain allows you to group devices for viewing purposes.
The characteristics that define a domain can be based on one or more of the following criteria:
•
•
•
•
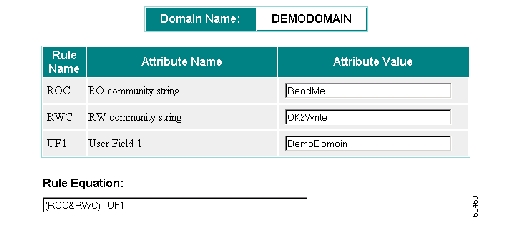
The logical operators at & (and) and | (or). Parentheses can also be used to group items.
In the illustration above, the user has selected three fields (SNMP Read Only, SNMP Read Write community strings and User Field 1) as the characteristics that define members of the domain "DEMODOMAIN". Note that in the Rule Equation the exact text of the items in the "Rule Name" column have been used along with the logical operators "&", "|" and the grouping function of the parentheses. Members of the domain DEMODOMAIN are devices with the SNMP R/O community string of "ReadMe" AND the SNMP R/W community string set to "OK2Write"OR User Field 1* contains the string "DemoDomain". In other words, any device with DemoDomain in User Field 1 is a member, regardless of the SNMP community strings, and any device whose community strings match the values in the attribute field for SNMP R/O and R/W is a member even if User Field 1 is blank or set to something besides DemoDomain.
Note
*See the RME 3.4 User's Guide for more information about the User Fields of the devices.
Procedure
Step 1
Step 2
Note
Step 3
Step 4
Step 5
Step 6
Step 7
Step 8
Managing Domains
These functions are used to define what devices are included in a particular domain, or to delete a domain.
ProceduresModifying a Domain
Step 1
Step 2
Step 3
Deleting a Domain
Step 1
Step 2
Step 3
Applying Domain Rules
This screen is used to begin the processing of the attribute rules selected from the Select Domain Rules page and attribute values entered on the Define Rules for Domain page.
All devices are processed against all domains. The first domain that satisfies the equation (entered in the Define Rules for Domain page) is assigned to the device. Devices that do not fit into any domain rule are assigned to a domain labeled "CORE". Device information for all devices are fetched from the local NMS (CiscoWorks), and a remote NMS if one is used.
Procedure
Step 1
Step 2
Step 3
Caution
Alerts
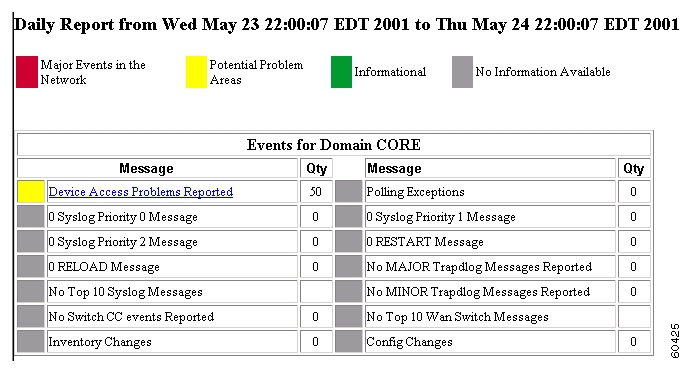
Daily Report
The Daily Report is a condensed overview of network activities from the previous day. The Daily Report is automatically produced each morning; no action is required to configure the report. If Domains are created, a Daily Report is created for each domain. Below is an illustration of a Daily Report and a detailed look at reading the report.
Reading the Daily Report
The Daily Report is broken down into sections to simplify understanding the report. Each section of the Daily Report forms a hyperlink to more detail if data in that category has been recorded during the period covered. Click on the hyperlink to read more detailed information about the event.
Procedure•
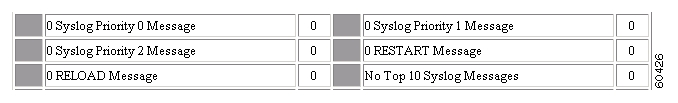
Syslog Messages
This section consists of six classes of syslog messages. The first three are based on the priority of the messages; levels 0, 1, and 2. The next class is based on a simple message count; the 10 most frequently recorded messages are listed. Finally, messages indicating that a device has been forced to reload or restart are listed.
Config Changes
This section covers changes to device configuration. If changes are detected during the period covered, the number of changes is listed and a link to more detailed information is activated. If you select the link, a list of devices that recorded a change is shown. The device name becomes a link to the actual change, the current running configuration, the previous running configuration and a configuration history for that device.
Device Access Problems Reported
This section focuses on the report from the Device Access Verifier. This tool checks access to each device each night and reports failures recorded. If any of the tests (ping, SNMP R/O and Telnet/SSH) fail, the link becomes active and leads to a report listing the failures, such as: "Failed, reason: Password in login mode is wrong".
Polling Exceptions
This is a report of exceptions to SNMP poller tasks. This becomes active if a poller task's threshold is violated. This link leads to a page showing the task recording the violation and the information (if any) collected by the commands selected.
Wan Switch Trapd Log Messages
The three Wan Switch Trapd Log messages report on major, minor and the 10 most frequent messages during the period covered by the report.
Switch CC Events Reported
Switch CC Events occur in stratacom devices when the active devices and standby ASC cards are switched. These events are recorded in the trapd log file which NATKit reads periodically and lists here.
Inventory Changes
Changes recorded for any device in the inventory during the period covered by the report are listed here. If active this link leads to a list of devices recording changes, a list of the changes and the device inventory.
History
Daily reports that have been completed successfully in the past are available for viewing from the GUI interface. You can click on a particular daily report to view the report in detail.
Procedure•
Device Manager
Launch Pad
The Launch Pad provides a way to view device information for a device that has been collected and stored in NATKit. The Launch Pad also provides a way to view multiple data types that have been scheduled for collection.
Once a device type and device have been chosen, the Device Center for that device appears and displays the following information about it:
•
•
–
–
–
–
–
–
–
–
–
–
Note
•
•
–
–
–
–
•
•
•
•
•
Procedure
Step 1
List of searchable device types.
List of devices found in the selected device types.
Step 2
Step 3
Step 4
View Current Devices
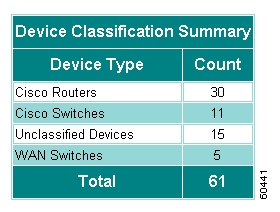
NATKit only collects data on network devices that have been added to the NATKit database, either by the file method, individually via the GUI or by Device Discovery. The Device Identification Manager (DIM) is used to specify or display those devices. The NATKit Device View screen shows what devices NATKit has in its database, along with additional information such as system object identification and a brief description of the device and its type.
In addition, a summary of all Cisco routers, switches and unclassified devices found are displayed. The Device Name, SysObject ID, Description, and Device Type are listed for each device found.
The Device Name and Device Type of any WAN switch detected is also listed.
Procedure•
View Access Verifier
NATKit uses the Device Access Verifier tool to determine whether some or all devices are accessible via Telnet, SSH, SNMP and/or Ping at a designated time. This tool provides a way to view the results of a previously scheduled device verification task.
Procedure
Step 1
Step 2
Step 3
Step 4
Step 5
Note
Device Name Mapping
Device Name Mapping (DNM) aliases are used as a quick and easy way to identify and remember devices. Use the Device Name Mappings tool to list the DNM aliases for a particular device.
Procedure
Step 1
Step 2
Step 3
Step 4
Set Access Methods
The Set Access Methods screen is used to select the preferred method of access (Telnet, SNMP, Ping, or SSH) for a particular device.
Procedure
Step 1
Step 2
Step 3
Step 4
Step 5
Step 6
Classify Devices
NATKit can support devices that are not supported by RME. The Classify Devices feature attempts to classify devices not supported by RME.
Procedure
Step 1
Step 2
Step 3
Step 4
Step 5
Caution
Set Device Login Type
Class types for classified devices can be reassigned for login (Telnet and SSH) purposes only.
Procedure
Step 1
Step 2
Step 3
Step 4
Step 5
Note
Caution
Schedule Access Verification
NATKit uses the Device Access Verifier tool to determine whether some or all devices are accessible via Telnet, SSH, SNMP and Ping at a designated time.
Note
The Schedule Access Verification tool is used to schedule a device access verification task for one or more devices. Results of the verification can be viewed using the Device Access Verification.
Procedure
Step 1
Step 2
Note
Step 3
Note
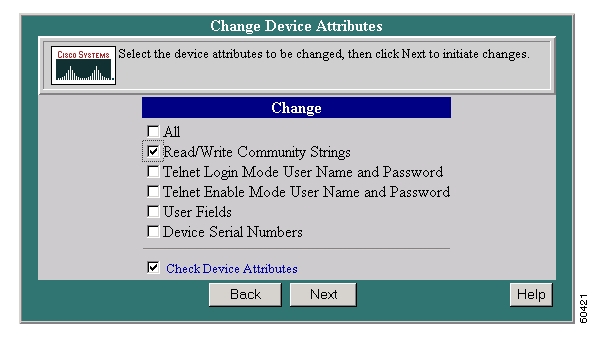
Step 4
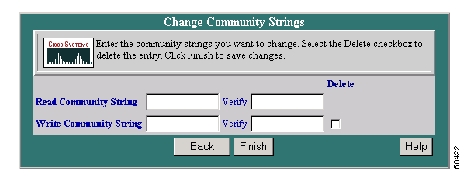
After selecting Next, a screen appears to select new values for the attributes selected. In the illustration below the Read/Write Community Strings option was selected.
After making the change return to Step 1 to re-test.
Set Device Domain
This function allows you to force a device into a domain regardless of the rules for that domain.
Procedure
Step 1
Step 2
Step 3
Step 4
Step 5
Step 6
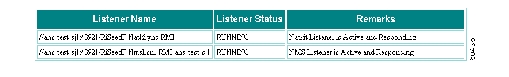
NMS Server Status
This screen displays the status of all servers required to process seedfile synching. A Local NMS Listener runs on the local machine and listens to the CiscoWorks EDS bus for events on device changes. A Remote NMS Listener is displayed only if Remote NMS is configured. It operates similar to the Local NMS but runs on a remote machine.
NatkSyncServer runs on a local machine and listens for device changes reported by both the Local NMS Listener and any Remote NMS Listener that has been configured.
Once all jobs are running, run the Manual Seedfile Sync to sync up devices.
Manual Seed Files Sync
This tool is used to schedule a task that imports the seedfile from the local CiscoWorks machine or a remote NMS Host into NATKit.
Procedure
Step 1
Step 2
Step 3
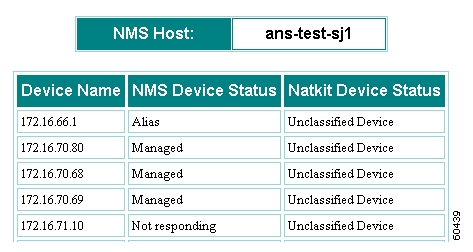
Seed File Sync Exceptions
This tool compares the devices in the NMS seedfile to NATKit's device information for inconsistencies. If NATKit isn't reporting devices known to exist, this tool compares the NMS seedfile to the device information currently in NATKit and report why. More often than not a device is reported as unclassified. Use NATKit's Classify Devices tool to classify them.
Procedure
Step 1
Step 2
Step 3
Device Discovery
This tool allows you to discover Cisco devices that are accessible via SNMP from NATKit. The discovery consists of a two stage process where you schedule the actual discovery of Cisco devices and then initiates a seedfile to be created by the discovery process.
Discovery View/Administration
This tool displays information about all devices detected by NATKit, and allows for administration and report generation.
Procedure
Step 1
Step 2
•
•
•
•
•
•
•
View Discovery Administration
This page allows you to set up and manage your discovery settings, manage profiles, and use the Discovery Wizard.
Procedure
Step 1
Step 2
Defining the Device Discovery Method Using the Wizard
You can use the Wizard to define the Device Discovery method for you. To use the Wizard:
Procedure
Step 1
Step 2
Step 3
Step 4
Working with Profiles
After using the Wizard to define the Discovery process, you are given the option to save your information as a profile.
•
•
•
Defining the Device Discovery Method Manually
Use this option to specify the device discovery method for your network. One or more of the following can be selected, with one exception. CDP and CDP, Routing Protocol and ARP cannot be selected at the same time.
Before Beginning
To include only certain IP address ranges for the device discovery, please refer to the section Include Filters.
To exclude certain IP address ranges from the device discovery, please refer to the section Exclude Filters.
After Selecting the Method
After selecting the method, a second screen appears asking you to provide more information. For CDP and Ping Sweep Starting IP Address, you are asked to provide one or more starting points (IP addresses) and hop counts. The Device discovery starts from the IP addresses selected, discovers devices using the IP address supplied, and stop when all devices within the selected hop count have been discovered.
When the Ping Sweep IP Address Range option is selected, you are asked to provide one or more IP addresses and subnet masks. The discovery program pings all legal addresses (excluding the addresses in the Exclude Filters, within the subnet for each address.
Caveats
Device Discovery discovers only Cisco devices. While non-Cisco devices may be discovered by the ping-based methods, an SNMP request (using the SNMP R/O strings supplied by the user for the sysObjectID) is sent to each device after discovery. If the device fails to respond or the response doesn't include certain fields identifying Cisco equipment, the device is declared unmanaged and not included in further discovery or the seed-file produced by device discovery.
CDP is a Cisco propriety protocol; the user of the router may also disable CDP. Because of this, the NATKit Device Discovery user selecting the CDP option must be certain no Cisco equipment is "behind" (from the NATKit systems point of view) non-Cisco equipment or Cisco devices with CDP disabled. In cases where Cisco devices are behind non-CDP devices, you must provide at least one IP address for each network region behind (from the NATKit systems point of view) these links.
CDP is not completely supported over some wide area links (such as ATM) even on Cisco devices. To ensure successful discovery of all Cisco devices you must provide at least one IP address for each network region behind)these links.
Discovery of any type places a load on the network being tested. It is the your responsibility to use the setting in Advanced Settings and the scheduler function (see Schedule Polling for more information) to minimize the impact of discovery.
Exclude Filters
Use this option to define filters for excluding devices from device discovery. Devices discovered with IP addresses in the Exclude Filters list are not added to inventory.
Procedure
Step 1
Step 2
Step 3
Include Filters
Use this option to define filters to include devices in device discovery. The discovery process attempts to locate additional devices that are reachable via these devices.
Procedure
Step 1
Step 2
Step 3
TacAcs Logins
Use this option to set the TacAcs Logins.
Procedure
Step 1
Step 2
Step 3
TacAcs Passwords
Use this option to set the TacAcs passwords.
Procedure
Step 1
Step 2
Step 3
Telnet Passwords
Use this option to set the Telnet passwords.
Step 1
Step 2
Step 3
Enable Telnet Passwords
These options allow you to set the Telnet passwords you want to enable.
Procedure
Step 1
Step 2
Step 3
TacAcs Login Prompts
These options allow you to set the TacAcs login prompts.
Procedure
Step 1
Step 2
Step 3
TacAcs Password Prompts
These options allow you to set the TacAcs password prompts.
Procedure
Step 1
Step 2
Step 3
Telnet Login Prompts
These options allow you to set the Telnet login prompts.
Procedure
Step 1
Step 2
Step 3
Telnet Prompts
These options allow you to set the Telnet prompts. Upon user exec level login to a device, one of the following defined Telnet Prompts shown is expected. Please add additional Telnet prompts as needed.
Procedure
Step 1
Step 2
Step 3
Enable Telnet Login Prompts
These options allow you to set the Telnet login prompts you want to enable.
Procedure
Step 1
Step 2
Step 3
Enable Telnet Prompts
These options allow you to set the Enable Telnet Prompts you want to enable. Upon privileged level login to a device, one of the following defined Enable Telnet Prompts shown is expected. Please add additional Telnet prompts as needed.
Procedure
Step 1
Step 2
Step 3
Clear All Visits
This tool clears all selected options.
Procedure
Step 1
Step 2
Remove All Devices
This tool deletes all devices from the discovery database and removes all data in the Summary Report. Information remains in the NATKit database for all discovered devices if you specified to Export Device List on Discovery Completion under Export Settings.
Procedure
Step 1
Step 2
Start/Stop Discovery
Use this option to start or stop the device discovery immediately or to schedule it to start at a predefined time. If more than one person starts, stops, or schedules device discovery at the same time, the system accepts only one request for device discovery, and sends an error message to the other.
Note
Procedure
Step 1
Step 2
Step 3
Step 4
Start Credentials
Discovery Credentials can be run after running a completed Discovery process. Running Discovery Credentials creates a seedfile named seedfile.txt from the discovered devices. Set the start time to zero days, zero hours and zero minutes to start the process immediately. Otherwise, set the start time relative to the current server time. The seedfile is be located in the /opt/CSCOpx/objects/CSCOad/nsa/natkit/data/ of the web server installation root.
Procedure
Step 1
Step 2
View Summary Report
Summary report shows all the devices in the Discovery database. Click on the Device count to get the device list and export the data.
Procedure
Step 1
Step 2
Step 3
The Summary Report displays all the devices in the Discovery database based on discovery method and device family. The top table contains a count of the devices found by each discovery method in addition to the count of managed and unmanaged devices. The bottom table contains the count of managed devices by device family. You can click on the link beside each type in this table to obtain additional information about these devices.
View Delta Report
Delta report shows the devices found in the current and previous run along with new devices added and missing devices from the previous run.
Procedure
Step 1
Step 2
Step 3
The Delta Report displays all devices found in the previous discovery run, the current run, and any new devices added or devices missing since the previous run.
•
View Last Completed Run Report
Last Completed Run report shows the devices from the last discovery run.
Procedure
Step 1
Step 2
Step 3
This screen displays the list of devices found during the last completed run of discovery and includes the method that was used to find them and other additional collected information.
•
•
•
–
–
–
–
–
–
•
View Debug Log Report
The Debug Log reports displays the Debug Log Viewer.
Procedure
Step 1
Step 2
Step 3
The Debug Log contains debug messages that support engineers and developers can use to troubleshoot issues during discovery. Enter a search string and/or select any additional filter criteria and click the Retrieve button to view the results in the browser, or use the Export button to export to Excel (xls).
The Debug Log viewer displays the following fields:
View Alert Log Report
The Alert Log report displays alert information generated during discovery. This includes any issues discovering the layer3 topology.
Procedure
Step 1
Step 2
Step 3
The Alert Log log contains messages that indicate reasons why certain devices were not discovered. This log is used for troubleshooting problems with discovery not finding all expected devices. Enter a search string and/or select any additional filter criteria and click the Retrieve button to view the results in the browser, or use the Export button to export to Excel (xls).
The Alert Log viewer displays the following fields:
Below are some potentially severe error messages that may get generated, indicating a problem during the Discovery process:
Error - DiscoveryAlert: SNMPNotSupported: Seed ip nn.nn.nn.nn does not support SNMP.
Meaning - Seed device could not be reached via SNMP.
Error - DiscoveryAlert: SNMPNotSupported: Seed ip nn.nn.nn.nn does not support CDP.
Meaning - Seed device could not be reached via CDP.
Error - DiscoveryAlert: CDPSNMPNotSupported: Default router(s) does not support SNMP/CDP.
Meaning: Default device could not be reached by either SNMP or CDP.
View Error Log Report
The Error Log report displays errors generated while discovering devices.
Procedure
Step 1
Step 2
Step 3
The Error Log contains error messages pertaining to exceptions that were caught during discovery. If there are lot of error messages that may indicate there was a significant problem during the discovery processing. Enter a search string and/or select any additional filter criteria and click the Retrieve button to view the results in the browser, or use the Export button to export to Excel (xls).
The Error Log viewer displays the following fields:
Below are some potentially severe error messages that may get generated, indicating a problem during the Discovery process:
Error - DiscMgrService: callCallback got exception.
Meaning - Discovery not able to return the status of a process.
Error - DiscMgrService: runSeedFileCreation got exception.
Meaning: An exception was generated while creating the seedfile.
Error - DiscMgrService:stopSeedFileCreation got exception.
Meaning - When stopping seedfile creation got exception.
Error - DiscMgrService:startDiscovery --got exception detail message.
Meaning - Discovery was not able to start.
VisioDB Creation
This tool generates a VisioDB file that can be opened in Visio 2000 where a network topology diagram can then be generated.
Procedure
Step 1
Step 2
Step 3
Step 4
Step 5
Step 6
Step 7
Step 8
Step 9
Step 10
Step 11
Step 12
Step 13
Step 14
Step 15
Find Device
The Find Device tool allows you to find a device based on its IP address, hostname, or a regular expression (XXX.*.*.* or *.*.*.XXX).
Procedure
Step 1
Step 2
Step 3
Step 4
Syslog
Viewing Syslog Events
The Syslog Scheduler creates and edits Syslog profiles. The Syslog Viewer allows you to view the syslog events and any correlation data collected by Syslog profiles. You can choose to view a subset of the collected syslog events by using the timer to specify the time interval of syslog manager.
There are four ways to sort syslog events:
•
•
•
•
The syslog events displayed are all the events collected by all the Syslog profiles previously created.
Note
Procedure
Step 1
Step 2
•
•
•
•
Caution
Step 3
Step 4
Step 5
Step 6
Click on a Device Name, (Error) Message Type, or Severity from the respective screen to view a detailed listing of the event.Scheduling Syslog
This screen is used to create or edit a Syslog Filter task. Up to five screens comprise Syslog Filter task creation:
•
•
–
–
–
•
•
•
Procedure
Step 1
Step 2
Step 3
Note
SNMP Poller
The SNMP Poller creates polling profiles to collect variable data and optionally perform correlation on the specific devices included in the profile. View Data by Profiles provides a view of the data collected by the SNMP Poller profiles.
View Polled Values
Displays the data collected by a specific SNMP Poller profile. The Select Profile screen allows you to choose a profile to view. View a "slice" of the data collected by the profile by setting the timer's start and end times to some portion of the profile's scheduled collection time.
Procedure
Step 1
Step 2
Step 3
Caution
Schedule Polling
The SNMP Poller tool creates polling profiles to filter all of the devices in your network. A polling profile issues SNMP commands to collect device variable data for the devices and variables specified. The simplest SNMP Poller profile polls the specified devices and collects the variable values.
The SNMP Poller allows you to create a polling profile that can be run at a pre-determined time of day for a specific length of time.
Procedure
Step 1
Note
Step 2
Caution
SNMP Poller: Correlation
This screen becomes available when changing the variable thresholds of a task from the SNMP Poller: Device and MIB Selection screen. The following can be done on this screen:
•
•
–
–
Device Variable Thresholds
Device variable thresholds are used to establish trigger points for the SNMP Poller to collect exceptions statistics.
A Poller profile polls the specified variables of the selected devices and, if a threshold is exceeded, collects and saves the information requested in NATKit. If you accept the default variable thresholds or create your own thresholds, then, in addition to data collection, your profile also posts exceptions to those thresholds in the Daily Report.
Correlation Setting
Change a selected variable's threshold without performing a correlation, or issue CLI commands to gather additional data about the devices that have returned an exception. This additional data can be sent to an external program, such as a spreadsheet program, for further analysis.
Correlation Rate Limit
When a variable's threshold has been exceeded, it is reported as an exception. While it is every exception should be reported, you may not want the correlation settings to run each time an exception occurs. Using the rate limit default setting specifies that correlation should be run no more than twice for every exception occurring within a one minute period.
The rate limit setting and the periodic timer setting are closely related. For the rate limit to work as a limiting restraint, its period must be greater than that of the periodic timer.
Data Collection
When a threshold violation has occurred, you may want to collect config data for that particular device. By checking Collect Device Configuration, the appropriate commands are issued as part of the correlation data collection.
There are four CLI command lines in the Cisco Device Data Gathering Commands section. In addition to config data collection, each command field can be used to specify one CLI command, such as sh proc CPU.
The Output field next to each command line allows you to specify where to put the incoming data from the CLI command. The output of all four commands can be sent to the same datastream or individual datastreams. The output is viewed using View Data By Profiles whether one or more datastreams are used. The only reason for using separate output datastreams is when sending the output to another external program for further analysis.
The Iterations and Time Interval fields allows you to specify how many times each CLI command should be run. The default is to run each CLI command twice with an interval of ten seconds between command issuance.
Data Analysis
Once device data has been collected by specifying certain CLI commands to be run, the data can be fed to external programs for further analysis. In addition, you can request that an email or pager notification be sent upon completion of the custom correlation.
Note
There are four commands lines in the Analysis Command Section. The command lines can be used to invoke any program available from within the NATKit server. Each command line has an associated Input and Output field. The Input list corresponds to the datastream output created when running a CLI command. Use the appropriate output data from a CLI command as input when invoking an external command.
Correlation Output
The output of the commands specified in Data Collection or Data Analysis are stored in their respective Data 1 through Data 4, or Analysis 1 through Analysis 4 boxes. If any of the items in the Correlation output boxes are checked, those buttons are saved so that they can be viewed.
An email address can be entered if you want to be notified if/when polling exceeds specified thresholds.
ProceduresCorrelation Setting
Step 1
Step 2
Correlation Rate Limit
Step 1
Step 2
Threshold Settings
Step 1
•
•
•
Step 2
Data Collection
Step 1
Step 2
Step 3
Step 4
Step 5
Data Analysis
Step 1
Step 2
Step 3
Correlation Output
Step 1
Step 2
Step 3
Step 4
Caution
Make sure that the Collect Device Configuration box is checked to perform Data Collection.
When running custom correlation, make sure a valid threshold value for each variable is included in each profile.
View Scheduled Tasks
Select Network Analysis Toolkit > SNMP Poller > Administration > View Scheduled Tasks to view all tasks scheduled using the Schedule Polling tool.
Change Task Status
The Change Task Status tool allows you to run, suspend, or delete a task scheduled using the SNMP Poller scheduler.
Procedure
Step 1
Step 2
Step 3
Step 4
WAN Switches
Schedule Trapd Log
The Trapd Spooler gathers and interprets messages logged in the trapd.log file of HP Open View for WAN Switching nodes based on your input.
Procedure
Step 1
Step 2
Step 3
Step 4
Step 5
Caution
Schedule CLI Collection for BPX/IPG/IPX
The CLI Scheduler is used to schedule the CLI Collection module in NATKit for BPX, IGX, and IPX devices. Specify the start and end times, or periodic time intervals at which this collection program is run.
Procedure
Step 1
Step 2
Step 3
Note
Step 4
Step 5
•
•
Step 6
Step 7
Schedule CLI Collection for MGX 8220 (Axis)
This screen is used to schedule a CLI command profile or user-specified commands for MGX 8220 devices. You can specify the start and end times, or periodic time intervals at which this collection program is run on one or more devices selected.
Procedure
Step 1
Step 2
Step 3
Note
Step 4
Step 5
•
•
•
Step 6
Step 7
Schedule CLI Collection for MGX 8230
The CLI Scheduler is used to schedule the CLI Collection module for the MGX 8230 device. The CLI Collection module captures the screen outputs for the commands entered for the profile selected and creates a file in the following format:
<task_name>_CLI_<nodename>_<command>.<timestamp>
This file is saved in the following directory:
/opt/CSCOpx/htdocs/NSA/COMPANIES/<natkid>/out/wansw
and can be viewed through the CLI Viewer for MGX 8230 device or by a text editor of your choice.
Procedure
Step 1
Step 2
Step 3
Note
Step 4
Step 5
•
•
•
Step 6
Step 7
Schedule CLI Collection for MGX 8250/8850 Release 1
This screen is used to schedule a CLI command profile or user-specified commands for MGX 8250/8850 devices. You can specify the start and end times, or periodic time intervals at which this collection program runs on one or more devices selected.
Procedure
Step 1
Step 2
Step 3
Step 4
Step 5
Step 6
•
•
•
Step 7
Step 8
Caution
Schedule CLI Collection for MGX 8850 Release 2
The CLI Scheduler is used to schedule the CLI Collection module for the MGX 8850 Release 2 device. The CLI Collection module captures the screen outputs for the commands entered for the profile selected and creates a file in the following format:
<task_name>_CLI_<nodename>_<command>.<timestamp>
This file is saved in the following directory:
/opt/CSCOpx/htdocs/NSA/COMPANIES/<natkid>/out/wansw
and can be viewed through the CLI Viewer for MGX 8850 Release 2 device or by a text editor of your choice.
Procedure
Step 1
Step 2
Step 3
Note
Step 4
Step 5
•
•
•
Step 6
Step 7
Schedule CLI Collection for MGX 8950
The CLI Scheduler is used to schedule the CLI Collection module for the MGX 8950 device. The CLI Collection module captures the screen outputs for the commands entered for the profile selected and creates a file in the following format:
<task_name>_CLI_<nodename>_<command>.<timestamp>
This file is saved in the following directory:
/opt/CSCOpx/htdocs/NSA/COMPANIES/<natkid>/out/wansw
and can be viewed through the CLI Viewer for MGX 8950 device or by a text editor of your choice.
Procedure
Step 1
Step 2
Step 3
Note
Step 4
Step 5
•
•
•
Step 6
Step 7
Schedule CLI Collection for BPX-SES
The CLI Scheduler is used to schedule the CLI Collection module for the BPX-SES device. The CLI Collection module captures the screen outputs for the commands entered for the profile selected and creates a file in the following format:
<task_name>_CLI_<nodename>_<command>.<timestamp>
This file is saved in the following directory:
/opt/CSCOpx/htdocs/NSA/COMPANIES/<natkid>/out/wansw
and can be viewed through the CLI Viewer for BPX-SES device or by a text editor of your choice.
Procedure
Step 1
Step 2
Step 3
Note
Step 4
Step 5
•
•
Step 6
Step 7
Schedule CLI Collection for BPX Report
The BPX Report Scheduler is used to schedule the CLI Collection module and parsing module for the selected BPX report. The CLI Collection module captures the screen outputs for the commands in the selected report and creates a file in the following format:
<task_name>_CLI_<nodename>.<timestamp>
This file is saved in the following directory:
/opt/CSCOpx/htdocs/NSA/COMPANIES/<natkid>/out/wansw
Since the reports are a collection of tables that are populated by parsing specific field from the CLI output, you must use the built in viewer and then select the appropriate device category. You can also save the tables in a CSV format to your local machine.
Procedure
Step 1
Step 2
Step 3
Note
Step 4
Step 5
Step 6
View Trapd Log
The Trapd Viewer allows you to view the contents of the trapd.log file of HP Open View for WAN Switching nodes. Display options include node name, alarm type, and message type.
Procedure
Step 1
Step 2
Step 3
Step 4
Step 5
Caution
View CLI Collection for BPX/IGX/IPX
The CLI viewer displays the output gathered from the CLI commands that capture the switch log, software logs, card and slot errors, CPU utilization, and memory blocks for BPX, IGX, and IPX switching nodes. The viewer displays output per profile, device, and run time.
Procedure
Step 1
Step 2
Step 3
Step 4
Step 5
Caution
View CLI Collection for MGX 8220 (Axis)
The CLI viewer displays the output gathered from the CLI commands that capture the switch log, software logs, card and slot errors, CPU utilization, and memory blocks for MGX 8220 (Axis) devices only. The viewer displays output per profile, device, and run time.
Procedure
Step 1
Step 2
Step 3
Note
Step 4
Note
Step 5
Step 6
•
•
•
Step 7
Step 8
•
•
•
Caution
View CLI Collection for MGX 8230
The CLI Viewer is used to view the CLI Collection module for MGX 8230 devices. The CLI viewer displays the raw data output for the various CLI commands in a given task.
Procedure
Step 1
Step 2
Step 3
Note
Step 4
Note
Step 5
Step 6
Step 7
Step 8
Click on the slot number to view the output for all commands for that device/slot.
Click on a command to view the output for just that command.View CLI Collection for MGX 8250/8850 Release 1
The CLI viewer displays the output gathered from the CLI commands that capture the switch log, software logs, card and slot errors, CPU utilization, and memory blocks for MGX 8250/8850 Release 1 devices only. The viewer displays output per profile, device, and run time.
Procedure
Step 1
Step 2
Step 3
Note
Step 4
Note
Step 5
Step 6
•
•
•
Step 7
Step 8
•
•
•
Caution
VIew CLI Collection for MGX 8850 Release 2
The CLI Viewer is used to view the CLI Collection module for MGX 8850 Rel2 devices. The CLI viewer displays the raw data output for the various CLI commands in a given task.
Procedure
Step 1
Step 2
Step 3
Note
Step 4
Note
Step 5
Step 6
Step 7
Step 8
Click on the slot number to view the output for all commands for that device/slot.
Click on a command to view the output for just that command.View CLI Collection for MGX 8950
The CLI Viewer is used to view the CLI Collection module for MGX 8950 devices. The CLI viewer displays the raw data output for the various CLI commands in a given task.
Procedure
Step 1
Step 2
Step 3
Note
Step 4
Note
Step 5
Step 6
Step 7
Step 8
Click on the slot number to view the output for all commands for that device/slot.
Click on a command to view the output for just that command.View CLI Collection for BPX-SES
The CLI Viewer is used to view the CLI Collection module for BPX-SES devices. The CLI viewer displays the raw data output for the various CLI commands in a given task.
Procedure
Step 1
Step 2
Step 3
Note
Step 4
Note
Step 5
Step 6
Step 7
Step 8
Click on the slot number to view the output for all commands for that device/slot.
Click on a command to view the output for just that command.View Scheduled Reports for BPX Devices
The Report Viewer is used to view the scheduled reports for BPX devices. The Report viewer displays the parsed data in various tables as defined by the specific report selected.
Procedure
Step 1
Step 2
Note
Step 3
Step 4
Step 5
Step 6
Step 7
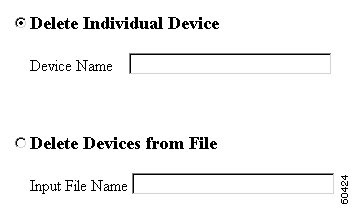
Delete WAN Switches
This screen allows you to delete an individual device or devices located in a file.
Procedure
Step 1
Step 2
Step 3
Step 4
Task Manager
View Scheduled Tasks
The NATKit Scheduler schedules new tasks, starts and ends tasks on time, and deletes the task context when instructed to do so. The scheduler is responsible for checking resource availability before starting a task. It also maintains statistics for how many times the task got started and ended, and its success or failure.
A Note About Tasks and Profiles
The terms task and profile are used somewhat interchangeably. A task such as an inventory task, or availability task may be scheduled. A profile is a configurable task. Currently only Syslog tasks (called Syslog Reporter files) are configurable.
NATKit System Tasks
In addition to scheduled tasks and profiles such as inventory, config, availability, syslog, and poller, Scheduler also maintains NATKit system tasks. These include:
•
•
•
•
•
•
•
•
•
•
The Scheduler Layout
Each row in the Scheduler represents a task and its properties.
•
•
•
•
•
•
•
•
•
•
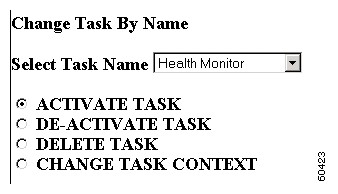
Change Task Settings
Changing the status of a task affects how a task is handled by the Scheduler. There are four ways to change the status of a task:
•
•
•
•
ProceduresActivating, De-Activating, and Deleting Tasks
Step 1
Step 2
Step 3
Step 4
Changing the Context of a Task
Step 1
Step 2
Step 3
Step 4
Step 5
Step 6
Caution
Download
The tools in this folder allow you to view the contents of all downloaded .tar files for each module on NATKit, as well as to schedule an on-demand download.
Show Download Files
All files in the downloaded .tar file for each module are expanded and displayed on this screen.
Procedure
Step 1
Step 2
Step 3
Download Now
Use this screen to schedule an on-demand download.
Procedure
Step 1
Step 2
Step 3
Logs and Errors
NATKit creates error reports and message logs for all the tasks carried out by NATKit. Each tool, SNMP Poller, Syslog, System Logs, Scheduler, Inventory, Configs, Seedfile Manager, Domain Manager, Integration Manager, GUI, Access Verifier, Downloader, Event Statistics, and Transient has a corresponding error report and message log.
The error reports list any problems encountered while trying to perform data collection. The message logs track various data collection events, depending on which tool's log is being viewed.
In addition to each tool, there is an error report and message log for NATKit's system processes that collects similar information. System error reports and messages logs have static and dynamic views.
Logging, Error Rotation and Reporting Levels
In order to conserve disk space, NATKit controls the size of log and error files by using two mechanisms:
•
•
Error Report and Message Log Format
Each message log and error report follows a similar, tabular format. Information for each recorded event includes:
•
•
•
•
ProcedureLog and Error messages can be viewed in one of the following four ways:
•
•
•
•
Viewing by Process ID
Step 1
Step 2
Step 3
Step 4
Step 5
Step 6
Viewing by Priority Level
Step 1
Step 2
Step 3
Step 4
Step 5
Step 6
Viewing by Time
Step 1
Step 2
Step 3
Step 4
Step 5
Step 6
Viewing All Messages
Step 1
Step 2
Step 3
Step 4
Step 5
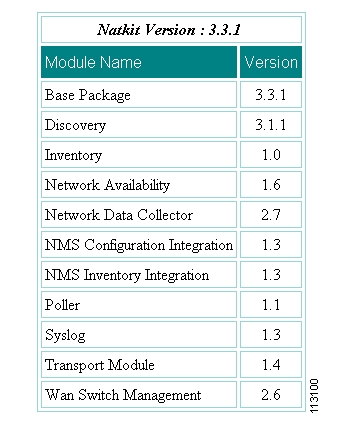
About NATKit
This function allows you to check the version number of the NATKit system and the modules installed in the system.
Procedure
Step 1
Step 2
Net Audit
Timesaver
The Net Audit folder consists of tools used to collect data for Net Audits, define and verify access for devices, and monitor data collection with real-time statuses.
Register Audit
An authentication key is provided by the Cisco NATKit Support Engineer. Please contact your Advanced Services Engineer for details on registering your audit.
Net Audit Settings
The initialization phase of setting up an audit is done here. The screen shows Audit ID and the Audit Type depending upon the authentication key assigned by Cisco and entered by the Cisco NATKit support engineer at the time of audit scheduling. The following information can be verified and entered on this screen:
Note
Procedure
Step 1
Note
Step 2
Step 3
Step 4
Step 5
Step 6
Device Selection
All eligible routers and/or switches added or imported appear in their respective Switch or Router screen. Select one or more of each to include in the audit. The devices selected are tested using the Access Verifier as explained in the Schedule Access Verification section. Devices on the Switch and Router screens appear in one of the following two columns:
•
•
Note
Procedure
Step 1
Step 2
Step 3
Note
Step 4
Step 5
Step 6
Note
Step 7
Access Verification
Refer to Schedule Access Verification located earlier in this chapter for more information on scheduling access verification.
Data Collection
You can start the data collection immediately or use the scheduler to set a time within in the next five years to begin data collection. You can stop data collection or change the schedule at any time. When scheduling a data collection, the following parameters can be set:
•
•
•
•
•
Start a Data Collection
Step 1
Step 2
Step 3
Note
Schedule a Data Collection
Step 1
Step 2
Step 3
Step 4
Step 5
Step 6
Step 7
Note
Step 8
Note
Data Collection Status
The Data Collection Status screen allows you to monitor the status of the current data collection process. The information displayed on this page reflects cumulative data for all routers and switches from the beginning of the collection up to the time the Data Collection Status screen was accessed. The Net Audit Success Rate is used to determine the success/failure of the audit. The success rate must be 80% or higher for the audit to pass.
The node status can be in one of three states:
•
•
•
Note
Procedure
Step 1
Step 2
Step 3
Note
![]()
![]()
![]()
![]()
![]()
![]()
![]()
![]()
Posted: Tue May 11 04:51:18 PDT 2004
All contents are Copyright © 1992--2004 Cisco Systems, Inc. All rights reserved.
Important Notices and Privacy Statement.