|
|

The VPN 3002 tracks many statistics and the status of many items essential to system administration and management. This section of the Manager lets you view all those status items and statistics. You can even see the state of LEDs that show the status of hardware subsystems in the device. You can also see statistics that are stored and available in standard MIB-II data objects.
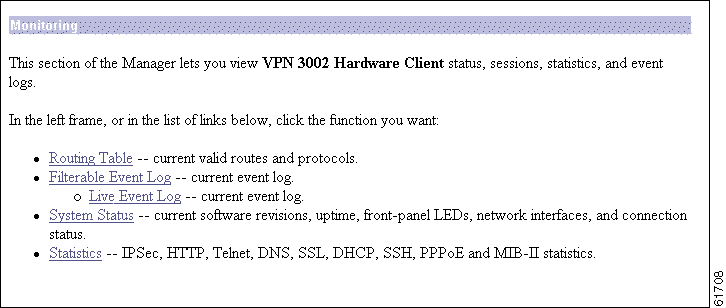
This section of the Manager lets you view VPN 3002 status, sessions, statistics, and event logs.
These Manager screens are read-only "snapshots" of data or status at the time the screen displays. Most screens have a Refresh button that you can click to get a fresh snapshot and update the screen, but you cannot modify the data on the screen.
This screen shows the VPN 3002 routing table at the time the screen displays.

Refresh | To update the screen and its data, click Refresh. The date and time indicate when the screen was last updated. |
Clear Routes | Clears the dynamic routing entries from the display. Clicking this button does not affect the display of static routing entries. |
Valid Routes | The total number of current valid routes that the VPN 3002 knows about. This number includes all valid routes, and it might be greater than the number of rows in the routing table, which shows only the best routes with duplicates removed. |
Address | The packet destination IP address that this route applies to. This address is combined with the subnet mask to determine the destination route. 0.0.0.0 indicates the default gateway. |
Mask | The subnet mask for the destination IP address in the Address field. 0.0.0.0 indicates the default gateway. |
Next Hop | For remote routes, the IP address of the next system in the path to the destination. 0.0.0.0 indicates a local route; that is, there is no next hop. |
Interface | The VPN 3002 network interface through which traffic moves on this route:
|
Protocol | The protocol or source of this routing table entry:
|
Age | The number of seconds since this route was last updated or otherwise validated. The age is relative to the screen display time; for example, 25 means the route was last validated 25 seconds before the screen was displayed. 0 indicates a static, local, or default route. |
Metric | The metric, or cost, of this route. 1 is lowest, 16 is highest. |
This screen shows the events in the current event log, lets you filter and display events by various criteria, and lets you manage the event log file. For troubleshooting any system difficulty, or just to examine details of system activity, consult the event log first.
The VPN 3002 records events in nonvolatile memory, thus the event log persists even if the system is powered off. It holds 256 events, and it wraps when it is full (that is, entry 257 overwrites entry 1, etc.). Use the scroll controls (if present) to display more events in the log.
To configure event handling, see the Configuration | System | Events screens.
To Get, Save, or Clear the event log file, you must have Access Rights to Read/Write Files. See the Administration | Administrators | Modify Properties screen.
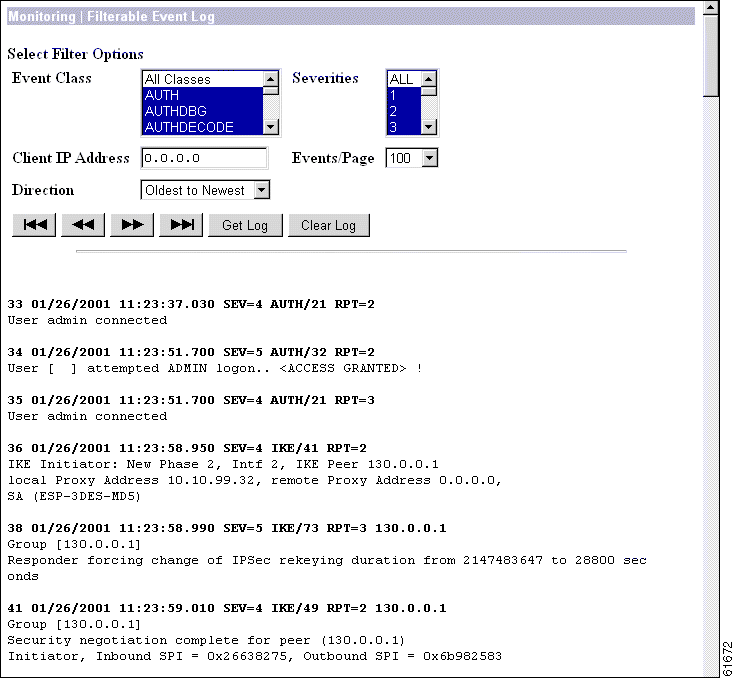
You can select any or all of the following options for filtering and displaying the event log. After selecting the option(s), click any one of the four Page buttons. The Manager refreshes the screen and displays the event log according to your selections.
Your filter options remain in effect as long as you continue working within and viewing Monitoring | Filterable Event Log screens. The Manager resets all options to their defaults if you leave and return, or if you click Filterable Event Log in the left frame of the Manager window (the table of contents). You cannot save filter options.
Event Class | To display all the events in a single event class, click the drop-down menu button and select the event class. To select a contiguous range of event classes, select the first class in the range, hold down the keyboard Shift key, and select the last class in the range. To select multiple event classes, select the first class, hold down the keyboard Ctrl key, and select the other classes. By default, the Manager displays All Classes of events. Table 9-4 under Configuration | System | Events describes the event classes. | ||
Severities | To display all events of a single severity level, click the drop-down menu button and select the severity level. To select a contiguous range of severity levels, select the first severity level in the range, hold down the keyboard Shift key, and select the last severity level in the range. To select multiple severity levels, select the first severity level, hold down the keyboard Ctrl key, and select the other severity levels. By default, the Manager displays All severity levels. See Table 9-4 under Configuration | System | Events for an explanation of severity levels. | ||
Client IP Address | To display all events relating to a single IP address, enter the IP address in the field using dotted decimal notation; for example, 10.10.1.35. By default, the Manager displays all IP addresses. To restore the default, enter 0.0.0.0. | ||
Events/Page | To display a given number of events per Manager screen (page), click the drop-down menu button and select the number. Choices are 10, 25, 50, 100, 250, and ALL. By default, the Manager displays 100 events per screen. | ||
Direction | To display events in a different chronological order, click the drop-down menu button and select the order. Choices are:
Newest to Oldest = Display events in reverse chronological order, with newest events at the top of the screen. | ||
First Page | To display the first page (screen) of the event log, click this button. By default, the Manager displays the first page of the event log when you first open this screen. | ||
Previous Page | To display the previous page (screen) of the event log, click this button. | ||
Next Page | To display the next page (screen) of the event log, click this button. | ||
Last Page | To display the last page (screen) of the event log, click this button. All four Page buttons are also present at the bottom of the screen. | ||
To download the event log from VPN 3002 memory to your PC and view it or save it as a text file, click Get Log. The Manager opens a new browser window to display the file. The browser address bar shows the VPN 3002 address and log file default filename; for example, To save a copy of the log file on your PC, click the File menu on the new browser window and select Save As.... The browser opens a dialog box that lets you save the file. The default filename is Alternatively, you can use the secondary mouse button to click Get Log on this Monitoring | Filterable Event Log screen. A pop-up menu presents choices whose exact wording depends on your browser, but among them are:
When you are finished viewing or saving the file, close the new browser window. | |||
To clear the current event log from memory, click this button. The Manager then refreshes the screen and shows the empty log.
|
Each entry (record) in the event log consists of eight or nine fields:
Sequence Date Time Severity Class/Number Repeat (IPAddress)

String
(The IPAddress field only appears in certain events.)
For example:
3 12/06/2001 14:37:06.680 SEV=4 HTTP/47 RPT=17 10.10.1.35

New administrator login: admin.
Event Sequence | The sequential number of the logged entry. Numbering starts or restarts from 1 when the system powers up, when you save the event log, or when you clear the event log. When the log file wraps after 256 entries, numbering continues with event 257 overwriting event 1. Although numbering restarts at 1 when the system powers up, it does not overwrite existing entries in the event log; it appends them. Assuming the log does not wrap, it could contain several sequences of events starting at 1. Thus you can examine events preceding and following reboot or reset cycles. |
Event Date | The date of the event: MM/DD/YYYY. For example, 12/06/2001 identifies an event that occurred on December 6, 2001. |
Event Time | The time of the event: hour:minute:second.millisecond. The hour is based on a 24-hour clock. For example, 14:37:06.680 identifies an event that occurred at 2:37:06.680 PM. |
Event Severity | The severity level of the event; for example: SEV=4 identifies an event of severity level 4. See Table 9-4 under Configuration | System | Events for an explanation of severity levels. |
Event Class/Number | The class—or source—of the event, and the internal reference number associated with the specific event within the event class. For example: HTTP/47 indicates that an administrator logged in to the VPN 3002 using HTTP to connect to the Manager. Table 9-2 under Configuration | System | Events describes the event classes. The internal reference number assists Cisco support personnel if they need to examine a log file. |
Event Repeat | The number of times that this specific event has occurred since the VPN 3002 was last booted or reset. For example, RPT=17 indicates that this is the seventeenth occurrence of this specific event. |
Event IP address | The IP address of the client or host associated with this event. Only certain events have this field. For tunnel-related events, this is typically the "outer" or tunnel endpoint address. In the Event log format example above, 10.10.1.35 is the IP address of the host PC from which admin logged in using the Manager. |
Event String | The string, or message, that describes the specific event. Each event class comprises many possible events, and the string gives a brief description. Event strings usually do not exceed 80 characters. In the Event log format example above, "New administrator login: admin" describes the event. |
This screen shows events in the current event log and automatically updates the display every 5 seconds. The events might take a few seconds to load when you first open the screen.
Note for Netscape users:
The live event log requires Netscape version 4.5 or higher. It does not run on other versions of Netscape.
The screen always displays the most recent event at the bottom. Use the scroll bar to view earlier events. To filter and display events by various criteria, see the Monitoring | Filterable Event Log section above.
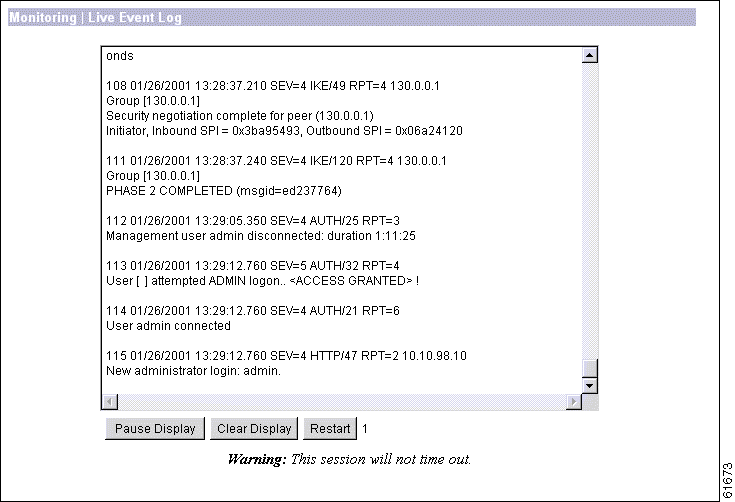
To pause the display, click Pause Display. While paused, the screen does not display new events, the button changes to Resume Display, and the timer counts down to 0 and stops. You can still scroll through the event log. Click the button to resume the display of new events and restart the timer.
To clear the event display, click Clear Display. This action does not clear the event log, only the display of events on this screen.
To clear the event display and reload the entire event log in the display, click Restart.
The timer counts 5 - 4 - 3 - 2 - 1 to show where it is in the 5-second refresh cycle. A momentary Rx indicates receipt of new events. A steady 0 indicates the display has been paused.
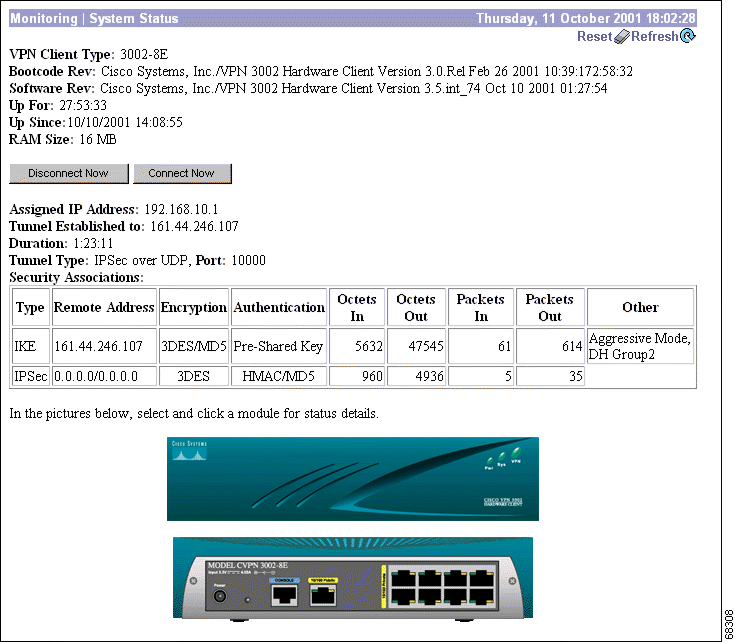
This screen shows the status of several software and hardware variables at the time the screen displays. From this screen you can also display the status of the IPSec tunnel SAs, tunnel duration, plus front and rear panel displays of the VPN 3002.
To reset, or start anew, the screen contents, click Reset. The system temporarily resets a counter for the chosen statistics without affecting the operation of the device. You can then view statistical information without affecting the actual current values of the counters or other management sessions. The function is like that of a vehicle's trip odometer, versus the regular odometer.
To restore the screen contents to their actual statistical values, click Restore. This icon displays only if you previously clicked the Reset icon.
To update the screen and its data, click Refresh. The date and time indicate when the screen was last updated.
The type, or model number, of this VPN 3002 hardware client.
The version name, number, and date of the VPN 3002 bootcode software file. When you boot or reset the system, the bootcode software runs system diagnostics, and it loads and executes the system software image. The bootcode is installed at the factory, and there is no need to upgrade it. If an engineering change requires a bootcode upgrade, only Cisco support personnel can do so.
The version name, number, and date of the VPN 3002 Hardware Client system software image file. You can update this image file from the Administration | Software Update screen.
The date and time that the VPN 3002 was last booted or reset.
The total amount of SDRAM memory installed in the VPN 3002.
Disconnects the tunnel.
Connects the tunnel.
The IP address assigned to the VPN 3002 by the central-site VPN Concentrator when PAT mode is enabled. This field is not displayed when the VPN 3002 is running in Network Extension mode, because the central-site VPN Concentrator does not assign an IP address to the VPN 3002 in Network Extension mode.
The IP address of the VPN Concentrator to which this VPN 3002 connects.
The length of time that this tunnel has been up.
This table describes the following attributes of the SAs for this VPN 3002.
The type of tunnel for this SA, either IPSec or IKE (the control tunnel).
Network/subnet mask for this split-tunneled SA.
The encryption method this SA uses.
The authentication method this SA uses.
The number of octets (bytes) this SA has received since the tunnel has been up.
The number of octets (bytes) this SA has sent since the tunnel has been up.
The number of packets this SA has received since the tunnel has been up.
The number of packets this SA has sent since the tunnel has been up.
Additional information about this SA, including mode.
The front panel image is an inactive link.
The back panel image includes active links for the VPN 3002 private and public interfaces Use the mouse pointer to select either the private or public module on the back-panel image and click anywhere in the highlighted area. The Manager displays the appropriate Monitoring | System Status | Interface screen.
This screen displays status and statistics for a VPN 3002 Ethernet interface. To configure an interface, see Configuration | Interfaces.
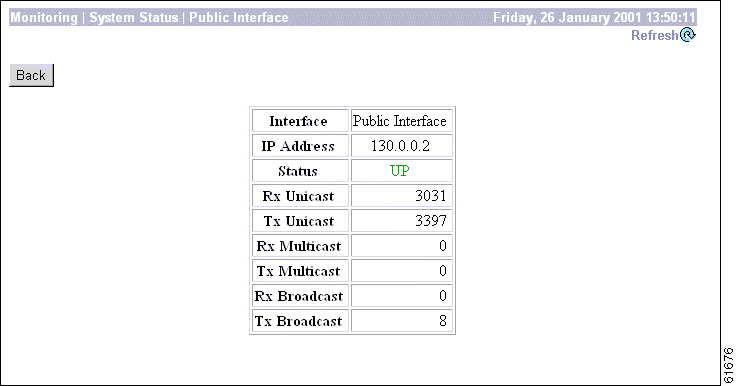
To reset, or start anew, the screen contents, click Reset. The system temporarily resets a counter for the chosen statistics without affecting the operation of the device. You can then view statistical information without affecting the actual current values of the counters or other management sessions. The function is like that of a vehicle's trip odometer, versus the regular odometer.
To restore the screen contents to their actual statistical values, click Restore. This icon displays only if you previously clicked the Reset icon.
To update the screen and its data, click Refresh. The date and time indicate when the screen was last updated.
To return to the Monitoring | System Status screen, click Back.
The VPN 3002 Ethernet interface number:
The IP address configured on this interface.
The operational status of this interface:
The number of unicast packets that were received by this interface since the VPN 3002 was last booted or reset. Unicast packets are those addressed to a single host.
The number of unicast packets that were routed to this interface for transmission since the VPN 3002 was last booted or reset, including those that were discarded or not sent. Unicast packets are those addressed to a single host.
The number of multicast packets that were received by this interface since the VPN 3002 was last booted or reset. Multicast packets are those addressed to a specific group of hosts.
The number of multicast packets that were routed to this interface for transmission since the VPN 3002 was last booted or reset, including those that were discarded or not sent. Multicast packets are those addressed to a specific group of hosts.
The number of broadcast packets that were received by this interface since the VPN 3002 was last booted or reset. Broadcast packets are those addressed to all hosts on a network.
The number of broadcast packets that were routed to this interface for transmission since the VPN 3002 was last booted or reset, including those that were discarded or not sent. Broadcast packets are those addressed to all hosts on a network.
This section displays statistics for devices behind the VPN 3002 Hardware Client.

To update the screen and its data, click Refresh. The date and time indicate when the screen was last updated.
Indicates whether the Cisco IP Phone Bypass feature is enabled or disabled for the VPN 3002. This feature is enabled or disabled for the group on the VPN Concentrator to which the VPN 3002 belongs. For more information, see Configuration | User Management | Base Group/Groups, Hardware Client tab for the VPN Concentrator.
The username for the session.
The IP address of the device logged in behind the VPN 3002.
The MAC address for the device logged in behind the VPN 3002.
The date and time of day when the user logged in to the VPN 3002.
The length of time that the user has been logged in; the format is hh:mm:ss.
Possible actions: Ping and Logout.
This section of the Manager shows statistics for traffic and activity on the VPN 3002 since it was last booted or reset, and for current tunneled sessions, plus statistics in standard MIB-II objects for interfaces, TCP/UDP, IP, ICMP, the ARP table, and SNMP.
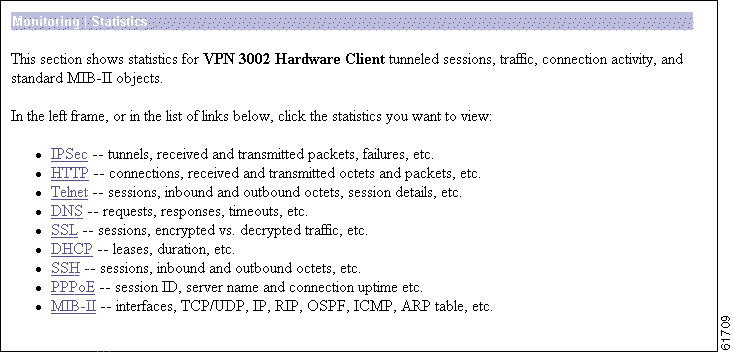
This screen shows statistics for IPSec activity, including the current IPSec tunnel, on the VPN 3002 since it was last booted or reset. These statistics conform to the IETF draft for the IPSec Flow Monitoring MIB.
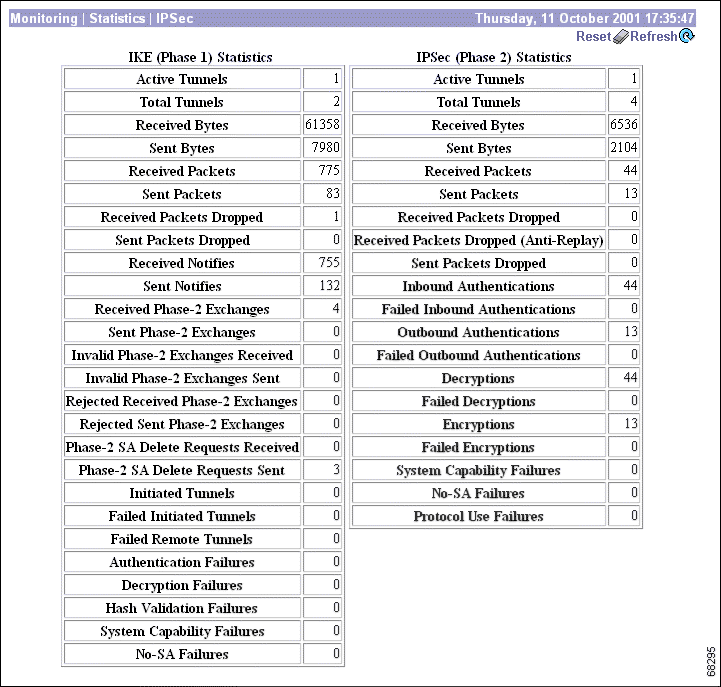
To reset, or start anew, the screen contents, click Reset. The system temporarily resets a counter for the chosen statistics without affecting the operation of the device. You can then view statistical information without affecting the actual current values of the counters or other management sessions. The function is like that of a vehicle's trip odometer, versus the regular odometer.
To restore the screen contents to their actual statistical values, click Restore. This icon displays only if you previously clicked the Reset icon.
To update the screen and its data, click Refresh. The date and time indicate when the screen was last updated.
This table provides IPSec Phase 1 (IKE: Internet Key Exchange) global statistics. During IPSec
Phase 1 (IKE), the two peers establish control tunnels through which they negotiate Security Associations.
The number of currently active IKE control tunnels.
The cumulative total of all currently and previously active IKE control tunnels.
The cumulative total of bytes (octets) received by all currently and previously active IKE tunnels.
The cumulative total of bytes (octets) sent by all currently and previously active IKE tunnels.
The cumulative total of packets received by all currently and previously active IKE tunnels.
The cumulative total of packets sent by all currently and previously active IKE tunnels.
The cumulative total of packets that were dropped during receive processing by all currently and previously active IKE tunnels. If there is a problem with the content of a packet, such as hash failure, parsing error, or encryption failure, received in Phase 1 or the negotiation of Phase 2, the system drops the packet. This number should be zero or very small; if not, check for misconfiguration.
The cumulative total of packets that were dropped during send processing by all currently and previously active IKE tunnels. This number should be zero; if not, check for a network problem, check the event log for an internal subsystem failure, or contact Cisco support.
The cumulative total of notify packets received by all currently and previously active IKE tunnels. A notify packet is an informational packet that is sent in response to a bad packet or to indicate status; for example, error packets, keepalive packets, etc.
The cumulative total of notify packets sent by all currently and previously active IKE tunnels. See comments for Received Notifies above.
The cumulative total of IPSec Phase-2 exchanges received by all currently and previously active IKE tunnels; that is, the total of Phase-2 negotiations received that were initiated by a remote peer. A complete exchange consists of three packets.
The cumulative total of IPSec Phase-2 exchanges that were sent by all currently and previously active and IKE tunnels; that is, the total of Phase-2 negotiations initiated by this VPN 3002.
The cumulative total of IPSec Phase-2 exchanges that were received, found to be invalid because of protocol errors, and dropped, by all currently and previously active IKE tunnels. In other words, the total of Phase-2 negotiations that were initiated by a remote peer but that this VPN 3002 dropped because of protocol errors.
The cumulative total of IPSec Phase-2 exchanges that were sent and were found to be invalid, by all currently and previously active IKE tunnels.
The cumulative total of IPSec Phase-2 exchanges that were initiated by a remote peer, received, and rejected by all currently and previously active IKE tunnels. Rejected exchanges indicate policy-related failures, such as configuration problems.
The cumulative total of IPSec Phase-2 exchanges that were initiated by this VPN 3002, sent, and rejected, by all currently and previously active IKE tunnels. See comment above.
The cumulative total of requests to delete IPSec Phase-2 Security Associations received by all currently and previously active IKE tunnels.
The cumulative total of requests to delete IPSec Phase-2 Security Associations sent by all currently and previously active IKE tunnels.
The cumulative total of IKE tunnels that this VPN 3002 initiated.
The cumulative total of IKE tunnels that this VPN 3002 initiated and that failed to activate.
The cumulative total of IKE tunnels that remote peers initiated and that failed to activate.
The cumulative total of authentication attempts that failed, by all currently and previously active IKE tunnels. Authentication failures indicate problems with preshared keys, digital certificates, or user-level authentication.
The cumulative total of decryptions that failed, by all currently and previously active IKE tunnels.
The cumulative total of hash validations that failed, by all currently and previously active IKE tunnels. Hash validation failures usually indicate misconfiguration or mismatched preshared keys or digital certificates.
The cumulative total of system capacity failures that occurred during processing of all currently and previously active IKE tunnels. These failures indicate that the system has run out of memory, or that the tunnel count exceeds the system maximum.
The cumulative total of nonexistent-Security Association failures that occurred during processing of all currently and previously active IKE tunnels. These failures occur when the system receives a packet for which it has no Security Association, and might indicate synchronization problems.
This table provides IPSec Phase 2 global statistics. During IPSec Phase 2, the two peers negotiate Security Associations that govern traffic within the tunnel.
The number of currently active IPSec Phase-2 tunnels.
The cumulative total of all currently and previously active IPSec Phase-2 tunnels.
The cumulative total of bytes (octets) received by all currently and previously active IPSec Phase-2 tunnels, before decompression. In other words, total bytes of IPSec-only data received by the IPSec subsystem, before decompressing the IPSec payload.
The cumulative total of bytes (octets) sent by all currently and previously active IPSec Phase-2 tunnels, after compression. In other words, total bytes of IPSec-only data sent by the IPSec subsystem, after compressing the IPSec payload.
The cumulative total of packets received by all currently and previously active IPSec Phase-2 tunnels.
The cumulative total of packets sent by all currently and previously active IPSec Phase-2 tunnels.
The cumulative total of packets dropped during receive processing by all currently and previously active IPSec Phase-2 tunnels, excluding packets dropped due to anti-replay processing. If there is a problem with the content of a packet, the system drops the packet. This number should be zero or very small; if not, check for misconfiguration.
The cumulative total of packets dropped during receive processing due to anti-replay errors, by all currently and previously active IPSec Phase-2 tunnels. If the sequence number of a packet is a duplicate or out of bounds, there might be a faulty network or a security breach, and the system drops the packet.
The cumulative total of packets dropped during send processing by all currently and previously active IPSec Phase-2 tunnels. This number should be zero; if not, check for a network problem, check the event log for an internal subsystem failure, or contact Cisco support.
The cumulative total number of inbound individual packet authentications performed by all currently and previously active IPSec Phase-2 tunnels.
The cumulative total of inbound packet authentications that failed, by all currently and previously active IPSec Phase-2 tunnels. Failed authentications could indicate corrupted packets or a potential security attack ("man in the middle").
The cumulative total of outbound individual packet authentications performed by all currently and previously active IPSec Phase-2 tunnels.
The cumulative total of outbound packet authentications that failed, by all currently and previously active IPSec Phase-2 tunnels. This number should be zero or very small; if not, check the event log for an internal IPSec subsystem problem.
The cumulative total of inbound decryptions performed by all currently and previously active IPSec Phase-2 tunnels.
The cumulative total of inbound decryptions that failed, by all currently and previously active IPSec Phase-2 tunnels. This number should be zero or very small; if not, check for misconfiguration.
The cumulative total of outbound encryptions performed by all currently and previously active IPSec Phase-2 tunnels.
The cumulative total of outbound encryptions that failed, by all currently and previously active IPSec Phase-2 tunnels. This number should be zero or very small; if not, check the event log for an internal IPSec subsystem problem.
The total number of system capacity failures that occurred during processing of all currently and previously active IPSec Phase-2 tunnels. These failures indicate that the system has run out of memory or some other critical resource; check the event log.
The cumulative total of nonexistent-Security Association failures which occurred during processing of all currently and previously active IPSec Phase-2 tunnels. These failures occur when the system receives an IPSec packet for which it has no Security Association, and might indicate synchronization problems.
The cumulative total of protocol use failures that occurred during processing of all currently and previously active IPSec Phase-2 tunnels. These failures indicate errors parsing IPSec packets.
This screen shows statistics for HTTP activity on the VPN 3002 since it was last booted or reset.
To configure system-wide HTTP server parameters, see the Configuration | System | Management | Protocols | HTTP screen.
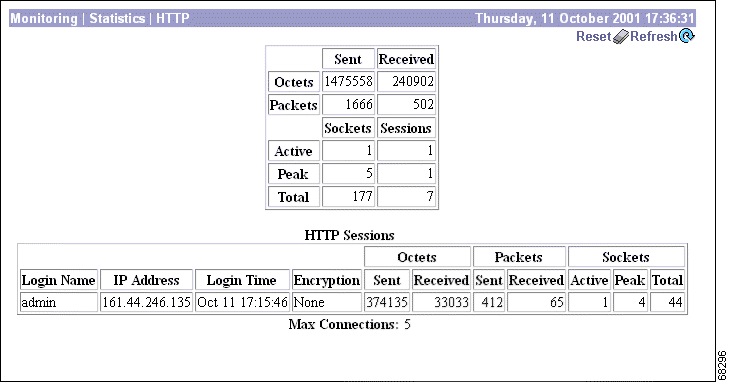
To reset, or start anew, the screen contents, click Reset. The system temporarily resets a counter for the chosen statistics without affecting the operation of the device. You can then view statistical information without affecting the actual current values of the counters or other management sessions. The function is like that of a vehicle's trip odometer, versus the regular odometer.
To restore the screen contents to their actual statistical values, click Restore. This icon displays only if you previously clicked the Reset icon.
To update the screen and its data, click Refresh. The date and time indicate when the screen was last updated.
The total number of HTTP octets (bytes) sent or received since the VPN 3002 was last booted or reset.
The total number of HTTP packets sent or received since the VPN 3002 was last booted or reset.
The number of HTTP connections for the VPN 3002.
The number of currently active HTTP connections on the VPN 3002.
The maximum number of HTTP connections that were simultaneously active on the VPN 3002 since it was last booted or reset.
The total number of HTTP connections on the VPN 3002 since it was last booted or reset.
This section provides information about HTTP sessions on the VPN 3002 since it was last booted or reset.
The name of the administrative user for the HTTP session.
The IP address of administrative user for the HTTP session.
The time when the HTTP session began.
The encryption method used in the HTTP session.
Number of octets sent or received during the HTTP session.
Number of packets sent or received during the HTTP session.
The number of currently active sockets for the HTTP session.
The maximum number of sockets simultaneously active during the HTTP session.
The total number of sockets active during the HTTP session.
The maximum number of concurrent HTTP connections for the VPN 3002 since it was last rebooted or reset.
This screen shows statistics for Telnet activity on the VPN 3002 since it was last booted or reset, and for current Telnet sessions.
To configure the VPN 3002 Telnet server, see the Configuration | System | Management Protocols | Telnet screen.

To reset, or start anew, the screen contents, click Reset. The system temporarily resets a counter for the chosen statistics without affecting the operation of the device. You can then view statistical information without affecting the actual current values of the counters or other management sessions. The function is like that of a vehicle's trip odometer, versus the regular odometer.
To restore the screen contents to their actual statistical values, click Restore. This icon displays only if you previously clicked the Reset icon.
To update the screen and its data, click Refresh. The date and time indicate when the screen was last updated.
The number of active Telnet sessions. The Telnet Sessions table shows statistics for these sessions.
The total number of attempts to establish Telnet sessions on the VPN 3002 since it was last booted or reset.
The total number of Telnet sessions successfully established on the VPN 3002 since it was last booted or reset.
This table shows statistics for active Telnet sessions on the VPN 3002. Each active session is a row.
The IP address and TCP source port number of the remote Telnet client for this session.
The total number of Telnet octets (bytes) received by this session.
The number of octets (bytes) containing Telnet commands or options, received by this session.
The number of Telnet octets (bytes) received and dropped during input processing by this session.
The total number of Telnet octets (bytes) transmitted by this session.
The number of outbound Telnet octets dropped during output processing by this session.
This screen shows statistics for DNS (Domain Name System) activity on the VPN 3002 since it was last booted or reset.
To configure the VPN 3002 to communicate with DNS servers, see the Configuration | System | Servers | DNS screen.

To reset, or start anew, the screen contents, click Reset. The system temporarily resets a counter for the chosen statistics without affecting the operation of the device. You can then view statistical information without affecting the actual current values of the counters or other management sessions. The function is like that of a vehicle's trip odometer, versus the regular odometer.
To restore the screen contents to their actual statistical values, click Restore. This icon displays only if you previously clicked the Reset icon.
To update the screen and its data, click Refresh. The date and time indicate when the screen was last updated.
The total number of DNS queries the VPN 3002 made since it was last booted or reset. This number equals the sum of the numbers in the Responses, Timeouts, Server Unreachable and Other Failures fields (the four fields that follow).
The number of DNS queries that were successfully resolved.
The number of DNS queries that failed because there was no response from the server.
The number of DNS queries that failed because, according to the VPN 3002 routing table, the address of the server is not reachable.
The number of DNS queries that failed for an unspecified reason.
This screen shows statistics for SSL (Secure Sockets Layer) protocol traffic on the VPN 3002 since it was last booted or reset.
To configure SSL, see Configuration | System | Management Protocols | SSL.

To reset, or start anew, the screen contents, click Reset. The system temporarily resets a counter for the chosen statistics without affecting the operation of the device. You can then view statistical information without affecting the actual current values of the counters or other management sessions. The function is like that of a vehicle's trip odometer, versus the regular odometer.
To restore the screen contents to their actual statistical values, click Restore. This icon displays only if you previously clicked the Reset icon.
To update the screen and its data, click Refresh. The date and time indicate when the screen was last updated.
The number of octets (bytes) of inbound traffic output by the decryption engine.
The number of octets (bytes) of encrypted inbound traffic sent to the decryption engine. This number includes negotiation traffic.
The number of unencrypted outbound octets (bytes) sent to the encryption engine.
The number of octets (bytes) of outbound traffic output by the encryption engine. This number includes negotiation traffic.
The total number of SSL sessions.
The number of currently active SSL sessions.
The maximum number of SSL sessions simultaneously active at any one time.
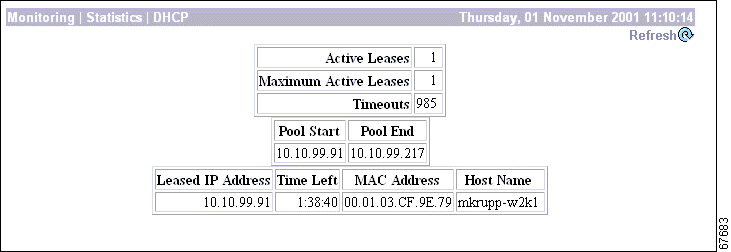
This screen shows statistics for DHCP (Dynamic Host Configuration Protocol) server activity on the VPN 3002 since it was last booted or reset. Each row of the table shows data for each IP address handed out to a DHCP client (PC) on the VPN 3002 private network.
To configure the DHCP server, see Configuration | System | IP Routing | DHCP.
To reset, or start anew, the screen contents, click Reset. The system temporarily resets a counter for the chosen statistics without affecting the operation of the device. You can then view statistical information without affecting the actual current values of the counters or other management sessions. The function is like that of a vehicle's trip odometer, versus the regular odometer.
To restore the screen contents to their actual statistical values, click Restore. This icon displays only if you previously clicked the Reset icon.
To update the screen and its data, click Refresh. The date and time indicate when the screen was last updated.
The number of DHCP leases currently active.
The maximum number of DHCP leases simultaneously active at any one time.
The number of DHCP queries that failed because there was no response from the server.
The IP address at the start of the DHCP IP address pool.
The IP address at the end of the DHCP IP address pool.
The IP address leased from the DHCP server by the remote client.
The time remaining until the current IP address lease expires, shown as HH:MM:SS.
The hardwired MAC (Medium Access Control) address of the interface, in 6-byte hexadecimal notation, that maps to the IP Address.
The name of the DHCP client (PC) on this interface.
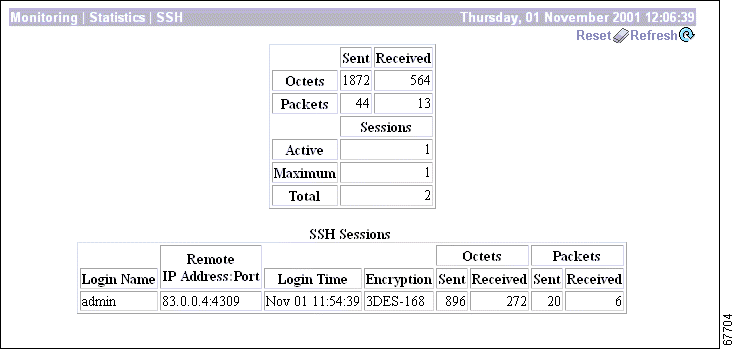
This screen shows statistics for SSH (Secure Shell) protocol traffic on the VPN 3002 since it was last booted or reset.
To configure SSH, see Configuration | System | Management Protocols | SSH.
To reset, or start anew, the screen contents, click Reset. The system temporarily resets a counter for the chosen statistics without affecting the operation of the device. You can then view statistical information without affecting the actual current values of the counters or other management sessions. The function is like that of a vehicle's trip odometer, versus the regular odometer.
To restore the screen contents to their actual statistical values, click Restore. This icon displays only if you previously clicked the Reset icon.
To update the screen and its data, click Refresh. The date and time indicate when the screen was last updated.
The total number of SSH octets (bytes) sent/received since the VPN 3002 was last booted or reset.
The total number of SSH packets sent/received since the VPN 3002 was last booted or reset.
The number of currently active SSH sessions.
The maximum number of simultaneously active SSH sessions on the VPN 3002.
The total number of SSH sessions since the VPN 3002 was last booted or reset.
Presents details on SSH sessions.
The name of the administrator using the session.
The remote IP address for the session.
The time of day when the login for the session occurred.
The type of encryption algorithm used for the session.
The number of octets sent and received during the session.
The number of packets sent and received during the session.
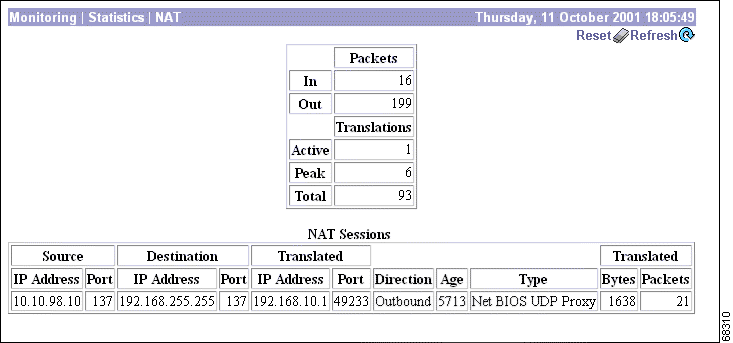
This screen shows statistics for NAT (Network Address Translation) activity on the VPN 3002 since it was last booted or reset.
To reset, or start anew, the screen contents, click Reset. The system temporarily resets a counter for the chosen statistics without affecting the operation of the device. You can then view statistical information without affecting the actual current values of the counters or other management sessions. The function is like that of a vehicle's trip odometer, versus the regular odometer.
To restore the screen contents to their actual statistical values, click Restore. This icon displays only if you previously clicked the Reset icon.
To update the screen and its data, click Refresh. The date and time indicate when the screen was last updated.
The total of NAT packets inbound and outbound since the last time the VPN 3002 was rebooted or reset.
The number of currently active NAT sessions.
The maximum number of NAT sessions that were simultaneously active on the VPN 3002 since it was last booted or reset.
The total number of NAT sessions on the VPN 3002 since it was last booted or reset.
The following sections provide detailed information about active NAT sessions on the VPN 3002.
The source IP address and port for the NAT session.
The destination IP address and port for the NAT session.
The translated IP address and port for the NAT session. The VPN3002 uses this port number to keep track of which devices initiate data transfer; by keeping this record, the VPN 3002 is able to correctly route responses.
The direction, inbound or outbound, of the data transferred for the NAT session.
The number of half seconds remaining until the NAT session times out.
The type of packets for the NAT session. The possible types are:
The total number of translated bytes and packets for the NAT session.
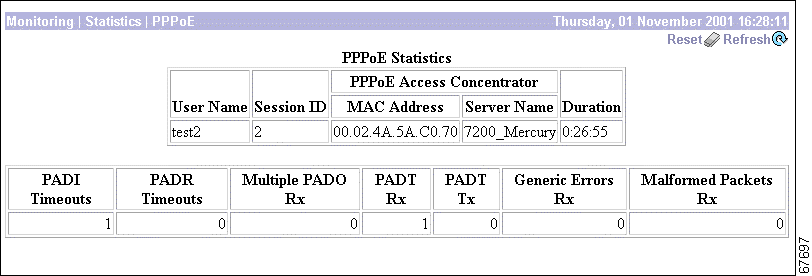
This screen shows statistics for PPPoE (PPP over Ethernet) activity on the VPN 3002 since it was last booted or reset.
To reset, or start anew, the screen contents, click Reset. The system temporarily resets a counter for the chosen statistics without affecting the operation of the device. You can then view statistical information without affecting the actual current values of the counters or other management sessions. The function is like that of a vehicle's trip odometer, versus the regular odometer.
To restore the screen contents to their actual statistical values, click Restore. This icon displays only if you previously clicked the Reset icon.
To update the screen and its data, click Refresh. The date and time indicate when the screen was last updated.
The username for the PPPoE session.
The ID for the session assigned by the ISP. The Session ID combined with the Access Concentrator MAC Address (see below) uniquely identifies the PPPoE session.
The device your Internet Service Provider (ISP) uses to manage PPPoE traffic. Fields include Session ID, MAC Address, and Server Name. These fields have entries only if a PPPoE session is established.
The MAC (Medium Access Control) address of the PPPoE Access Concentrator, in 6-byte hexadecimal notations.
The name of the server for the PPPoE Access Concentrator.
The amount of time that this PPPoE session has been up, in the format hh:mm:ss.
The number of PPPoE Active Discovery Initiation packets for which the VPN 3002 received no response.
The number of PPPoE Active Discovery Request packets for which the VPN 3002 received no response.
The number of multiple PPPoE Active Discovery Offer packets received, that is, the number of times more than one PPPoE access concentrator responded to the PADI the VPN 3002 sent.
The number of PPPoE Active Discovery Terminate packets received.
The number of PPPoE Active Discovery Terminate packets sent.
The number of errors received during the PPPoE session.
The number of malformed packets received during the PPPoE session.
This section of the Manager lets you view statistics that are recorded in standard MIB-II objects on the VPN 3002. MIB-II (Management Information Base, version 2) objects are variables that contain data about the system. They are defined as part of the Simple Network Management Protocol (SNMP); and SNMP-based network management systems can query the VPN 3002 to gather the data.
Each subsequent screen displays the data for a standard MIB-II group of objects:
To configure and enable the VPN 3002 SNMP server, see the Configuration | System | Management Protocols | SNMP screen.
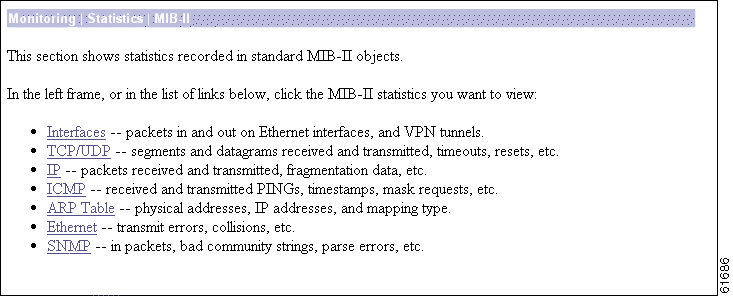
This screen shows statistics in MIB-II objects for VPN 3002 interfaces since the system was last booted or reset.

To reset, or start anew, the screen contents, click Reset. The system temporarily resets a counter for the chosen statistics without affecting the operation of the device. You can then view statistical information without affecting the actual current values of the counters or other management sessions. The function is like that of a vehicle's trip odometer, versus the regular odometer.
To restore the screen contents to their actual statistical values, click Restore. This icon displays only if you previously clicked the Reset icon.
To update the screen and its data, click Refresh. The date and time indicate when the screen was last updated.
The VPN 3002 interface:
The operational status of this interface:
The number of unicast packets that were received by this interface. Unicast packets are those addressed to a single host.
The number of unicast packets that were routed to this interface for transmission, including those that were discarded or not sent. Unicast packets are those addressed to a single host.
The number of multicast packets that were received by this interface. Multicast packets are those addressed to a specific group of hosts.
The number of multicast packets that were routed to this interface for transmission, including those that were discarded or not sent. Multicast packets are those addressed to a specific group of hosts.
The number of broadcast packets that were received by this interface. Broadcast packets are those addressed to all hosts on a network.
The number of broadcast packets that were routed to this interface for transmission, including those that were discarded or not sent. Broadcast packets are those addressed to all hosts on a network.
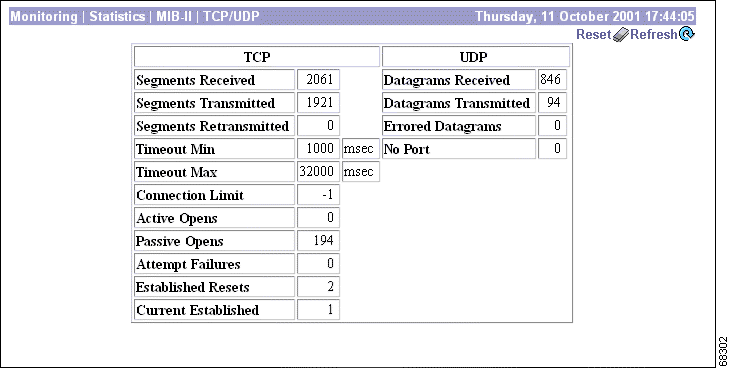
This screen shows statistics in MIB-II objects for TCP and UDP traffic on the VPN 3002 since it was last booted or reset. RFC 2012 defines TCP MIB objects, and RFC 2013 defines UDP MIB objects.
To reset, or start anew, the screen contents, click Reset. The system temporarily resets a counter for the chosen statistics without affecting the operation of the device. You can then view statistical information without affecting the actual current values of the counters or other management sessions. The function is like that of a vehicle's trip odometer, versus the regular odometer.
To restore the screen contents to their actual statistical values, click Restore. This icon displays only if you previously clicked the Reset icon.
To update the screen and its data, click Refresh. The date and time indicate when the screen was last updated.
The total number of segments received, including those received in error and those received on currently established connections. Segment is the official TCP name for what is casually called a data packet.
The total number of segments sent, including those on currently established connections but excluding those containing only retransmitted bytes. Segment is the official TCP name for what is casually called a data packet.
The total number of segments retransmitted; that is, the number of TCP segments transmitted containing one or more previously transmitted bytes. Segment is the official TCP name for what is casually called a data packet.
The minimum value permitted for TCP retransmission timeout, measured in milliseconds.
The maximum value permitted for TCP retransmission timeout, measured in milliseconds.
The limit on the total number of TCP connections that the system can support. A value of -1 means there is no limit.
The number of TCP connections that went directly from an unconnected state to a connection-synchronizing state, bypassing the listening state. These connections are allowed, but they are usually in the minority.
The number of TCP connections that went from a listening state to a connection-synchronizing state. These connections are usually in the majority.
The number of TCP connection attempts that failed. Technically this is the number of TCP connections that went to an unconnected state, plus the number that went to a listening state, from a connection-synchronizing state.
The number of established TCP connections that abruptly closed, bypassing graceful termination.
The number of TCP connections that are currently established or are gracefully terminating.
The total number of UDP datagrams received. Datagram is the official UDP name for what is casually called a data packet.
The total number of UDP datagrams sent. Datagram is the official UDP name for what is casually called a data packet.
The number of received UDP datagrams that could not be delivered for reasons other than the lack of an application at the destination port (UDP No Port). Datagram is the official UDP name for what is casually called a data packet.
The total number of received UDP datagrams that could not be delivered because there was no application at the destination port. Datagram is the official UDP name for what is casually called a data packet.
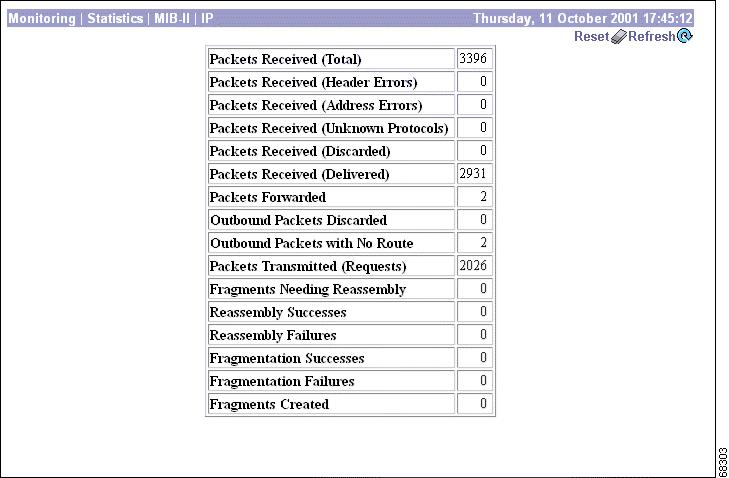
This screen shows statistics in MIB-II objects for IP traffic on the VPN 3002 since it was last booted or reset. RFC 2011 defines IP MIB objects.
To reset, or start anew, the screen contents, click Reset. The system temporarily resets a counter for the chosen statistics without affecting the operation of the device. You can then view statistical information without affecting the actual current values of the counters or other management sessions. The function is like that of a vehicle's trip odometer, versus the regular odometer.
To restore the screen contents to their actual statistical values, click Restore. This icon displays only if you previously clicked the Reset icon.
To update the screen and its data, click Refresh. The date and time indicate when the screen was last updated.
The total number of IP data packets received by the VPN 3002, including those received with errors.
The number of IP data packets received and discarded due to errors in IP headers, including bad checksums, version number mismatches, other format errors, etc.
The number of IP data packets received and discarded because the IP address in the destination field was not a valid address for the VPN 3002. This count includes invalid addresses (for example, 0.0.0.0) and addresses of unsupported classes (such as Class E).
The number of IP data packets received and discarded because of an unknown or unsupported protocol.
The number of IP data packets received that had no problems preventing continued processing, but that were discarded (for example, for lack of buffer space). This number does not include any packets discarded while awaiting reassembly.
The number of IP data packets received and successfully delivered to IP user protocols (including ICMP) on the VPN 3002; that is, the VPN 3002 was the final destination.
The number of IP data packets received and forwarded to destinations other than the VPN 3002.
The number of outbound IP data packets that had no problems preventing their transmission to a destination, but that were discarded (for example, for lack of buffer space).
The number of outbound IP data packets discarded because no route could be found to transmit them to their destination. This number includes any packets that the VPN 3002 could not route because all of its default routers were down.
The number of IP data packets that local IP user protocols (including ICMP) supplied to transmission requests. This number does not include any packets counted in Packets Forwarded.
The number of IP fragments received by the VPN 3002 that needed to be reassembled.
The number of IP data packets successfully reassembled.
The number of failures detected by the IP reassembly algorithm (for whatever reason: timed out, errors, etc.). This number is not necessarily a count of discarded IP fragments since some algorithms can lose track of the number of fragments by combining them as they are received.
The number of IP data packets that have been successfully fragmented by the VPN 3002.
The number of IP data packets that have been discarded because they needed to be fragmented but could not be (because the Don't Fragment flag was set).
The number of IP data packet fragments that have been generated by the VPN 3002.
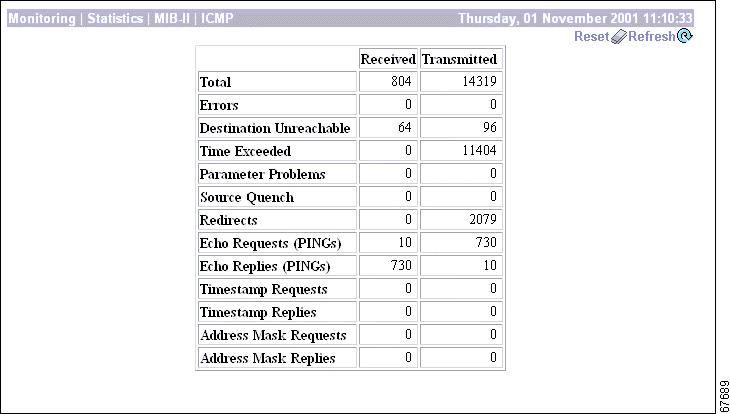
This screen shows statistics in MIB-II objects for ICMP traffic on the VPN 3002 since it was last booted or reset. RFC 2011 defines ICMP MIB objects.
To reset, or start anew, the screen contents, click Reset. The system temporarily resets a counter for the chosen statistics without affecting the operation of the device. You can then view statistical information without affecting the actual current values of the counters or other management sessions. The function is like that of a vehicle's trip odometer, versus the regular odometer.
To restore the screen contents to their actual statistical values, click Restore. This icon displays only if you previously clicked the Reset icon.
To update the screen and its data, click Refresh. The date and time indicate when the screen was last updated.
The total number of ICMP messages that the VPN 3002 received/sent. This number includes messages counted as Errors Received/Transmitted. ICMP messages solicit and provide information about the network environment.
The number of ICMP messages that the VPN 3002 received but determined to have ICMP-specific errors (bad ICMP checksums, bad length, etc.).
The number of ICMP messages that the VPN 3002 did not send due to problems within ICMP such as a lack of buffers.
The number of ICMP Destination Unreachable messages received/sent. Destination Unreachable messages apply to many network situations, including inability to determine a route, an unusable source route specified, and the Don't Fragment flag set for a packet that must be fragmented.
The number of ICMP Time Exceeded messages received/sent. Time Exceeded messages indicate that the lifetime of the packet has expired, or that a router cannot reassemble a packet within a time limit.
The number of ICMP Parameter Problem messages received/sent. Parameter Problem messages indicate a syntactic or semantic error in an IP header.
The number of ICMP Source Quench messages received/sent. Source Quench messages provide rudimentary flow control; they request a reduction in the rate of sending traffic on the network.
The number of ICMP Redirect messages received/sent. Redirect messages advise that there is a better route to a particular destination.
The number of ICMP Echo (request) messages received/sent. Echo messages are probably the most visible ICMP messages. They test the communication path between network entities by asking for Echo Reply response messages.
The number of ICMP Echo Reply messages received/sent. Echo Reply messages are sent in response to Echo messages, to test the communication path between network entities.
The number of ICMP Timestamp (request) messages received/sent. Timestamp messages measure the propagation delay between network entities by including the originating time in the message, and asking for the receipt time in a Timestamp Reply message.
The number of ICMP Timestamp Reply messages received/sent. Timestamp Reply messages are sent in response to Timestamp messages, to measure propagation delay in the network.
The number of ICMP Address Mask Request messages received/sent. Address Mask Request messages ask for the address (subnet) mask for the LAN to which a router connects.
The number of ICMP Address Mask Reply messages received/sent. Address Mask Reply messages respond to Address Mask Request messages by supplying the address (subnet) mask for the LAN to which a router connects.
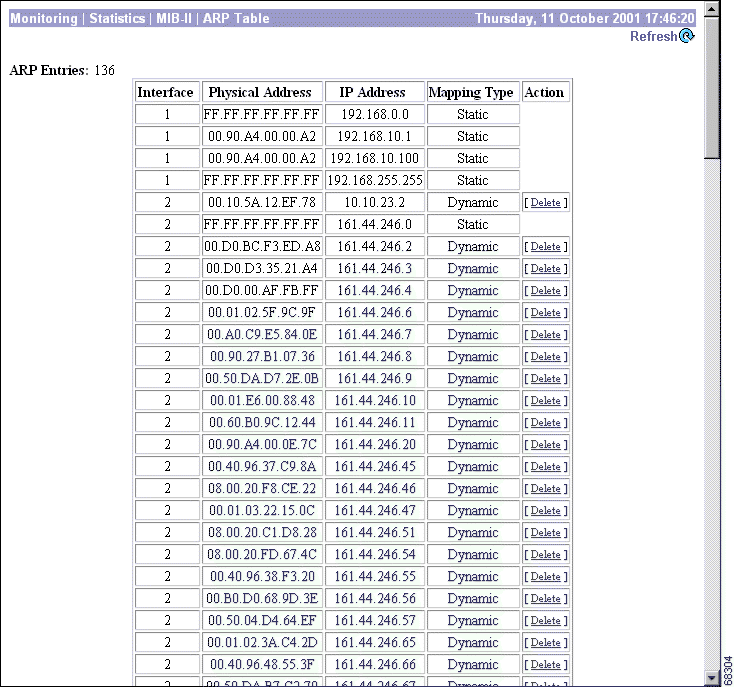
This screen shows entries in the Address Resolution Protocol mapping table since the VPN 3002 was last booted or reset. ARP matches IP addresses with physical MAC addresses, so the system can forward traffic to computers on its network. RFC 2011 defines MIB entries in the ARP table.
The entries are sorted first by Interface, then by IP Address. To speed display, the Manager might construct multiple 64-row tables. Use the scroll controls (if present) to view the entire series of tables.
You can also delete dynamic, or learned, entries in the mapping table.
.
To update the screen and its data, click Refresh. The date and time indicate when the screen was last updated.
The VPN 3002 network interface on which this mapping applies:
The hardwired MAC (Media Access Control) address of a physical network interface card, in 6-byte hexadecimal notation, that maps to the IP Address. Exceptions are:
The IP address that maps to the Physical Address.
The type of mapping:
To remove a dynamic, or learned, mapping from the table, click Delete. There is no confirmation or undo. The Manager deletes the entry and refreshes the screen.
To delete an entry, you must have the administrator privilege to Modify Config under General Access Rights. See Administration | Access Rights | Administrators.
You cannot delete static mappings.
This screen shows statistics in MIB-II objects for Ethernet interface traffic on the VPN 3002 since it was last booted or reset. IEEE standard 802.3 describes Ethernet networks, and RFC 1650 defines Ethernet interface MIB objects.
To configure Ethernet interfaces, see Configuration | Interfaces.

To reset, or start anew, the screen contents, click Reset. The system temporarily resets a counter for the chosen statistics without affecting the operation of the device. You can then view statistical information without affecting the actual current values of the counters or other management sessions. The function is like that of a vehicle's trip odometer, versus the regular odometer.
To restore the screen contents to their actual statistical values, click Restore. This icon displays only if you previously clicked the Reset icon.
To update the screen and its data, click Refresh. The date and time indicate when the screen was last updated.
The private or public interface to which the data in this row applies.
The number of frames received on this interface that are not an integral number of bytes in length and do not pass the FCS (Frame Check Sequence; used for error detection) check.
The number of frames received on this interface that are an integral number of bytes in length but do not pass the FCS (Frame Check Sequence) check.
The number of times that the carrier sense signal was lost or missing when trying to transmit a frame on this interface.
The number of times that the SQE (Signal Quality Error) Test Error message was generated for this interface. The SQE message tests the collision circuits on an interface.
The number of frames received on this interface that exceed the maximum permitted frame size.
The number of frames for which the first transmission attempt on this interface is delayed because the medium is busy. This number does not include frames involved in collisions.
The number of successfully transmitted frames on this interface for which transmission is inhibited by exactly one collision. This number is not included in the Multiple Collisions number.
The number of successfully transmitted frames on this interface for which transmission is inhibited by more than one collision. This number does not include the Single Collisions number.
The number of times that a collision is detected on this interface later than 512 bit-times into the transmission of a packet. 512 bit-times = 51.2 microseconds on a 10-Mbps system.
The number of frames for which transmission on this interface failed due to excessive collisions.
The number of frames for which transmission on this interface failed due to an internal MAC sublayer transmit error. This number does not include Carrier Sense Errors, Late Collisions, or Excessive Collisions.
The number of frames for which reception on this interface failed due to an internal MAC sublayer receive error. This number does not include Alignment Errors, FCS Errors, or Frame Too Long Errors.
The nominal bandwidth of the interface in megabits per second.
The current LAN duplex transmission mode for this interface:
This screen shows statistics in MIB-II objects for SNMP traffic on the VPN 3002 since it was last booted or reset. RFC 1907 defines SNMP version 2 MIB objects.
To configure the VPN 3002 SNMP server, see Configuration | System | Management Protocols | SNMP.

To reset, or start anew, the screen contents, click Reset. The system temporarily resets a counter for the chosen statistics without affecting the operation of the device. You can then view statistical information without affecting the actual current values of the counters or other management sessions. The function is like that of a vehicle's trip odometer, versus the regular odometer.
To restore the screen contents to their actual statistical values, click Restore. This icon displays only if you previously clicked the Reset icon.
To update the screen and its data, click Refresh. The date and time indicate when the screen was last updated.
The total number of SNMP messages received by the VPN 3002.
The total number of SNMP messages received that were for an unsupported SNMP version. The
VPN 3002 supports SNMP version 2.
The total number of SNMP messages received that used an SNMP community string the VPN 3002 did not recognize. See Configuration | System | Management Protocols | SNMP Communities to configure permitted community strings. To protect security, the VPN 3002 does not include the usual default public community string.
The total number of syntax or transmission errors encountered by the VPN 3002 when decoding received SNMP messages.
The total number of SNMP request messages that were silently dropped because the reply exceeded the maximum allowable message size.
The total number of SNMP request messages that were silently dropped because the transmission of the reply message to a proxy target failed for some reason (other than a timeout).
![]()
![]()
![]()
![]()
![]()
![]()
![]()
![]()
Posted: Wed Nov 20 10:55:44 PST 2002
Copyright 1989-2000©Cisco Systems Inc.