cc/td/doc/product/voice/vpdd/cdd
hometocprevnextglossaryfeedbacksearchhelp
PDF

Table Of Contents

SCCP (Skinny) Phone/Endpoint Troubleshooting

Overview

Architecture

Troubleshooting Tools

Error Reporting

Configuring Cisco CallManager Trace Parameters

Configuring SDL Trace Parameters

SCCP (Skinny) Phone/Endpoint Troubleshooting


This chapter contains the following topics:

Overview

Architecture

Troubleshooting Tools

Error Reporting

Overview

The Skinny Client Control Protocol (SCCP) comprises of a messaging set between a skinny client and the Cisco CallManager call-processing server and is a lightweight alternative to H.323. All of the Cisco IP Phones communicate with the Cisco CallManager through SCCP.

A skinny client uses:

TCP/IP to and from one or more Cisco CallManagers to transmit and receive stimulus.

RTP/UDP/IP to and from a similar skinny client or H.323 terminal for audio.

SCCP is a stimulus-based protocol and is designed as a communications protocol for hardware endpoints and other embedded systems, with significant CPU and memory constraints.

Architecture

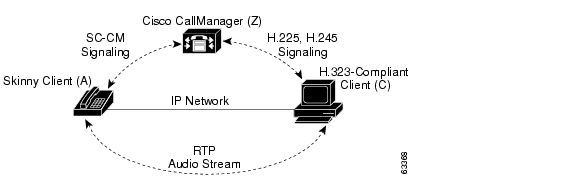
Figure 27 shows the interaction between skinny and H.323 clients through the Cisco CallManager server. The skinny client signaling is from the phone to the Cisco CallManager server. The Cisco CallManager server in turn translates the call-control messages to the H.323 client using H.225 for call routing and H.245 for negotiation. After the call is established, the RTP audio stream runs directly between both clients.

Figure 27

Skinny Client to/from H.323 Client Example


Note SCCP is a Cisco propreitary protocol. Special approval and technology licensing agreements are required in order to receive access to SCCP development resources.


Troubleshooting Tools

Commercially-available tools, such as Sniffer Pro or Ethereal, need to be used for collecting the packets exchanged between the skinny client and the Cisco CallManager server. The skinny client uses TCP/IP for transport. While configuring the network analysis software for capturing the packets, it is important to specify a filter between the the client and the Cisco CallManager sever.

Error Reporting

The Cisco CallManager traces can also be used to troubleshoot. Collect the Cisco CallManager CCM & SDL traces by setting them to detailed level. The section below details Cisco CallManager trace configuration.

Configuring Cisco CallManager Trace Parameters

This section describes how to configure trace parameters for the Cisco CallManager service.

Procedure


Step 1 From the Cisco CallManager Administration window, choose Application > Cisco CallManager Serviceability.

The Cisco CallManager Serviceability window displays.

Step 2 Choose Trace > Configuration.

Step 3 From the Servers column, choose the server.

The server that you chose displays next to the Current Server title and a box with configured services displays.

Step 4 From the Configured Services box, choose the Cisco CallManager service.

The service that you chose displays next to the Current Service title, along with the current server that you chose. The trace parameters display for the service that you chose.


Note Only the trace parameters for the service you chose are displayed. The display shows all other parameters grayed out.


Step 5 Check the Trace On checkbox.

Step 6 If you want trace to apply to all Cisco CallManager servers in the cluster, check the Apply to All Nodes checkbox.

Step 7 In the Debug Trace Level selection box, click the Down arrow.

A list with six debug trace levels displays.

Step 8 Click the desired debug trace level as described in Table 4.

Table 4 Debug Trace Levels

Level
Description

Error

Traces alarm conditions and events. Used for all traces generated in abnormal path. Uses minimum amount of CPU cycles.

Special

Traces all Error conditions plus process and device initialization messages.

State Transition

Traces all Special conditions plus subsystem state transitions that occur during normal operation. Traces call- processing events.

Significant

Traces all State Transition conditions plus media layer events that occur during normal operation.

Entry/Exit

Traces all Significant conditions plus entry and exit points of routines. Not all services use this trace level (for example, Cisco CallManager does not).

Arbitrary

Traces all Entry/Exit conditions plus low-level debugging information.

Note Do not use this trace level with the Cisco CallManager service or the Cisco IP Voice Media Streaming Application service during normal operation.

Detailed

Traces all Arbitrary conditions plus detailed debugging information.

Note Do not use this trace level with the Cisco CallManager service or the Cisco IP Voice Media Streaming Application service during normal operation.


Step 9 Check the Cisco CallManager Trace Fields check box. Table 5 describes the 17 options from which to choose.

Table 5 Cisco CallManager Trace Fields 

Field Name
Description

Enable H245 Message Trace

Activates trace of H245 messages.

Enable DT-24+/DE-30+ Trace

Activates the logging of ISDN type of DT-24+/DE-30+ device traces.

Enable PRI Trace

Activates trace of primary rate interface (PRI) devices.

Enable ISDN Translation Trace

Activates ISDN message traces. Used for normal debugging.

Enable H225 & Gatekeeper Trace

Activates trace of H.225 devices. Used for normal debugging.

Enable Miscellaneous Trace

Activates trace of miscellaneous devices.

Note Do not check this check box during normal system operation.

Enable Conference Bridge Trace

Activates trace of conference bridges. Used for normal debugging.

Enable Music on Hold Trace

Activates trace of music on hold (MOH) devices. Used to trace MOH device status such as registered with Cisco CallManager, unregistered with Cisco CallManager, and resource allocation processed successfully or failed.

Enable CM Real-Time Information Server Trace

Activates Cisco CallManager real-time information traces used by the real-time information server.

Enable CDR Trace

Activates traces for CDR.

Enable Analog Trunk Trace

Activates trace of all analog trunk (AT) gateways.

Enable All Phone Device Trace

Activates trace of phone devices. Trace information includes SoftPhone devices. Used for normal debugging.

Enable MTP Trace

Activates trace of media termination point (MTP) devices. Used for normal debugging.

Enable All Gateway Trace

Activates trace of all analog and digital gateways.

Enable Forward and Miscellaneous Trace

Activates trace for call forwarding and all subsystems not covered by another check box. Used for normal debugging.

Enable MGCP Trace

Activates trace for media gateway control protocol (MGCP) devices. Used for normal debugging.

Enable Media Resource Manager Trace

Activates trace for media resource manager (MRM) activities.


Step 10 If you want trace information for specific Cisco CallManager devices, check the Device Name Based Trace Monitoring check box.

If you want trace to apply to non-devices in addition to devices, check the Include Non-device Traces check box. If check box is checked, set the appropriate debug trace level as described in Table 4.

Step 11 Check the Enable File Trace Log check box to enable the log file to receive trace information.

The default log filename and the default parameters display in the fields. If you want to send the trace information to another file, specify the filename and pathname by clicking the filename field. Change the default parameters by clicking the appropriate field and entering the information.


Note Trace validates the filename and ensures that the filename has a .txt extension. Do not use a filename that exists on another computer. Use a filename that exists on the computer that is running the trace.


The following default trace log filename applies for the Cisco CallManager: C:\ProgramFiles\Cisco\Trace\CCM\ccm.txt. See Table 6 for the trace log file default parameters.

Step 12 If you want the trace information to be available for trace analysis, check the Enable XML Formatted Output check box. If this check box is not checked, the log file compiles in text format and will not be available for trace analysis.

Step 13 If you are a Cisco engineer debugging the system, check the Enable Debug Output String check box; otherwise, continue with the following steps.

Step 14 To configure SDL Trace parameters, click SDL Configuration. See "Configuring SDL Trace Parameters" .

Step 15 To save your trace parameters configuration, click the Update button.

The changes to trace configuration take effect immediately for Cisco CallManager.


Note To set the default, click the SetDefault button. To apply the current settings for chosen services to all nodes in a cluster, check the Apply to all Nodes check box.

Table 6 Trace Log File Description

Field
Description
Maximum number of files

The total number of trace files for a given service. Cisco CallManager automatically appends a sequence number to the filename to indicate which file it is; for example, ccm299.txt. When the last file in the sequence is full, the trace data begins writing over the first file. The default is 300 files.

Maximum number of lines

The maximum number of lines of data stored in each trace file. The default is 10000 lines for text files and 2000 for XML files.

Maximum number of minutes

The maximum minutes of data stored in each trace file. The default is 1440 minutes.


When the trace data exceeds either the maximum number of lines or the maximum minutes for one file, Cisco CallManager closes that file and writes the remaining trace data to the next file in the sequence. For example, you can set up trace files to store a full week of data, with one day of data in each file. To do this, set the number of files to 7, the minutes to 1440 (one day), and the number of lines to a large value such as 10000 (or larger for a busy system).


Configuring SDL Trace Parameters

This section describes how to configure the SDL trace parameters for the Cisco CallManager and Cisco CTIManager services.

Procedure


Step 1 From the Cisco CallManager or Cisco CTIManager trace configuration window, click the SDL Configuration link.

The SDL Trace Configuration window displays.

Step 2 Check the Trace On check box.

Step 3 If you are configuring SDL parameters for the Cisco CallManager service, check the Trace Filter Settings check boxes that you want to apply to this trace as described in Table 7. If you are configuring the SDL parameters for the Cisco CTIManager service, check the Trace Filter Settings check boxes that you want to apply to this trace as described in Table 8.


Note Cisco recommends that you use the defaults unless a Cisco engineer instructs you to do otherwise.


Table 7 Cisco CallManager SDL Configuration Filter Settings

Setting Name
Description

Enable All Layer 1 Trace

Activates traces for Layer 1.

Enable Detailed Layer 1 Trace

Activates detailed Layer 1 traces.

Enable All Layer 2 Trace

Activates traces for Layer 2.

Enable Layer 2 interface Trace

Activates Layer 2 interface traces.

Enable Layer 2 TCP Trace

Activates Layer 2 Transmission Control Program (TCP) traces.

Enable Detailed Dump Layer 2 Trace

Activates detailed traces for dump Layer 2.

Enable All Layer 3 Trace

Activates traces for Layer 3.

Enable All Call Control Trace

Activates traces for call control.

Enable Miscellaneous Polls Trace

Activates traces for miscellaneous polls.

Enable Miscellaneous Trace (Database Signals)

Activates miscellaneous traces such as database signals.

Enable Message Translation Signals Trace

Activates traces for message translation signals.

Enable UUIE Output Trace

Activates traces for user-to-user informational element (UUIE) output.

Enable Gateway Signals Trace

Activates traces for gateway signals.

Enable CTI Trace

Activates CTI trace.

Enable Network Service Data Trace

Activates network service data trace.

Enable Network Service Event Trace

Activates network service event trace.

Enable ICCP Admin Trace

Activates admin trace for ICCP.

Enable Default Trace

Activates default trace.


Table 8 Cisco CTIManager Trace SDL Configuration Filter Settings 

Setting Name
Description

Enable Miscellaneous Polls Trace

Activates traces for miscellaneous polls.

Enable Miscellaneous Trace (Database Signals

Activates miscellaneous traces such as database signals.

Enable CTI SDL Trace

Activates CTI SDL trace.

Enable CTI Application Trace

Activates trace for CTI applications.

Enable CTI Information Trace

Activates trace for CTI information.

Enable CTI Warning Trace

Activates warning trace for CTI.

Enable CTI Error Trace

Activates error trace for CTI.

Enable Network Service Data Trace

Activates network service data trace.

Enable Network Service Event Trace

Activates network service event trace.

Enable ICCP Admin Trace

Activates admin trace for ICCP.

Enable Default Trace

Activates default trace.


Step 4 If you are configuring SDL parameters for the Cisco CallManager service, check the Trace Characteristics check boxes that you want to apply to this trace as described in Table 9. If you are configuring the SDL parameters for the Cisco CTIManager service, check the Trace Characteristics check boxes that you want to apply to this trace as described in Table 10.

Table 9 Cisco CallManager SDL Configuration Trace Characteristics

Characteristics
Description

Enable SDL Link States Trace

Activates trace for intracluster communication protocol (ICCP) link state.

Enable Low-Level SDL Trace

Activates trace for low-level SDL.

Enable SDL Link Poll Trace

Activates trace for ICCP link poll.

Enable SDL Link Messages Trace

Activates trace for ICCP raw messages.

Enable Signal Data Dump Trace

Activates traces for signal data dump.

Enable Correlation Tag Mapping Trace

Activates traces for correlation tag mapping.

Enable SDL Process States Trace

Activates traces for SDL process states.

Disable Pretty Print of SDLTrace

Disables trace for pretty print of SDL. Pretty print adds tabs and spaces in a trace file without performing post processing.

Enable SDL TCP Event Trace

Activates trace for SDL TCP event.


Table 10 Cisco CTIManager SDL Configuration Characteristics 

Characteristics
Description

Enable SDL Link States Trace

Activates trace for ICCP link state.

Enable Low-level SDL Trace

Activates trace for low-level SDL.

Enable SDL Link Poll Trace

Activates trace for ICCP link poll.

Enable SDL Link Messages Trace

Activates trace for ICCP raw messages.

Enable Signal Data Dump Trace

Activates traces for signal data dump.

Enable Correlation Tag Mapping Trace

Activates traces for correlation tag mapping.

Enable SDL Process States Trace

Activates traces for SDL process states.

Disable Pretty Print of SDL Trace

Disables trace for pretty print of SDL. Pretty print adds tabs and spaces in a trace file without performing post processing.

Enable SDL TCP Event Trace

Activates trace for SDL TCP event.


Step 5 If you want the trace information available for trace analysis, check the Enable XML Formatted Output check box. If this check box is not checked, the log file compiles in text format and will not be available for trace analysis.

The default trace directory path and the default parameters display in the fields. If you want to send the trace information to another file, enter the filename and pathname in the Trace Directory Path field. Change the default parameters by clicking the appropriate field and entering the information.

The following default trace log filename applies for SDL Trace Configuration: C:\Program Files\Cisco\Trace\SDL. See Table 6 for the Trace log file default parameters.

Step 6 To save your SDL trace parameters configuration, click the Update button.

The changes to trace configuration take effect immediately for SDL Trace Configuration.


Note To set the default, click the SetDefault button. To apply the current settings for chosen services to all nodes in a cluster, check the Apply to all Nodes check box.


Step 7 To continue with SDL Trace Configuration for another service, choose the service from the Configured Services box; otherwise, continue with Step 8.

Step 8 To return to the Cisco CallManager or Cisco CTIManager SDI Trace Configuration window, click the SDI Configuration link.


hometocprevnextglossaryfeedbacksearchhelp

Posted: Fri Sep 10 09:50:10 PDT 2004
All contents are Copyright © 1992--2004 Cisco Systems, Inc. All rights reserved.
Important Notices and Privacy Statement.