|
|

The Routing Statistics Display diagnostic function allows you to view TeleRouter's operating status. This function is accessed from the Diagnostics Menu screen, and is organized within the Diagnostic facilities as shown in Figure 6-1.

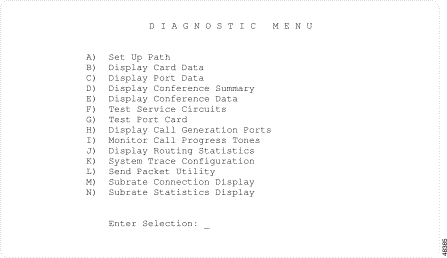
To access the Diagnostics Menu screen (see Figure 6-2) from the Main Menu screen, type D and press Enter.
The cursor is located in the Enter Selection data entry field. To access a function, type the letter that precedes it and press Enter. To return to the Main Menu screen, press Exit or the Prev Menu or Main Menu key.

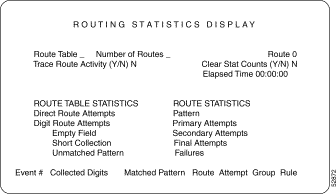
To access the Routing Statistics Display screen (see Figure 6-3) from the Diagnostics menu, type J and press Enter. The cursor is located in the Route Table command field.

The Routing Table Configuration screen contains the following fields:
Route Table—Data entry via main keypad. Indicates the number of the routing table. Possible values for this field range between A and J.
Number of Routes—Display only. Indicates the number of routes that have been defined for this routing table. Possible values for this field range between 0 and 1000. The three exception conditions and direct routing are not included in this count.
Route—Data entry via main keypad. Indicates the number of the route for which the displayed information applies. Possible values for this field range between 0 and 1000. A value of 0 causes statistics for the entire route table displayed. The alphabetic characters S (short collection), E (empty collection), U (unmatched pattern), and D (direct route) can also be entered for exception cases.
Trace Route Activity (Y/N)—Data entry via main keypad. Specifies whether to trace activity on the tables and routes indicated in the Route Table and Route fields. Possible values are Y (perform trace) and N (do not trace). When tracing is enabled, routing events are displayed at the bottom of the screen.
Clear Stat Counts (Y/N)—Data entry via main keypad. Specifies whether to clear the run-time counters displayed for the route table and individual routes. Clearing the statistic counter also resets the Elapsed Time field. Possible values are Y (clear all counters) and N (do not clear counters).
Elapsed Time—Display only. Indicates the time elapsed since the statistic counters were last cleared, in terms of hours, minutes and seconds. Once the timer reaches 99 hours, 59 minutes and 59 seconds, it will reset itself. The timer can be reset using the Clear Stats Counts (Y/N) field above.
ROUTE STATISTICS fields—Display only. Indicates the number and types of events occurring on the single route specified. The fields are as follows:
The remaining seven field columns display routing events when the routing trace function is enabled (when Y is entered in the Trace Route Activity (Y/N) field). Up to six routing events are displayed at a time (additional events overwrite the displayed information).
To view the current routing activity for a route table, complete the following steps:
Step 1 Display the Routing Statistics Display screen.
The cursor is located in the Route Table data entry field.
Step 2 Specify the route table and/or specific route to display, as follows:
Step 3 To trace routing activity on a route table or an individual route, halt the screen updates by pressing any key. The cursor returns to the Route field. Use the Prev Field or Next Field key to position the cursor at the Trace Route Activity (Y/N) entry field Type Y and press Enter to resume screen updates and start the trace. Routes used for call routing will be displayed under the last seven display field columns starting with Event #.
Step 4 To clear the route statistics on the display, halt the screen updates by pressing any key. The cursor returns to the Route field. Use the Prev Field or Next Field key to move the cursor to the Clear Stat Counts (Y/N) field. Type a Y and press Enter to clear all statistics for the route or route table specified.
Step 5 Press Exit or Prev Menu to return to the Diagnostics Menu screen.
In addition to the general messages listed in Cisco VCO/4K System Messages, the following messages may be displayed.
Error—Invalid Route Table
Explanation You entered a letter for the Route Table outside the range of A through J.
Error— Invalid Route For This Table
Explanation You entered a route number greater than the number of routes (XX) in the specified table.
Error—Y/N Only, Y To Enable Trace
Explanation You entered a value other than Y or N in the Trace Route Activity field.
Error—Y/N Only, Y To Clear Stats
Explanation You entered a value other than Y or N in the Clear Stat. Counts field.
You can access the following menus from the Routing Statistics Display screen:
![]()
![]()
![]()
![]()
![]()
![]()
![]()
![]()
Posted: Sat Sep 28 18:00:37 PDT 2002
All contents are Copyright © 1992--2002 Cisco Systems, Inc. All rights reserved.
Important Notices and Privacy Statement.