|
|

Table Of Contents
debug sampler
To enable debugging output for Flexible NetFlow samplers, use the debug sampler command in privileged EXEC mode. To disable debugging output, use the no form of this command.
debug sampler [[name] sampler-name [detailed] [error] | [name] sampler-name sampling samples]
no debug sampler [[name] sampler-name [detailed] [error] | [name] sampler-name sampling samples]
Syntax Description
Command Default
Debugging output for Flexible NetFlow samplers is disabled.
Command Modes
Privileged EXEC
Command History
Examples
The following output shows that the debug process obtained the ID for the sampler named SAMPLER-1:
Router# debug sampler detailed*Oct 28 04:14:30.883: Sampler: Sampler(SAMPLER-1: flow monitor NFC-DC-PHOENIX (ip,Et1/0,O) get ID succeeded:1*Oct 28 04:14:30.971: Sampler: Sampler(SAMPLER-1: flow monitor NFC-DC-PHOENIX (ip,Et0/0,I) get ID succeeded:1Related Commands
debug satellite
To enable debugging output for the Cisco IP VSAT satellite WAN network module (NM-1VSAT-GILAT), use the debug satellite command in privileged EXEC mode. To disable debugging output, use the no form of this command.
debug satellite {all | errors | events | hsrp | rbcp}
no debug satellite {all | errors | events | hsrp | rbcp}
Syntax Description
Defaults
No default behavior or values
Command Modes
Privileged EXEC
Command History
Usage Guidelines
The debug satellite errors command is useful for catching unusual conditions when troubleshooting unexpected behavior. Because this command typically generates very little output, you can enter the debug satellite errors command every time you troubleshoot satellite network connectivity.
Examples
This section provides the following examples:
•
Sample Output for the debug satellite rbcp Command
•
•
•
Sample Output for the debug satellite rbcp Command
Every 2 minutes, the NM-1VSAT-GILAT network module sends the router an RBCP message requesting any updates to the routing table. The following example shows how to monitor the route-update messages:
Router# debug satellite rbcp...The NM-1VSAT-GILAT network module requests IP route information:
*May 16 09:18:54.475:Satellite1/0 RBCP Request msg Recd:IPROUTE_REQ(0x22)The Cisco IOS software acknowledges that it received the message from the NM-1VSAT-GILAT network module:
*May 16 09:18:54.475:Satellite1/0 RBCP Response msg Sent:IPROUTE_REQ(0x22)The Cisco IOS software sends the IP route information to the NM-1VSAT-GILAT network module:
*May 16 09:18:54.475:Satellite1/0 RBCP Request msg Sent:IPROUTE_UPD(0x23)The NM-1VSAT-GILAT network module acknowledges that it received the routing update from the Cisco IOS software:
*May 16 09:18:54.475:Satellite1/0 RBCP Response msg Recd:IPROUTE_UPD(0x23)Sample Output for the debug satellite events Command
The following example shows how to monitor the periodic heartbeats that the NM-1VSAT-GILAT network module sends to the Cisco IOS software:
Router# debug satellite eventssatellite major software events debugging is on.Dec 16 12:57:52.108:Satellite1/0 FSM transition LINK_UP-->LINK_UP, ev=got_heartbeat.Dec 16 12:58:08.888:Satellite1/0 FSM transition LINK_UP-->LINK_UP, ev=got_heartbeat.Dec 16 12:58:25.664:Satellite1/0 FSM transition LINK_UP-->LINK_UP, ev=got_heartbeat.Dec 16 12:58:42.440:Satellite1/0 FSM transition LINK_UP-->LINK_UP, ev=got_heartbeatSample Output for the debug satellite hsrp Command
The following example shows the debug satellite hsrp command messages that appear when the active router is forced to standby status because the HSRP-tracked satellite interface is shut down:
Router# configure terminalEnter configuration commands, one per line. End with CNTL/Z.Router(config)# interface satellite 1/0Router(config-if)# shutdownRouter(config-if)# endRouter#01:03:48:%SYS-5-CONFIG_I:Configured from console by console01:03:49:%LINK-5-CHANGED:Interface Satellite1/0, changed state to administratively down01:03:50:%LINEPROTO-5-UPDOWN:Line protocol on Interface Satellite1/0, changed state to down01:04:22:%HSRP-6-STATECHANGE:FastEthernet0/0 Grp 1 state Active -> Speak01:04:22:HSRP-sat:IPred group grp-x update state ACTIVE --> SPEAK01:04:22:Satellite1/0 HSRP-sat:fsm crank ACTIVE-->STANDBY01:04:22:Satellite1/0 HSRP-sat:send standby msg STANDBY01:04:32:HSRP-sat:IPred group grp-x update state SPEAK --> STANDBY01:04:32:Satellite1/0 HSRP-sat:fsm crank STANDBY-->STANDBY01:04:32:Satellite1/0 HSRP-sat:send standby msg STANDBY01:04:42:Satellite1/0 HSRP-sat:send standby msg STANDBY01:04:52:Satellite1/0 HSRP-sat:standby msg STANDBY deferred, not in operational state01:05:02:Satellite1/0 HSRP-sat:standby msg STANDBY deferred, not in operational state01:05:12:Satellite1/0 HSRP-sat:standby msg STANDBY deferred, not in operational state01:05:22:Satellite1/0 HSRP-sat:standby msg STANDBY deferred, not in operational state01:05:32:Satellite1/0 HSRP-sat:standby msg STANDBY not sent, already in state01:06:47:%VSAT-5-STANDBY_MODE:Satellite1/0 module configured for standby mode01:09:32:Satellite1/0 HSRP-sat:fsm crank STANDBY-->STANDBY-UPCombined Sample Output for the debug satellite hsrp and debug standby Commands
The following example shows HSRP-related debug output for both the router and the NM-1VSAT-GILAT network module when the router goes from standby to active state because the HSRP-tracked satellite interface is reenabled:
Router# show debuggingSATCOM:satellite HSRP events debugging is onHSRP:HSRP Errors debugging is onHSRP Events debugging is onHSRP Packets debugging is onThe satellite interface is reenabled:
Router# configure terminalRouter(config)# interface satellite 1/0Router(config-if)# no shutdownRouter(config-if)# endRouter#The effective HSRP priority of the router changes as the tracked satellite interface comes up:
02:14:37:HSRP:Fa0/0 Grp 1 Hello in 10.123.96.2 Active pri 90 vIP 10.123.96.10002:14:39:HSRP:Fa0/0 API 10.1.0.6 is not an HSRP address02:14:39:HSRP:Fa0/0 Grp 1 Hello out 10.123.96.3 Standby pri 90 vIP 10.123.96.10002:14:39:HSRP:Fa0/0 Grp 1 Track 1 object changed, state Down -> Up02:14:39:HSRP:Fa0/0 Grp 1 Priority 90 -> 100Router#The router changes from standby to active state because its priority is now highest in the hot standby group, and preemption is enabled:
02:14:40:HSRP:Fa0/0 Grp 1 Hello in 10.123.96.2 Active pri 90 vIP 10.123.96.10002:14:40:HSRP:Fa0/0 Grp 1 Standby:h/Hello rcvd from lower pri Active router (90/10.123.96.2)02:14:40:HSRP:Fa0/0 Grp 1 Active router is local, was 10.123.96.202:14:40:HSRP:Fa0/0 Grp 1 Standby router is unknown, was local02:14:40:HSRP:Fa0/0 Redirect adv out, Active, active 1 passive 302:14:40:HSRP:Fa0/0 Grp 1 Coup out 10.123.96.3 Standby pri 100 vIP 10.123.96.10002:14:40:HSRP:Fa0/0 Grp 1 Standby -> Active02:14:40:%HSRP-6-STATECHANGE:FastEthernet0/0 Grp 1 state Standby -> ActiveThe HSRP status of the satellite interface also changes from standby to active state because the service-module ip redundancy command was previously entered to link the HSRP status of the satellite interface to the primary HSRP interface, Fast Ethernet 0/0.
02:14:40:HSRP:Fa0/0 Grp 1 Redundancy "grp-x" state Standby -> Active02:14:40:HSRP-sat:IPred group grp-x update state STANDBY --> ACTIVE02:14:40:Satellite1/0 HSRP-sat:fsm crank STANDBY-UP-->ACTIVE-COND02:14:40:HSRP:Fa0/0 Redirect adv out, Active, active 1 passive 202:14:40:HSRP:Fa0/0 Grp 1 Hello out 10.123.96.3 Active pri 100 vIP 10.123.96.10002:14:40:HSRP:Fa0/0 REDIRECT adv in, Passive, active 0, passive 2, from 10.123.96.202:14:40:HSRP:Fa0/0 REDIRECT adv in, Passive, active 0, passive 1, from 10.123.96.1502:14:40:HSRP:Fa0/0 Grp 1 Hello in 10.123.96.2 Speak pri 90 vIP 10.123.96.100Line protocols come up, and HSRP states become fully active:
02:14:41:%LINK-3-UPDOWN:Interface Satellite1/0, changed state to up02:14:42:%LINEPROTO-5-UPDOWN:Line protocol on Interface Satellite1/0, changed state to up02:14:43:HSRP:Fa0/0 Grp 1 Hello out 10.123.96.3 Active pri 100 vIP 10.123.96.10002:14:43:HSRP:Fa0/0 Grp 1 Redundancy group grp-x state Active -> Active02:14:43:HSRP-sat:IPred group grp-x update state ACTIVE --> ACTIVE02:14:43:Satellite1/0 HSRP-sat:fsm crank ACTIVE-COND-->ACTIVE-COND02:14:43:HSRP:Fa0/0 Grp 1 Hello in 10.123.96.2 Speak pri 90 vIP 10.123.96.10002:14:46:HSRP:Fa0/0 Grp 1 Hello out 10.123.96.3 Active pri 100 vIP 10.123.96.10002:14:46:HSRP:Fa0/0 Grp 1 Redundancy group grp-x state Active -> Active02:14:46:HSRP-sat:IPred group grp-x update state ACTIVE --> ACTIVE02:14:46:Satellite1/0 HSRP-sat:fsm crank ACTIVE-COND-->ACTIVE-COND02:14:46:HSRP:Fa0/0 Grp 1 Hello in 10.123.96.2 Speak pri 90 vIP 10.123.96.10002:14:49:HSRP:Fa0/0 Grp 1 Hello out 10.123.96.3 Active pri 100 vIP 10.123.96.10002:14:49:HSRP:Fa0/0 Grp 1 Hello in 10.123.96.2 Speak pri 90 vIP 10.123.96.10002:14:50:HSRP:Fa0/0 Grp 1 Hello in 10.123.96.2 Standby pri 90 vIP 10.123.96.10002:14:50:HSRP:Fa0/0 Grp 1 Standby router is 10.123.96.202:14:51:Satellite1/0 HSRP-sat:send standby msg ACTIVE02:14:52:HSRP:Fa0/0 Grp 1 Hello out 10.123.96.3 Active pri 100 vIP 10.123.96.10002:14:53:HSRP:Fa0/0 Grp 1 Hello in 10.123.96.2 Standby pri 90 vIP 10.123.96.10002:14:55:HSRP:Fa0/0 Grp 1 Hello out 10.123.96.3 Active pri 100 vIP 10.123.96.100Related Commands
debug satellite firmware
To enable debugging output for the Cisco IP VSAT satellite WAN network module (NM-1VSAT-GILAT) firmware, use the debug satellite firmware command in privileged EXEC mode. To disable debugging output, use the no form of this command.
debug satellite firmware {all | level number | option}
no debug satellite firmware
Syntax Description
all
Displays all satellite firmware events.
level number
Satellite debug level. The debug level affects what information is displayed for subsequently entered debug satellite firmware commands. See Table 287.
option
One of the following options. See Table 287.
•
•
•
•
•
•
•
•
•
Defaults
No default behavior or values.
Command Modes
Privileged EXEC
Command History
Usage Guidelines
The output from this command is generally useful for diagnostic tasks performed by technical support.
The level number affects which debug messages the system displays for subsequently entered debug satellite firmware commands. Table 287 describes what each command option displays at each debug level.
Note
Examples
This section provides the following sample output for the debug satellite firmware command:
•
•
•
•
•
•
•
•
•
•
•
•
•
•
Sample Output for the debug satellite firmware all Command
The following example shows all satellite firmware events and statistics:
Router# debug satellite firmware all2d06h: Satellite2/0buffers 4856 min 4486 list_str 683798 list_end 6885c8emp 686030 fil 685de0 start 6885c8 end fb4fe82d06h: Satellite2/0TCP stats: NetRXBytes=223 NetTXBytes=4775126 NetRxPkts=104213 ToIOSPkts=1041662d06h: Satellite2/0SAT stats: OUTbound_pkts=114131, INbound_pkts=1823472d06h: Satellite2/0RBCP statistics: TXcount=975 RXCount=9752d06h: Satellite2/0RPA stats: ToTunnel=0 FromTunnel=0TunnelGets=0 TunnelNotGets=0BlksUsed=0 BlksIn-Use=0 Max=3002d06h: Satellite2/0EN:RX encrypted bytes received = 0RX: compressed=0 -> Uncompressed=0TX: compressed=0 -> Uncompressed=02d06h: Satellite2/0BB 6 LINK state=INFO_STATEStatus = 0x79, LOW NOT READY, HI PRI READYRSP Q free=230, Max HI=228, Max LOW=224, Max DG=232IN RA modeCurr DG BW=50000, HighDG BW=100000, Curr BW=98094MaxDG BW=1250000, Max BW=2500000PD Queue lengths:q_wtog=0, q_wtos=57, q_wtos_high=0, q_defrag=dDG Queue lengths:q_dg_wtos=0, q_dg_wtos_hi=0, q_dg_defrag=0Congestion Levels: TX LOCAL = 7, TX NET = 02d06h: Satellite2/0IP stats: ToIOS_Pkts=234193, ToIOS_Bytes=183444492 FromIOS_Pkts=143 From_IOS_Bytes=122042d06h: Satellite2/0 NO Trace at levels 1 or 22d06h: Satellite2/0 NO Trace at levels 1 or 2Sample Output for the bb Option at Level 1
The following example shows backbone link information:
Router# debug satellite firmware level 1Router# debug satellite firmware bbsatellite BackBone events debugging is onRouter#2d06h: Satellite2/0BB 6 LINK state=INFO_STATEStatus = 0x79, LOW NOT READY, HI PRI READYRSP Q free=240, Max HI=228, Max LOW=224, Max DG=232IN RA modeCurr DG BW=50000, HighDG BW=100000, Curr BW=96188MaxDG BW=1250000, Max BW=2500000PD Queue lengths:q_wtog=0, q_wtos=95, q_wtos_high=0, q_defrag=dDG Queue lengths:q_dg_wtos=0, q_dg_wtos_hi=0, q_dg_defrag=0Congestion Levels: TX LOCAL = 7, TX NET = 02d06h: Satellite2/0BB 6 LINK state=INFO_STATEStatus = 0x7b, LOW READY, HI PRI READYRSP Q free=27, Max HI=228, Max LOW=224, Max DG=232IN RA modeCurr DG BW=50000, HighDG BW=100000, Curr BW=92376MaxDG BW=1250000, Max BW=2500000PD Queue lengths:q_wtog=0, q_wtos=24, q_wtos_high=0, q_defrag=dDG Queue lengths:q_dg_wtos=0, q_dg_wtos_hi=0, q_dg_defrag=0Congestion Levels: TX LOCAL = 4, TX NET = 0Sample Output for the bb Option at Level 2
The following example shows frame statistics for the backbone link to the hub:
Router# debug satellite firmware level 2Router# debug satellite firmware bbsatellite BackBone events debugging is onRouter#2d06h: Satellite2/0 BB link statisticsFrame Type # Received # Transmitted------------ ---------- -------------INFORMATION 00096238 00184811UNNUMBERED 00000000 00000067RETRANSMITTED 00000000 00000000POLLS 00000000 00000000ACKS 00006640 00000455NAKS 00000000 00000000PACKS 00000000 00000000UA 00000001 00000000SABME 00000000 00000001DISC 00000000 00000000Sample Output for the buf Option at Level 1
The following example shows buffer information:
Router# debug satellite firmware level 1Router# debug satellite firmware buf*May 13 15:58:54.498:Satellite1/0buffers 4951 min 4945 list_str 681858 list_end 686688emp 683abc fil 6839e8 start 686688 end fb30a8Sample Output for the buf Option at Level 2
The following example shows buffer owners:
Router# debug satellite firmware level 2Router# debug satellite firmware buf*May 13 15:59:13.438:Satellite1/0 inuse 49 free 4951Trace byte 1Trace byte = 0x169 Count = 49Trace byte 2Trace byte = 0x 0 Count = 490 buffers with BB Rel only0 buffers with in lower layer set0 buffers with do not transmit set0 buffers on BB retransmit queuesSample Output for the ip Option at Level 1
The following example shows IP statistics:
Router# debug satellite firmware level 1Router# debug satellite firmware ip*Nov 7 08:27:56.440: Satellite3/0IP stats: ToIOS_Pkts=0, ToIOS_Bytes=0 FromIOS_Pkts=84751 From_IOS_Bytes=5941124Sample Output for the rbcp Option at Level 1
The following example shows the number of RBCP messages transmitted and received since the most recent reset of the Cisco IOS software on the router or the VSAT software on the NM-1VSAT-GILAT network module:
Router# debug satellite firmware level 1Router# debug satellite firmware rbcpRBCP statistics:TXcount=301154 RXCount=301155Sample Output for the rpa Option at Level 1
The following example shows RPA statistics:
Router# debug satellite firmware level 1Router# debug satellite firmware rpa*Nov 7 08:27:13.488:Satellite3/0RPA stats:ToTunnel=0 FromTunnel=0TunnelGets=0 TunnelNotGets=0BlksUsed=0 BlksIn-Use=0 Max=400Sample Output for the rpa Option at Level 2
The following example shows a tunnel being disconnected:
Router# debug satellite firmware level 2Router# debug satellite firmware rpa*May 13 18:27:59.779:Satellite1/0 RPA Tunnel DOWNRPA:InitTunnelConn Successful locIP e000006 locPort 1090, RemIP c0a80186,RemPort 9876RPA Tunnel DOWNRPA:InitTunnelConn Successful locIP e000006 locPort 1091, RemIP c0a80186,RemPort 9876RPA Tunnel DOWNRPA:InitTunnelConn Successful locIP e000006 locPort 1092, RemIP c0a80186,RemPort 9876RPA Tunnel DOWNRPA:InitTunnelConn Successful locIP e000006 locPort 1093, RemIP c0a80186,RemPort 9876RPA Tunnel DOWNRPA:InitTunnelConn Successful locIP e000006 locPort 1094, RemIP c0a80186,RemPort 9876Sample Output for the sat Option at All Levels
The following example shows inbound and outbound packet statistics. Note that for all levels, the debug output is the same for the sat option.
Router# debug satellite firmware level 1Router# debug satellite firmware satsatellite related trace events debugging is onRouter#1d16h: Satellite2/0SAT stats: OUTbound_pkts=25660796, INbound_pkts=32359321d16h: Satellite2/0SAT stats: OUTbound_pkts=25660800, INbound_pkts=32359341d16h: Satellite2/0SAT stats: OUTbound_pkts=25660803, INbound_pkts=32359341d16h: Satellite2/0SAT stats: OUTbound_pkts=25660803, INbound_pkts=3235934Sample Output for the tcp Option at Level 1
The following example shows TCP statistics:
Router# debug satellite firmware level 1Router# debug satellite firmware tcpsatellite tcp events debugging is onRouter#2d06h: Satellite2/0TCP stats: NetRXBytes=631292 NetTXBytes=4009436 NetRxPkts=49244 ToIOSPkts=492462d06h: Satellite2/0TCP stats: NetRXBytes=1154356 NetTXBytes=4086106 NetRxPkts=49621 ToIOSPkts=49629Sample Output for the tcp Option at Level 2
The following example shows the TCP connections:
Router# debug satellite firmware level 2Router# debug satellite firmware tcpsatellite tcp events debugging is onRouter#2d06h: Satellite2/0 TCP connections:ID=48, locIP=192.168.107.2 remIP=172.25.1.2, locP=2962, remP=21 state=17 iosQ=0ID=49, locIP=192.168.107.2 remIP=172.25.1.2, locP=2963, remP=20 state=17 iosQ=0ID=58, locIP=192.168.107.2 remIP=172.25.1.28, locP=2972, remP=21 state=17 iosQ=0ID=59, locIP=192.168.107.2 remIP=172.25.1.28, locP=2973, remP=20 state=17 iosQ=72d06h: Satellite2/0 TCP connections:ID=48, locIP=192.168.107.2 remIP=172.25.1.2, locP=2962, remP=21 state=17 iosQ=0ID=49, locIP=192.168.107.2 remIP=172.25.1.2, locP=2963, remP=20 state=7 iosQ=0ID=60, locIP=192.168.107.2 remIP=172.25.1.28, locP=2974, remP=21 state=3 iosQ=0Sample Output for the tcp Option at Level 3
The following example shows TCP statistics and connections:
Router# debug satellite firmware level 3Output may be extensive and affect performance. Continue? [yes]: yesRouter# debug satellite firmware tcpsatellite tcp events debugging is onRouter#2d06h: Satellite2/0TCP stats: NetRXBytes=279 NetTXBytes=9436111 NetRxPkts=64991 ToIOSPkts=649992d06h: Satellite2/0 TCP connections:ID=48, locIP=192.168.107.2 remIP=172.25.1.2, locP=2962, remP=21 state=7 iosQ=0ID=49, locIP=192.168.107.2 remIP=172.25.1.2, locP=2963, remP=20 state=7 iosQ=0ID=62, locIP=192.168.107.2 remIP=172.25.1.28, locP=2976, remP=21 state=7 iosQ=02d06h: Satellite2/0TCP stats: NetRXBytes=382 NetTXBytes=9582924 NetRxPkts=64993 ToIOSPkts=650012d06h: Satellite2/0 TCP connections:ID=48, locIP=192.168.107.2 remIP=172.25.1.2, locP=2962, remP=21 state=17 iosQ=0ID=49, locIP=192.168.107.2 remIP=172.25.1.2, locP=2963, remP=20 state=17 iosQ=0ID=62, locIP=192.168.107.2 remIP=172.25.1.28, locP=2976, remP=21 state=7 iosQ=0Sample Output for the trc Option at Level 3
The following example shows detailed receive and transmit traces for the backbone link:
Router# debug satellite firmware level 3Output may be extensive and affect performance. Continue? [yes]: yesRouter# debug satellite firmware trcsatellite BackBone trace debugging is onRouter#2d06h: Satellite2/0 strrec 0, rec 0, count 256, trc 1a6dd78, str 1a5c600, end 1a74600count 4096, emp 1a6dd78, fil 1a6d8b0, lnknum=60 xmt 6 len 951 9 pd con 0 PF 3 ns 169 nr 15 a c12 0 0.0001 xmt 6 len 951 9 pd con 0 PF 3 ns 170 nr 15 a c12 0 0.0102 xmt 6 len 951 9 pd con 0 PF 3 ns 171 nr 15 a c12 0 0.0103 xmt 6 len 951 9 pd con 0 PF 3 ns 172 nr 15 a c12 0 0.0104 xmt 6 len 951 9 pd con 0 PF 3 ns 173 nr 15 a c12 0 0.0305 xmt 6 len2d06h: Satellite2/0 9512d06h: Satellite2/0 9 pd con 0 PF 3 ns 174 nr 15 a c12 0 0.0106 xmt 6 len 951 9 pd con 0 PF 3 ns 175 nr 15 a c12 0 0.0107 xmt 6 len 951 9 pd con 0 PF 3 ns 176 nr 15 a c12 0 0.0108 xmt 6 len 951 9 pd con 0 PF 3 ns 177 nr 15 a c12 0 0.0109 xmt 6 len 951 9 pd con 0 PF 3 ns 178 nr 15 a c12 0 0.01010 xmt 6 len 951 9 pd con 0 PF 3 ns 179 nr 15 a c12 0 0.01011 xmt 6 len 951 9 pd con 0 PF 3 ns 180 nr 15 a c12 0 0.010Related Commands
debug satellite
Enables debugging output for the Cisco IP VSAT satellite WAN network module (NM-1VSAT-GILAT).
debug sccp
To display debugging information for Simple Client Control Protocol (SCCP) and its related applications (transcoding and conferencing), use the debug sccp command in privileged EXEC mode. To disable debugging output, use the no form of this command.
debug sccp {all | errors | events | packets | parser}
no debug sccp
Syntax Description
all
All SCCP debug-trace information.
errors
SCCP errors.
events
SCCP events.
packets
SCCP packets.
parser
SCCP parser and builder.
Command Modes
Privileged EXEC
Command History
Usage Guidelines
The router on which this command is used must be equipped with one or more digital T1/E1 packet voice trunk network modules (NM-HDVs) or high-density voice (HDV) transcoding and conferencing digital signal processor (DSP) farms (NM-HDV-FARMs) to provide DSP resources.
Debugging is turned on for all DSP farm service sessions. You can debug multiple sessions simultaneously, with different levels of debugging for each.
Examples
The following is sample output from the debug sccp events command:
Router# debug sccp eventsSkinny Client Control Protocol events debugging is on*Mar 1 00:46:29: sccp_create_application: send keepalive msg, appl 6248F760, appl_type 1, count 0*Mar 1 00:46:29: sccp_keepalive: send keepalive id 0, len 4*Mar 1 00:46:29: sccp_process_mtp_pdu: appl - 6248F760, mbuf - 6248F7D4*Mar 1 00:46:29: sccp_process_mtp_pdu: msg_ptr 6248F7DC, len 4, offset 12, msg_id 256*Mar 1 00:46:30: sccp_create_application: send keepalive msg, appl 6248FC10, appl_type 2, count 0*Mar 1 00:46:30: sccp_keepalive: send keepalive id 0, len 4*Mar 1 00:46:30: sccp_process_mtp_pdu: appl - 6248FC10, mbuf - 6248FC84*Mar 1 00:46:30: sccp_process_mtp_pdu: msg_ptr 6248FC8C, len 4, offset 12, msg_id 256*Mar 1 00:46:37: sccp_create_application: send keepalive msg, appl 6248F760, appl_type 1, count 0*Mar 1 00:46:37: sccp_keepalive: send keepalive id 0, len 4*Mar 1 00:46:37: sccp_process_mtp_pdu: appl - 6248F760, mbuf - 6248F7D4*Mar 1 00:46:37: sccp_process_mtp_pdu: msg_ptr 6248F7DC, len 4, offset 12, msg_id 256*Mar 1 00:46:37: sccp_create_application: send keepalive msg, appl 6248FC10, appl_type 2, count 0*Mar 1 00:46:37: sccp_keepalive: send keepalive id 0, len 4*Mar 1 00:46:38: sccp_process_mtp_pdu: appl - 6248FC10, mbuf - 6248FC84*Mar 1 00:46:38: sccp_process_mtp_pdu: msg_ptr 6248FC8C, len 4, offset 12, msg_id 256*Mar 1 00:46:43: sccp_process_mtp_pdu: appl - 6248FC10, mbuf - 6248FC84*Mar 1 00:46:43: sccp_process_mtp_pdu: msg_ptr 6248FC8C, len 28, offset 36, msg_id 261*Mar 1 00:46:43: xapp_open_receive_chnl: SCCP orc_msg - 6248FC8C, appl - 6248FC10*Mar 1 00:46:43: xapp_search_for_chnl_rec: sess_id 27, conn_id 2769*Mar 1 00:46:43: xapp_add_chnl_rec: chnl 631142BC*Mar 1 00:46:43: xapp_add_sess_rec: Add sess_rec (63114360) record*Mar 1 00:46:43: xapp_open_receive_chnl: stat 0, eve 0, sid 27, cid 2769, codec 1, pkt-period 20*Mar 1 00:46:43: xapp_open_chnl_request: chnl_rec 631142BC*Mar 1 00:46:43: xapp_open_chnl_request: chnl_rec 631142BC, sess_id 27, conn_id 2769, cstate 0, nstate 1*Mar 1 00:46:43: xapp_dequeue_and_process_dspf_events: chnl_rec 631142BC, state 1, eve_id 1*Mar 1 00:46:43: xapp_open_chnl_success: chnl_rec 631142BC*Mar 1 00:46:43: xapp_open_chnl_success: chnl_rec 631142BC, sess_id 27, conn_id 2769, cstate 1, nstate 2, lc_ipaddr 10.10.1.1, lport 21066*Mar 1 00:46:43: sccp_process_mtp_pdu: appl - 6248FC10, mbuf - 6248FC84*Mar 1 00:46:43: sccp_process_mtp_pdu: msg_ptr 6248FC8C, len 28, offset 36, msg_id 261*Mar 1 00:46:43: xapp_open_receive_chnl: SCCP orc_msg - 6248FC8C, appl - 6248FC10*Mar 1 00:46:43: xapp_search_for_chnl_rec: sess_id 27, conn_id 2785*Mar 1 00:46:43: xapp_add_chnl_rec: chnl 631142E4*Mar 1 00:46:43: xapp_open_receive_chnl: stat 0, eve 0, sid 27, cid 2785, codec 1, pkt-period 20*Mar 1 00:46:43: xapp_open_chnl_request: chnl_rec 631142E4*Mar 1 00:46:43: xapp_open_chnl_request: chnl_rec 631142E4, sess_id 27, conn_id 2785, cstate 0, nstate 1*Mar 1 00:46:43: xapp_dequeue_and_process_dspf_events: chnl_rec 631142E4, state 1, eve_id 1*Mar 1 00:46:43: xapp_open_chnl_success: chnl_rec 631142E4*Mar 1 00:46:43: xapp_open_chnl_success: chnl_rec 631142E4, sess_id 27, conn_id 2785, cstate 1, nstate 2, lc_ipaddr 10.10.1.1, lport 25706*Mar 1 00:46:43: sccp_process_mtp_pdu: appl - 6248FC10, mbuf - 6248FC84*Mar 1 00:46:43: sccp_process_mtp_pdu: msg_ptr 6248FC8C, len 44, offset 52, msg_id 138*Mar 1 00:46:43: xapp_start_media_transmission: SCCP stmt_msg - 6248FC8C, appl - 6248FC10*Mar 1 00:46:43: xapp_search_for_chnl_rec: sess_id 27, conn_id 2769*Mar 1 00:46:43: xapp_start_media_transmission: chnl_rec 631142BC, stat 2, sid 27, cid 2769, ripaddr 10.10.1.5, rport 32148, codec 1, pkt-period 20, pre 11, silen 16777500, mfpp 1*Mar 1 00:46:43: xapp_modify_chnl_request: chnl_rec 631142BC*Mar 1 00:46:43: xapp_modify_chnl_request: chnl_rec 631142BC, sess_id 27, conn_id 2769, cstate 2, nstate 2*Mar 1 00:46:43: xapp_dequeue_and_process_dspf_events: chnl_rec 631142BC, state 2, eve_id 4*Mar 1 00:46:43: xapp_modify_chnl_success: chnl_rec 631142BC, sess_id 27, conn_id 2769, cstate 2*Mar 1 00:46:43: sccp_process_mtp_pdu: appl - 6248FC10, mbuf - 6248FC84*Mar 1 00:46:43: sccp_process_mtp_pdu: msg_ptr 6248FC8C, len 44, offset 52, msg_id 138*Mar 1 00:46:43: xapp_start_media_transmission: SCCP stmt_msg - 6248FC8C, appl - 6248FC10*Mar 1 00:46:43: xapp_search_for_chnl_rec: sess_id 27, conn_id 2785*Mar 1 00:46:43: xapp_start_media_transmission: chnl_rec 631142E4, stat 2, sid 27, cid 2785, ripaddr 10.10.1.7, rport 16422, codec 1, pkt-period 20, pre 11, silen 16777501, mfpp 1*Mar 1 00:46:43: xapp_modify_chnl_request: chnl_rec 631142E4*Mar 1 00:46:43: xapp_modify_chnl_request: chnl_rec 631142E4, sess_id 27, conn_id 2785, cstate 2, nstate 2*Mar 1 00:46:43: xapp_dequeue_and_process_dspf_events: chnl_rec 631142E4, state 2, eve_id 4*Mar 1 00:46:43: xapp_modify_chnl_success: chnl_rec 631142E4, sess_id 27, conn_id 2785, cstate 2*Mar 1 00:46:44: sccp_create_application: send keepalive msg, appl 6248F760, appl_type 1, count 0*Mar 1 00:46:44: sccp_keepalive: send keepalive id 0, len 4*Mar 1 00:46:45: sccp_process_mtp_pdu: appl - 6248F760, mbuf - 6248F7D4*Mar 1 00:46:45: sccp_process_mtp_pdu: msg_ptr 6248F7DC, len 4, offset 12, msg_id 256*Mar 1 00:46:45: sccp_create_application: send keepalive msg, appl 6248FC10, appl_type 2, count 0*Mar 1 00:46:45: sccp_keepalive: send keepalive id 0, len 4*Mar 1 00:46:46: sccp_process_mtp_pdu: appl - 6248FC10, mbuf - 6248FC84*Mar 1 00:46:46: sccp_process_mtp_pdu: msg_ptr 6248FC8C, len 4, offset 12, msg_id 256*Mar 1 00:46:47: sccp_process_mtp_pdu: appl - 6248FC10, mbuf - 6248FC84*Mar 1 00:46:47: sccp_process_mtp_pdu: msg_ptr 6248FC8C, len 28, offset 36, msg_id 261*Mar 1 00:46:47: xapp_open_receive_chnl: SCCP orc_msg - 6248FC8C, appl - 6248FC10*Mar 1 00:46:47: xapp_search_for_chnl_rec: sess_id 27, conn_id 2817*Mar 1 00:46:47: xapp_add_chnl_rec: chnl 6311430C*Mar 1 00:46:47: xapp_open_receive_chnl: stat 0, eve 0, sid 27, cid 2817, codec 1, pkt-period 20*Mar 1 00:46:47: xapp_open_chnl_request: chnl_rec 6311430C*Mar 1 00:46:47: xapp_open_chnl_request: chnl_rec 6311430C, sess_id 27, conn_id 2817, cstate 0, nstate 1*Mar 1 00:46:47: xapp_dequeue_and_process_dspf_events: chnl_rec 6311430C, state 1, eve_id 1*Mar 1 00:46:47: xapp_open_chnl_success: chnl_rec 6311430C*Mar 1 00:46:47: xapp_open_chnl_success: chnl_rec 6311430C, sess_id 27, conn_id 2817, cstate 1, nstate 2, lc_ipaddr 10.10.1.1, lport 16730*Mar 1 00:46:47: sccp_process_mtp_pdu: appl - 6248FC10, mbuf - 6248FC84*Mar 1 00:46:47: sccp_process_mtp_pdu: msg_ptr 6248FC8C, len 44, offset 52, msg_id 138*Mar 1 00:46:47: xapp_start_media_transmission: SCCP stmt_msg - 6248FC8C, appl - 6248FC10*Mar 1 00:46:47: xapp_search_for_chnl_rec: sess_id 27, conn_id 2817*Mar 1 00:46:47: xapp_start_media_transmission: chnl_rec 6311430C, stat 2, sid 27, cid 2817, ripaddr 10.10.1.6, rport 18160, codec 1, pkt-period 20, pre 11, silen 16777502, mfpp 1*Mar 1 00:46:47: xapp_modify_chnl_request: chnl_rec 6311430C*Mar 1 00:46:47: xapp_modify_chnl_request: chnl_rec 6311430C, sess_id 27, conn_id 2817, cstate 2, nstate 2*Mar 1 00:46:47: xapp_dequeue_and_process_dspf_events: chnl_rec 6311430C, state 2, eve_id 4*Mar 1 00:46:47: xapp_modify_chnl_success: chnl_rec 6311430C, sess_id 27, conn_id 2817, cstate 2*Mar 1 00:46:52: sccp_create_application: send keepalive msg, appl 6248F760, appl_type 1, count 0*Mar 1 00:46:52: sccp_keepalive: send keepalive id 0, len 4*Mar 1 00:46:52: sccp_process_mtp_pdu: appl - 6248F760, mbuf - 6248F7D4*Mar 1 00:46:52: sccp_process_mtp_pdu: msg_ptr 6248F7DC, len 4, offset 12, msg_id 256*Mar 1 00:46:53: sccp_create_application: send keepalive msg, appl 6248FC10, appl_type 2, count 0*Mar 1 00:46:53: sccp_keepalive: send keepalive id 0, len 4*Mar 1 00:46:54: sccp_process_mtp_pdu: appl - 6248FC10, mbuf - 6248FC84*Mar 1 00:46:54: sccp_process_mtp_pdu: msg_ptr 6248FC8C, len 4, offset 12, msg_id 256*Mar 1 00:46:59: sccp_create_application: send keepalive msg, appl 6248F760, appl_type 1, count 0*Mar 1 00:46:59: sccp_keepalive: send keepalive id 0, len 4*Mar 1 00:47:00: sccp_process_mtp_pdu: appl - 6248F760, mbuf - 6248F7D4*Mar 1 00:47:00: sccp_process_mtp_pdu: msg_ptr 6248F7DC, len 4, offset 12, msg_id 256*Mar 1 00:47:01: sccp_create_application: send keepalive msg, appl 6248FC10, appl_type 2, count 0*Mar 1 00:47:01: sccp_keepalive: send keepalive id 0, len 4*Mar 1 00:47:01: sccp_process_mtp_pdu: appl - 6248FC10, mbuf - 6248FC84*Mar 1 00:47:01: sccp_process_mtp_pdu: msg_ptr 6248FC8C, len 4, offset 12, msg_id 256*Mar 1 00:47:07: sccp_create_application: send keepalive msg, appl 6248F760, appl_type 1, count 0*Mar 1 00:47:07: sccp_keepalive: send keepalive id 0, len 4*Mar 1 00:47:07: sccp_process_mtp_pdu: appl - 6248F760, mbuf - 6248F7D4*Mar 1 00:47:07: sccp_process_mtp_pdu: msg_ptr 6248F7DC, len 4, offset 12, msg_id 256*Mar 1 00:47:08: sccp_create_application: send keepalive msg, appl 6248FC10, appl_type 2, count 0*Mar 1 00:47:08: sccp_keepalive: send keepalive id 0, len 4*Mar 1 00:47:09: sccp_process_mtp_pdu: appl - 6248FC10, mbuf - 6248FC84*Mar 1 00:47:09: sccp_process_mtp_pdu: msg_ptr 6248FC8C, len 4, offset 12, msg_id 256*Mar 1 00:47:14: sccp_create_application: send keepalive msg, appl 6248F760, appl_type 1, count 0*Mar 1 00:47:14: sccp_keepalive: send keepalive id 0, len 4*Mar 1 00:47:15: sccp_process_mtp_pdu: appl - 6248F760, mbuf - 6248F7D4*Mar 1 00:47:15: sccp_process_mtp_pdu: msg_ptr 6248F7DC, len 4, offset 12, msg_id 256*Mar 1 00:47:16: sccp_create_application: send keepalive msg, appl 6248FC10, appl_type 2, count 0*Mar 1 00:47:16: sccp_keepalive: send keepalive id 0, len 4*Mar 1 00:47:16: sccp_process_mtp_pdu: appl - 6248FC10, mbuf - 6248FC84*Mar 1 00:47:16: sccp_process_mtp_pdu: msg_ptr 6248FC8C, len 4, offset 12, msg_id 256*Mar 1 00:47:22: sccp_create_application: send keepalive msg, appl 6248F760, appl_type 1, count 0*Mar 1 00:47:22: sccp_keepalive: send keepalive id 0, len 4*Mar 1 00:47:22: sccp_process_mtp_pdu: appl - 6248F760, mbuf - 6248F7D4*Mar 1 00:47:22: sccp_process_mtp_pdu: msg_ptr 6248F7DC, len 4, offset 12, msg_id 256*Mar 1 00:47:23: sccp_create_application: send keepalive msg, appl 6248FC10, appl_type 2, count 0*Mar 1 00:47:23: sccp_keepalive: send keepalive id 0, len 4*Mar 1 00:47:24: sccp_process_mtp_pdu: appl - 6248FC10, mbuf - 6248FC84*Mar 1 00:47:24: sccp_process_mtp_pdu: msg_ptr 6248FC8C, len 4, offset 12, msg_id 256*Mar 1 00:47:29: sccp_create_application: send keepalive msg, appl 6248F760, appl_type 1, count 0*Mar 1 00:47:29: sccp_keepalive: send keepalive id 0, len 4*Mar 1 00:47:30: sccp_process_mtp_pdu: appl - 6248F760, mbuf - 6248F7D4*Mar 1 00:47:30: sccp_process_mtp_pdu: msg_ptr 6248F7DC, len 4, offset 12, msg_id 256*Mar 1 00:47:31: sccp_create_application: send keepalive msg, appl 6248FC10, appl_type 2, count 0*Mar 1 00:47:31: sccp_keepalive: send keepalive id 0, len 4*Mar 1 00:47:31: sccp_process_mtp_pdu: appl - 6248FC10, mbuf - 6248FC84*Mar 1 00:47:31: sccp_process_mtp_pdu: msg_ptr 6248FC8C, len 4, offset 12, msg_id 256Related Commands
debug sccp config
To enable Skinny Client Control Protocol (SCCP) event debugging, use the debug sccp config command in privileged EXEC mode. To disable debugging output, use the no form of this command.
debug sccp config {all | errors | events | parser}
no debug sccp config {all | errors | events | parser}
Syntax Description
all
Displays all SCCP autoconfiguration debug trace.
errors
Displays SCCP autoconfiguration errors.
events
Displays SCCP autoconfiguration events.
parser
Displays SCCP autoconfiguration parser.
Command Default
Disabled
Command Modes
Privileged EXEC
Command History
Examples
The following example shows the debug sccp config command used to enable SCCP event debugging and to display SCCP autoconfiguration events:
Router# debug sccp config events...Feb 8 02:17:31.119: mp_auto_cfg_request(req_id=2, prof=995, ccm_group_id=0)Feb 8 02:17:31.123: mp_auto_cfg_is_up: SCCP auto-config is enabled & registered...Table 288 describes the significant fields shown in the display.
Related Commands
debug sdlc
To display information on Synchronous Data Link Control (SDLC) frames received and sent by any router serial interface involved in supporting SDLC end station functions, use the debug sdlc command in privileged EXEC mode. To disable debugging output, use the no form of this command.
debug sdlc
no debug sdlc
Syntax Description
This command has no arguments or keywords.
Command Modes
Privileged EXEC
Usage Guidelines
Note
Examples
The following is sample output from the debug sdlc command:
Router# debug sdlcSDLC: Sending RR at location 4Serial3: SDLC O (12495952) C2 CONNECT (2) RR P/F 6Serial3: SDLC I (12495964) [C2] CONNECT (2) RR P/F 0 (R) [VR: 6 VS: 0]Serial3: SDLC T [C2] 12496064 CONNECT 12496064 0SDLC: Sending RR at location 4Serial3: SDLC O (12496064) C2 CONNECT (2) RR P/F 6Serial3: SDLC I (12496076) [C2] CONNECT (2) RR P/F 0 (R) [VR: 6 VS: 0]Serial3: SDLC T [C2] 12496176 CONNECT 12496176 0The following line of output indicates that the router is sending a Receiver Ready packet at location 4 in the code:
SDLC: Sending RR at location 4The following line of output describes a frame output event:
Serial1/0: SDLC O 04 CONNECT (285) IFRAME P/F 6Table 289 describes the significant fields shown in the display.
The following line of output describes a frame input event:
Serial1/0: SDLC I 02 CONNECT (16) IFRAME P 7 0,[VR: 7 VS: 0]Table 290 describes the significant fields shown in the display.
The following line of output describes a frame timer event:
Serial1/0: SDLC T 02 CONNECT 0x9CB69E8 P 0Table 291 describes the significant fields shown in the display.
Related Commands
debug list
Filters debugging information on a per-interface or per-access list basis.
debug sdlc local-ack
To display information on the local acknowledgment feature, use the debug sdlc local-ack command in privileged EXEC mode. To disable debugging output, use the no form of this command.
debug sdlc local-ack [number]
no debug sdlc local-ack [number]
Syntax Description
Command Modes
Privileged EXEC
Usage Guidelines
You can select the frame types you want to monitor; the frame types correspond to bit flags. You can select 1, 2, 4, or 7, which is the decimal value of the bit flag settings. If you select 1, the octet is set to 00000001. If you select 2, the octet is set to 0000010. If you select 4, the octet is set to 00000100. If you want to select all frame types, select 7; the octet is 00000111. The default is 7 for all events. Table 292 defines these bit flags.
Caution
Examples
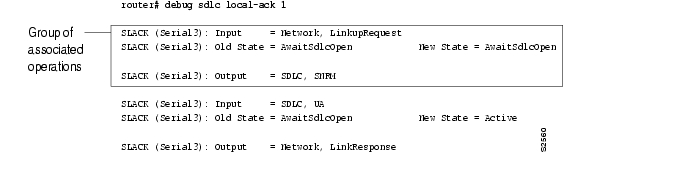
The following is sample output from the debug sdlc local-ack command:
The first line shows the input to the SDLC local acknowledgment state machine:
SLACK (Serial3): Input = Network, LinkupRequestTable 293 describes the significant fields shown in the display.
The second line shows the change in the SDLC local acknowledgment state machine. In this case the AwaitSdlcOpen state is an internal state that has not changed while this display was captured.
SLACK (Serial3): Old State = AwaitSdlcOpen New State = AwaitSdlcOpenThe third line shows the output from the SDLC local acknowledgment state machine:
SLACK (Serial3): Output = SDLC, SNRMdebug sdlc packet
To display packet information on Synchronous Data Link Control (SDLC) frames received and sent by any router serial interface involved in supporting SDLC end station functions, use the debug sdlc packet command in privileged EXEC mode. To disable debugging output, use the no form of this command.
debug sdlc packet [max-bytes]
no debug sdlc packet [max-bytes]
Syntax Description
Command Modes
Privileged EXEC
Usage Guidelines
This command requires intensive CPU processing; therefore, we recommend not using it when the router is expected to handle normal network loads, such as in a production environment. Instead, use this command when network response is noncritical. We also recommend that you use this command by itself, rather than in conjunction with other debug commands.
Examples
The following is sample output from the debug sdlc packet command with the packet display limited to 20 bytes of data:
Router# debug sdlc packet 20Serial3 SDLC Output00000 C3842C00 02010010 019000C5 C5C5C5C5 Cd.........EEEEE00010 C5C5C5C5 EEEESerial3 SDLC Output00000 C3962C00 02010011 039020F2 Co.........2Serial3 SDLC Output00000 C4962C00 0201000C 039020F2 Do.........2Serial3 SDLC Input00000 C491 Djdebug serial interface
To display information on a serial connection failure, use the debug serial interface command in privileged EXEC mode. To disable debugging output, use the no form of this command.
debug serial interface
no debug serial interface
Syntax Description
This command has no arguments or keywords.
Command Modes
Privileged EXEC
Usage Guidelines
If the show interface serial EXEC command shows that the line and protocol are down, you can use the debug serial interface command to isolate a timing problem as the cause of a connection failure. If the keepalive values in the mineseq, yourseen, and myseen fields are not incrementing in each subsequent line of output, there is a timing or line problem at one end of the connection.
Caution
The output of the debug serial interface command can vary, depending on the type of WAN configured for an interface: Frame Relay, High-Level Data Link Control (HDL) , High-Speed Serial Interface (HSSI), SMDS, or X.25. The output also can vary depending on the type of encapsulation configured for that interface. The hardware platform also can affect debug serial interface output.
Examples
The following sections show and describe sample debug serial interface output for various configurations.
Debug Serial Interface for Frame Relay Encapsulation
The following message is displayed if the encapsulation for the interface is Frame Relay (or HDLC) and the router attempts to send a packet containing an unknown packet type:
Illegal serial link type code xxxDebug Serial Interface for HDLC
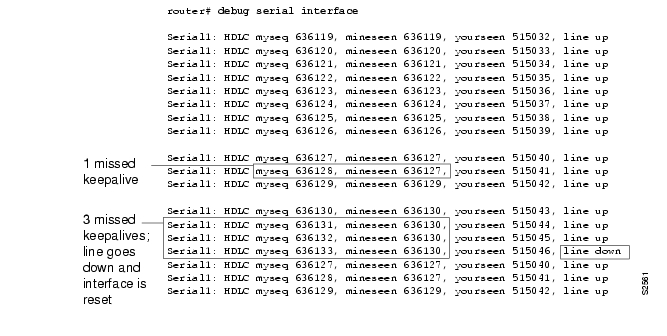
The following is sample output from the debug serial interface command for an HDLC connection when keepalives are enabled. This output shows that the remote router is not receiving all the keepalives the router is sending. When the difference in the values in the myseq and mineseen fields exceeds three, the line goes down and the interface is reset.
Table 294 describes the significant fields shown in the display.
Table 295 describes additional error messages that the debug serial interface command can generate for HDLC.
Debug Serial Interface for HSSI
On an HSSI interface, the debug serial interface command can generate the following additional error message:
HSSI0: Reset from 0xnnnnnnnThis message indicates that the HSSI hardware has been reset. The 0xnnnnnnn variable is the address of the routine requesting that the hardware be reset; this value is useful only to development engineers.
Debug Serial Interface for ISDN Basic Rate
Table 296 describes error messages that the debug serial interface command can generate for ISDN Basic Rate.
Debug Serial Interface for an MK5025 Device
Table 297 describes the additional error messages that the debug serial interface command can generate for an MK5025 device.
Debug Serial Interface for SMDS Encapsulation
When encapsulation is set to SMDS, the debug serial interface command displays SMDS packets that are sent and received, and any error messages resulting from SMDS packet transmission.
The error messages that the debug serial interface command can generate for SMDS follow.
The following message indicates that a new protocol requested SMDS to encapsulate the data for transmission. SMDS is not yet able to encapsulate the protocol.
SMDS: Error on Serial 0, encapsulation bad protocol = xThe following message indicates that SMDS was asked to encapsulate a packet, but no corresponding destination E.164 SMDS address was found in any of the static SMDS tables or in the ARP tables:
SMDS send: Error in encapsulation, no hardware address, type = xThe following message indicates that a protocol such as Connectionless Network Service (CLNS) or IP has been enabled on an SMDS interface, but the corresponding multicast addresses have not been configured. The n variable displays the link type for which encapsulation was requested.
SMDS: Send, Error in encapsulation, type=nThe following messages can occur when a corrupted packet is received on an SMDS interface. The router expected x, but received y.
SMDS: Invalid packet, Reserved NOT ZERO, x ySMDS: Invalid packet, TAG mismatch x ySMDS: Invalid packet, Bad TRAILER length x yThe following messages can indicate an invalid length for an SMDS packet:
SMDS: Invalid packet, Bad BA length xSMDS: Invalid packet, Bad header extension length xSMDS: Invalid packet, Bad header extension type xSMDS: Invalid packet, Bad header extension value xThe following messages are displayed when the debug serial interface command is enabled:
Interface Serial 0 Sending SMDS L3 packet:SMDS: dgsize:x type:0xn src:y dst:zIf the debug serial interface command is enabled, the following message can be displayed when a packet is received on an SMDS interface, but the destination SMDS address does not match any on that interface:
SMDS: Packet n, not addressed to usdebug serial lead-transition
To activate the leads status transition debug capability for all capable ports, use the debug serial lead-transition command in privileged EXEC mode. To disable debugging output, use the no form of this command.
debug serial lead-transition
no debug serial lead-transition
Syntax Description
This command has no arguments or keywords.
Defaults
Debugging is not turned on.
Command Modes
Privileged EXEC
Command History
Usage Guidelines
To control which port is to be reported and therefore reduce the risk of flooding the console screen with debug information, enter the debug condition interface serial slot/port command after using the debug serial lead-transition command to set the condition.
Caution
Examples
The following example shows the serial control leads reported for slot 1, port 1:
Router# debug serial lead-transitionRouter# debug condition interface serial 1/1*Mar 1 00:17:15.040:slot(1) Port(1):DSR/DTR is Deasserted*Mar 1 00:17:15.040:slot(1) Port(1):CTS/RTS is Deasserted*Mar 1 00:17:47.955:slot(1) Port(1):DCD/Local Loop is Deasserted*Mar 1 00:17:47.955:slot(1) Port(1):DSR/DTR is Deasserted*Mar 1 00:17:47.955:slot(1) Port(1):CTS/RTS is DeassertedRouter# no shut down serial 1/1*Mar 1 00:16:52.298:slot(1) Port(1):DSR/DTR is Asserted*Mar 1 00:16:52.298:slot(1) Port(1):CTS/RTS is Asserted*Mar 1 00:16:31.648:slot(1) Port(1):DCD/Local Loop is Asserted*Mar 1 00:16:31.648:slot(1) Port(1):DSR/DTR is Asserted*Mar 1 00:16:31.648:slot(1) Port(1):CTS/RTS is AssertedTable 298 describes significant fields shown in the displays.
Related Commands
debug condition interface serial
Enables conditional debugging on a serial interface.
debug serial packet
To display more detailed serial interface debugging information than you can obtain using the debug serial interface command, use the debug serial packet command in privileged EXEC mode. To disable debugging output, use the no form of this command.
debug serial packet
no debug serial packet
Syntax Description
This command has no arguments or keywords.
Command Modes
Privileged EXEC
Usage Guidelines
The debug serial packet command generates output that is dependent on the type of serial interface and the encapsulation running on that interface. The hardware platform also can impact debug serial packet output.
The debug serial packet command displays output for only Switched Multimegabit Data Service (SMDS) encapsulations.
Examples
The following is sample output from the debug serial packet command when SMDS is enabled on the interface:
Router# debug serial packetInterface Serial2 Sending SMDS L3 packet:SMDS Header: Id: 00 RSVD: 00 BEtag: EC Basize: 0044Dest:E18009999999FFFF Src:C12015804721FFFF Xh:04030000030001000000000000000000SMDS LLC: AA AA 03 00 00 00 80 38SMDS Data: E1 19 01 00 00 80 00 00 0C 00 38 1F 00 0A 00 80 00 00 0C 01 2B 71SMDS Data: 06 01 01 0F 1E 24 00 EC 00 44 00 02 00 00 83 6C 7D 00 00 00 00 00SMDS Trailer: RSVD: 00 BEtag: EC Length: 0044As the output shows, when encapsulation is set to SMDS, the debug serial packet command displays the entire SMDS header (in hexadecimal notation), and some payload data on transmit or receive. This information is useful only when you have an understanding of the SMDS protocol. The first line of the output indicates either Sending or Receiving.
debug service-module
To display debugging information that monitors the detection and clearing of network alarms on the integrated channel service unit/data service unit (CSU/DSU) modules, use the debug service-module command in privileged EXEC mode. To disable debugging output, use the no form of this command.
debug service-module
no debug service-module
Syntax Description
This command has no arguments or keywords.
Command Modes
Privileged EXEC
Usage Guidelines
Use this command to enable and disable debug logging for the serial 0 and serial 1 interfaces when an integrated CSU/DSU is present. This command enables debugging on all interfaces.
Network alarm status can also be viewed through the use of the show service-module command.
Note
Examples
The following is sample output from the debug service-module command:
Router# debug service-moduleSERVICE_MODULE(1): loss of signal ended after duration 00:05:36SERVICE_MODULE(1): oos/oof ended after duration 01:05:14SERVICE_MODULE(0): Unit has no clockSERVICE_MODULE(0): detects loss of signalSERVICE_MODULE(0): loss of signal ended after duration 00:00:33debug sgbp dial-bids
To display large-scale dial-out negotiations between the primary network access server (NAS) and alternate NASs, use the debug sgbp dial-bids command in privileged EXEC mode. To disable debugging output, use the no form of this command.
debug sgbp dial-bids
no debug sgbp dial-bids
Syntax Description
This command has no arguments or keywords.
Command Modes
Privileged EXEC
Usage Guidelines
Use this command only when the sgbp dial-bids command has been configured.
Examples
The following is sample output from the debug sgbp dial-bids command:
Router# debug sgbp dial-bids*Jan 1 00:25:03.643: SGBP-RES: New bid add request: 4B0 8 2 1 DAC0 1 1This indicates a new dialout bid has started.*Jan 1 00:25:03.643: SGBP-RES: Sent Discover message to ID 7B09B71E 49 bytesThe bid request has been sent.*Jan 1 00:25:03.647: SGBP-RES: Received Message of 49 length:*Jan 1 00:25:03.647: SGBP-RES: header 5 30 0 312 0 0 2D 0 0 0 0 0 0 0 3 0 0 0 1 1E AF 3A 41 7B 9 B7 1E 8 15 B 3 2 C 6 0 0 DA C0 D 4 0 0 E 3 1 F 3 1*Jan 1 00:25:03.647:*Jan 1 00:25:03.647: SGBP RES: Scan: Message type: Offer*Jan 1 00:25:03.647: SGBP RES: Scan: Len is 45*Jan 1 00:25:03.647: SGBP RES: Scan: Transaction ID: 3*Jan 1 00:25:03.647: SGBP RES: Scan: Message ID: 1*Jan 1 00:25:03.647: SGBP RES: Scan: Client ID: 1EAF3A41*Jan 1 00:25:03.651: SGBP RES: Scan: Server ID: 7B09B71E*Jan 1 00:25:03.651: SGBP RES: Scan: Resource type 8 length 21*Jan 1 00:25:03.651: SGBP RES: Scan: Phy-Port Media type: ISDN*Jan 1 00:25:03.651: SGBP RES: Scan: Phy-Port Min BW: 56000*Jan 1 00:25:03.651: SGBP RES: Scan: Phy-Port Num Links: 0*Jan 1 00:25:03.651: SGBP RES: Scan: Phy-Port User class: 1*Jan 1 00:25:03.651: SGBP RES: Scan: Phy-Port Priority: 1*Jan 1 00:25:03.651: SGBP-RES: received 45 length Offer packet*Jan 1 00:25:03.651: SGBP-RES: Offer from 7B09B71E for Transaction 3 accepted*Jan 1 00:25:03.651: SGBP RES: Server is uncongested. Immediate winAn alternate network access server has responded and won the bid.*Jan 1 00:25:03.651: SGBP-RES: Bid Succeeded handle 7B09B71E Server-id 4B0*Jan 1 00:25:03.651: SGBP-RES: Sent Dial-Req message to ID 7B09B71E 66 bytesThe primary network access server has asked the alternate server to dial.*Jan 1 00:25:04.651: SGBP-RES: QScan: Purging entry*Jan 1 00:25:04.651: SGBP-RES: deleting entry 6112E204 1EAF3A41 from list...debug sgbp error
To display debugging messages about routing problems between members of a stack group, use the debug sgbp error command in privileged EXEC mode. To disable debugging output, use the no form of this command.
debug sgbp error
no debug sgbp error
Syntax Description
This command has no arguments or keywords.
Command Modes
Privileged EXEC
Command History
Usage Guidelines
Enter the debug sgbp error command to enable the display of debugging messages about routing problems between members of a stack group.
Note
Examples
One common configuration error is setting a source IP address for a stack member that does not match the locally defined IP address for the same stack member. The following debugging output shows the error message that results from this misconfiguration:
Systema# debug sgbp error%SGBP-7-DIFFERENT - systemb's addr 10.1.1.2 is different from hello's addr 10.3.4.5This error means that the source IP address of the Stack Group Bidding Protocol (SGBP) hello message received from systemb does not match the IP address configured locally for systemb (through the sgbp member command). Correct this configuration error by going to systemb and checking for multiple interfaces by which the SGBP hello can send the message.
Another common error message is:
Systema# debug sgbp error%SGBP-7-MISCONF, Possible misconfigured member routerk (10.1.1.6)This error message means that routerk is not defined locally, but is defined on another stack member. Correct this configuration error by defining routerk across all members of the stack group using the sgbp member command.
The following error message indicates that an SGBP peer is leaving the stack group:
Systema# debug sgbp error%SGBP-7-LEAVING:Member systemc leaving group stack1This error message indicates that the peer systemc is leaving the stack group. Systemc could be leaving the stack group intentionally, or a connectivity problem may exist.
The following error message indicates that an SGBP event was detected from an unknown peer:
Systema# debug sgbp error%SGBP-7-UNKNOWPEER:Event 0x10 from peer at 172.21.54.3An SGBP event came from a network host that was not recognizable as an SGBP peer. Check to see if a network media error could have corrupted the address, or if peer equipment is malfunctioning to generate corrupted packets. Depending on the network topology and firewall of your network, SGBP packets from a nonpeer host could indicate probing and attempts to breach security.
Note
Related Commands
debug sgbp hellos
To display debugging messages for authentication between stack members, use the debug sgbp hellos command in privileged EXEC mode. To disable debugging output, use the no form of this command.
debug sgbp hellos
no debug sgbp hellos
Syntax Description
This command has no arguments or keywords.
Command Modes
Privileged EXEC
Command History
Usage Guidelines
Use the debug sgbp hellos command to enable the display of debugging messages for authentication between routers configured as members of a stack group.
Note
Examples
The following output from the debug sgbp hellos command shows systema sending a successful Challenge Handshake Authentication Protocol (CHAP) challenge to and receiving a response from systemb. Similarly, systemb sends out a challenge and receives a response from systema.
systema# debug sgbp hellos%SGBP-7-CHALLENGE: Send Hello Challenge to systemb group stack1%SGBP-7-CHALLENGED: Hello Challenge message from member systemb (10.1.1.2)%SGBP-7-RESPONSE: Send Hello Response to systemb group stack1%SGBP-7-CHALLENGE: Send Hello Challenge to systemb group stack1%SGBP-7-RESPONDED: Hello Response message from member systemb (10.1.1.2)%SGBP-7-AUTHOK: Send Hello Authentication OK to member systemb (10.1.1.2)%SGBP-7-INFO: Addr = 10.1.1.2 Reference = 0xC347DF7%SGBP-5-ARRIVING: New peer event for member systembThis debug output is self-explanatory.
If authentication fails, you may see one of the following messages in your debug output:
%SGBP-7-AUTHFAILED - Member systemb failed authenticationThis error message means that the remote systemb password for the stack group does not match the password defined on systema. To correct this error, make sure that both systema and systemb have the same password defined using the username command.
%SGBP-7-NORESP -Fail to respond to systemb group stack1, may not have password.This error message means that systema does not have a username or password defined. To correct this error, define a common group password across all stack members using the username command.
Related Commands
debug sgcp
To debug the Simple Gateway Control Protocol (SGCP), use the debug sgcp command in privileged EXEC mode. To disable debugging output, use the no form of this command.
debug sgcp {errors | events | packet}
no debug sgcp {errors | events | packet}
Syntax Description
errors
Displays debug information about SGCP errors.
events
Displays debug information about SGCP events.
packet
Displays debug information about SGCP packets.
Command Modes
Privileged EXEC
Command History
12.0(5)T
This command was introduced.
12.0(7)T
Support for this command was extended to the Cisco uBR924 cable access router.
Examples
See the following examples to enable and disable debugging at the specified level:
Router# debug sgcp errorsSimple Gateway Control Protocol errors debugging is onRouter# no debug sgcp errorsSimple Gateway Control Protocol errors debugging is offRouter#Router# debug sgcp eventsSimple Gateway Control Protocol events debugging is onRouter# no debug sgcp eventsSimple Gateway Control Protocol events debugging is offRouter#Router# debug sgcp packetSimple Gateway Control Protocol packets debugging is onRouter# no debug sgcp packetSimple Gateway Control Protocol packets debugging is offRouter#Related Commands
debug sgcp errors
To debug Simple Gateway Control Protocol (SGCP) errors, use the debug sgcp errors command in privileged EXEC mode. To disable debugging output, use the no form of this command.
debug sgcp errors [endpoint string]
no debug sgcp errors
Syntax Description
Defaults
No default behavior or values
Command Modes
Privileged EXEC
Command History
Examples
The following example shows the debugging of SGCP errors being enabled:
Router# debug sgcp errorsSimple Gateway Control Protocol errors debugging is onno errors since call went through successfully.The following example shows a debug trace for SGCP errors on a specific endpoint:
Router# debug sgcp errors endpoint DS1-0/1End point name for error debug:DS1-0/1 (1)00:08:41:DS1 = 0, DS0 = 100:08:41:Call record found00:08:41:Enable error end point debug for (DS1-0/1)Related Commands
debug sgcp events
To debug Simple Gateway Control Protocol (SGCP) events, use the debug sgcp events command in privileged EXEC mode. To disable debugging output, use the no form of this command.
debug sgcp events [endpoint string]
no debug sgcp events
Syntax Description
Defaults
No default behavior or values
Command Modes
Privileged EXEC
Command History
Examples
The following example shows a debug trace for SGCP events on a specific endpoint:
Router# debug sgcp events endpoint DS1-0/1End point name for event debug:DS1-0/1 (1)00:08:54:DS1 = 0, DS0 = 100:08:54:Call record found00:08:54:Enable event end point debug for (DS1-0/1)The following example shows a debug trace for all SGCP events on a gateway:
Router# debug sgcp events*Mar 1 01:13:31.035:callp :19196BC, state :0, call ID :-1, event :23*Mar 1 01:13:31.035:voice_if->call_agent_ipaddr used as Notify entityNotify entity available for Tx SGCP msgNTFY send to ipaddr=1092E01 port=2427*Mar 1 01:13:31.039:Push msg into SGCP wait ack queue* (1)[25]*Mar 1 01:13:31.039:Timed Out interval [1]:(2000)*Mar 1 01:13:31.039:Timed Out interval [1]:(2000)(0):E[25]*Mar 1 01:13:31.075:Removing msg :NTFY 25 ds1-1/13@mc1 SGCP 1.1X:358258758O:hd*Mar 1 01:13:31.075:Unqueue msg from SGCP wait ack q** (0)[25]DS1 = 1, DS0 = 13*Mar 1 01:13:31.091:callp :19196BC, vdbptr :1964EEC, state :1*Mar 1 01:13:31.091:Checking ack (trans ID 237740140) :*Mar 1 01:13:31.091:is_capability_ok:caps.codec=5, caps.pkt=10, caps.nt=8*Mar 1 01:13:31.091:is_capability_ok:supported signal=0x426C079C, signal2=0x80003,event=0x6003421F, event2=0x3FDrequested signal=0x0, signal2=0x0,event=0x20000004, event2=0xC*Mar 1 01:13:31.091:Same digit map is download (ds1-1/13@mc1)*Mar 1 01:13:31.091:R:requested trans_id (237740140)*Mar 1 01:13:31.091:process_signal_ev:seizure possible=1, signal mask=0x4, mask2=0x0*Mar 1 01:13:32.405:SGCP Session Appl:ignore CCAPI event 10*Mar 1 01:13:32.489:callp :19196BC, state :1, call ID :16, event :9*Mar 1 01:13:32.610:SGCP Session Appl:ignore CCAPI event 10*Mar 1 01:13:32.670:callp :19196BC, state :1, call ID :16, event :9*Mar 1 01:13:32.766:SGCP Session Appl:ignore CCAPI event 10*Mar 1 01:13:32.810:callp :19196BC, state :1, call ID :16, event :9*Mar 1 01:13:32.931:SGCP Session Appl:ignore CCAPI event 10*Mar 1 01:13:32.967:callp :19196BC, state :1, call ID :16, event :9*Mar 1 01:13:33.087:SGCP Session Appl:ignore CCAPI event 10*Mar 1 01:13:33.132:callp :19196BC, state :1, call ID :16, event :9*Mar 1 01:13:33.240:SGCP Session Appl:ignore CCAPI event 10*Mar 1 01:13:33.280:callp :19196BC, state :1, call ID :16, event :9*Mar 1 01:13:33.389:SGCP Session Appl:ignore CCAPI event 10*Mar 1 01:13:33.433:callp :19196BC, state :1, call ID :16, event :9*Mar 1 01:13:33.537:SGCP Session Appl:ignore CCAPI event 10*Mar 1 01:13:33.581:callp :19196BC, state :1, call ID :16, event :9*Mar 1 01:13:33.702:SGCP Session Appl:ignore CCAPI event 10*Mar 1 01:13:33.742:callp :19196BC, state :1, call ID :16, event :9*Mar 1 01:13:33.742:voice_if->call_agent_ipaddr used as Notify entityNotify entity available for Tx SGCP msgNTFY send to ipaddr=1092E01 port=2427*Mar 1 01:13:33.742:Push msg into SGCP wait ack queue* (1)[26]*Mar 1 01:13:33.742:Timed Out interval [1]:(2000)*Mar 1 01:13:33.742:Timed Out interval [1]:(2000)(0):E[26]*Mar 1 01:13:33.786:Removing msg :NTFY 26 ds1-1/13@mc1 SGCP 1.1X:440842371O:k0, 4081037, s0*Mar 1 01:13:33.786:Unqueue msg from SGCP wait ack q** (0)[26]DS1 = 1, DS0 = 13*Mar 1 01:13:33.802:callp :19196BC, vdbptr :1964EEC, state :1*Mar 1 01:13:33.802:Checking ack (trans ID 698549528) :*Mar 1 01:13:33.802:is_capability_ok:caps.codec=5, caps.pkt=10, caps.nt=8*Mar 1 01:13:33.802:is_capability_ok:supported signal=0x426C079C, signal2=0x80003,event=0x6003421F, event2=0x3FDrequested signal=0x0, signal2=0x0,event=0x4, event2=0x0*Mar 1 01:13:33.802:R:requested trans_id (698549528)*Mar 1 01:13:33.802:set_up_voip_call_leg:peer_addr=0, peer_port=0.*Mar 1 01:13:33.806:call_setting_crcx:Enter CallProceeding state rc = 0, call_id=16*Mar 1 01:13:33.806:callp :19196BC, state :4, call ID :16, event :31*Mar 1 01:13:33.810:callp :1AF5798, state :2, call ID :17, event :8call_pre_bridge!*Mar 1 01:13:33.810:send_oc_create_ack:seizure_possiblle=1, ack-lready-sent=0, ack_send=0*Mar 1 01:13:33.814:callp :1AF5798, state :4, call ID :17, event :28*Mar 1 01:13:33.814:Call Connect:Raw Msg ptr=0x1995360, no-offhook=0; call-id=17*Mar 1 01:13:33.814:SGCP Session Appl:ignore CCAPI event 37*Mar 1 01:13:33.947:callp :19196BC, state :5, call ID :16, event :32process_nse_on_origDS1 = 1, DS0 = 13*Mar 1 01:13:34.007:callp :19196BC, vdbptr :1964EEC, state :5*Mar 1 01:13:34.007:Checking ack (trans ID 123764791) :*Mar 1 01:13:34.007:is_capability_ok:caps.codec=5, caps.pkt=10, caps.nt=8*Mar 1 01:13:34.007:is_capability_ok:supported signal=0x426C079C, signal2=0x80003,event=0x6003421F, event2=0x3FDrequested signal=0x0, signal2=0x0,event=0x4, event2=0x0*Mar 1 01:13:34.007:R:requested trans_id (123764791)*Mar 1 01:13:34.007:process_signal_ev:seizure possible=1, signal mask=0x0, mask2=0x0*Mar 1 01:13:34.007:modify_connection:echo_cancel=1.*Mar 1 01:13:34.007:modify_connection:vad=0.*Mar 1 01:13:34.007:modify_connection:peer_addr=6000001, peer_port=0->16500.*Mar 1 01:13:34.007:modify_connection:conn_mode=2.*Mar 1 01:13:34.011:callp :19196BC, state :5, call ID :16, event :31*Mar 1 01:13:34.011:callp :1AF5798, state :5, call ID :17, event :31process_nse_event*Mar 1 01:13:34.051:callp :19196BC, state :5, call ID :16, event :39*Mar 1 01:13:34.051:call_id=16, ignore_ccapi_ev:ignore 19 for state 5DS1 = 1, DS0 = 13*Mar 1 01:13:39.497:callp :19196BC, vdbptr :1964EEC, state :5*Mar 1 01:13:39.497:Checking ack (trans ID 553892443) :*Mar 1 01:13:39.497:is_capability_ok:caps.codec=5, caps.pkt=10, caps.nt=8*Mar 1 01:13:39.497:is_capability_ok:supported signal=0x426C079C, signal2=0x80003,event=0x6003421F, event2=0x3FDrequested signal=0x8, signal2=0x0,event=0x4, event2=0x0*Mar 1 01:13:39.497:R:requested trans_id (553892443)*Mar 1 01:13:39.497:process_signal_ev:seizure possible=1, signal mask=0x0, mask2=0x0*Mar 1 01:13:39.497:modify_connection:echo_cancel=1.*Mar 1 01:13:39.497:modify_connection:vad=0.*Mar 1 01:13:39.497:modify_connection:peer_addr=6000001, peer_port=16500->16500.*Mar 1 01:13:39.497:modify_connection:conn_mode=3.*Mar 1 01:13:39.497:callp :19196BC, state :5, call ID :16, event :31*Mar 1 01:13:39.501:callp :1AF5798, state :5, call ID :17, event :31*Mar 1 01:14:01.168:Removing ack (trans ID 237740140) :200 237740140 OK*Mar 1 01:14:03.883:Removing ack (trans ID 698549528) :200 698549528 OKI:7v=0c=IN IP4 5.0.0.1m=audio 16400 RTP/AVP 0*Mar 1 01:14:04.087:Removing ack (trans ID 123764791) :200 123764791 OKI:7v=0c=IN IP4 5.0.0.1m=audio 16400 RTP/AVP 0*Mar 1 01:14:09.573:Removing ack (trans ID 553892443) :200 553892443 OKI:7v=0c=IN IP4 5.0.0.1m=audio 16400 RTP/AVP 0*Mar 1 01:14:48.091:callp :19196BC, state :5, call ID :16, event :12*Mar 1 01:14:48.091:voice_if->call_agent_ipaddr used as Notify entityNotify entity available for Tx SGCP msgNTFY send to ipaddr=1092E01 port=2427*Mar 1 01:14:48.091:Push msg into SGCP wait ack queue* (1)[27]*Mar 1 01:14:48.091:Timed Out interval [1]:(2000)*Mar 1 01:14:48.091:Timed Out interval [1]:(2000)(0):E[27]*Mar 1 01:14:48.128:Removing msg :NTFY 27 ds1-1/13@mc1 SGCP 1.1X:97849341O:hu*Mar 1 01:14:48.128:Unqueue msg from SGCP wait ack q** (0)[27]DS1 = 1, DS0 = 13*Mar 1 01:14:48.212:callp :19196BC, vdbptr :1964EEC, state :5*Mar 1 01:14:48.212:Checking ack (trans ID 79307869) :*Mar 1 01:14:48.212:is_capability_ok:caps.codec=5, caps.pkt=10, caps.nt=8*Mar 1 01:14:48.212:is_capability_ok:supported signal=0x426C079C, signal2=0x80003,event=0x6003421F, event2=0x3FDrequested signal=0x4, signal2=0x0,event=0x0, event2=0x0*Mar 1 01:14:48.212:delete_call:callp:19196BC, call ID:16*Mar 1 01:14:48.212:sgcp delete_call:Setting disconnect_by_dlcx to 1*Mar 1 01:14:48.216:callp :1AF5798, state :6, call ID :17, event :29*Mar 1 01:14:48.216:Call disconnect:Raw Msg ptr = 0x0, call-id=17*Mar 1 01:14:48.216:disconnect_call_leg O.K. call_id=17*Mar 1 01:14:48.216:SGCP:Call disconnect:No need to send onhook*Mar 1 01:14:48.216:Call disconnect:Raw Msg ptr = 0x19953B0, call-id=16*Mar 1 01:14:48.216:disconnect_call_leg O.K. call_id=16*Mar 1 01:14:48.220:callp :1AF5798, state :7, call ID :17, event :13*Mar 1 01:14:48.220:Processing DLCX signal request :4, 0, 0*Mar 1 01:14:48.220:call_disconnected:call_id=17, peer 16 is not idle yet.DS1 = 1, DS0 = 13*Mar 1 01:14:48.272:callp :19196BC, vdbptr :1964EEC, state :7*Mar 1 01:14:48.272:Checking ack (trans ID 75540355) :*Mar 1 01:14:48.272:is_capability_ok:caps.codec=5, caps.pkt=10, caps.nt=8*Mar 1 01:14:48.272:is_capability_ok:supported signal=0x426C079C, signal2=0x80003,event=0x6003421F, event2=0x3FDrequested signal=0x0, signal2=0x0,event=0x8, event2=0x0*Mar 1 01:14:48.272:R:requested trans_id (75540355)*Mar 1 01:14:48.272:process_signal_ev:seizure possible=1, signal mask=0x4, mask2=0x0*Mar 1 01:14:49.043:callp :19196BC, state :7, call ID :16, event :27*Mar 1 01:14:49.043:process_call_feature:Onhook event*Mar 1 01:14:49.043:callp :19196BC, state :7, call ID :16, event :13*Mar 1 01:15:18.288:Removing ack (trans ID 79307869) :250 79307869 OK*Mar 1 01:15:18.344:Removing ack (trans ID 75540355) :200 75540355 OKRelated Commands
debug sgcp packet
To debug the Simple Gateway Control Protocol (SGCP), use the debug sgcp packet command in privileged EXEC mode. To disable debugging output, use the no form of this command.
debug sgcp packet [endpoint string]
no debug sgcp packet
Syntax Description
Defaults
No default behavior or values
Command Modes
Privileged EXEC
Command History
Examples
The following example shows a debug trace for SGCP packets on a specific endpoint:
Router# debug sgcp packet endpoint DS1-0/1End point name for packet debug:DS1-0/1 (1)00:08:14:DS1 = 0, DS0 = 100:08:14:Enable packet end point debug for (DS1-0/1)The following example shows a debug trace for all SGCP packets on a gateway:
Router# debug sgcp packet*Mar 1 01:07:45.204:SUCCESS:Request ID string building is OK*Mar 1 01:07:45.204:SUCCESS:Building SGCP Parameter lines is OK*Mar 1 01:07:45.204:SUCCESS:SGCP message building OK*Mar 1 01:07:45.204:SUCCESS:END of building*Mar 1 01:07:45.204:SGCP Packet sent --->NTFY 22 ds1-1/13@mc1 SGCP 1.1X:550092018O:hd<---*Mar 1 01:07:45.204:NTFY Packet sent successfully.*Mar 1 01:07:45.240:Packet received -200 22*Mar 1 01:07:45.244:SUCCESS:SGCP Header parsing was OK*Mar 1 01:07:45.244:SUCCESS:END of Parsing*Mar 1 01:07:45.256:Packet received -RQNT 180932866 ds1-1/13@mc1 SGCP 1.1X:362716780R:hu,k0(A),s0(N),[0-9T](A) (D)D:(9xx|xxxxxxx)*Mar 1 01:07:45.256:SUCCESS:SGCP Header parsing was OK*Mar 1 01:07:45.256:SUCCESS:Request ID string(362716780) parsing is OK*Mar 1 01:07:45.260:SUCCESS:Requested Event parsing is OK*Mar 1 01:07:45.260:SUCCESS:Digit Map parsing is OK*Mar 1 01:07:45.260:SUCCESS:END of Parsing*Mar 1 01:07:45.260:SUCCESS:SGCP message building OK*Mar 1 01:07:45.260:SUCCESS:END of building*Mar 1 01:07:45.260:SGCP Packet sent --->200 180932866 OK<---*Mar 1 01:07:47.915:SUCCESS:Request ID string building is OK*Mar 1 01:07:47.915:SUCCESS:Building SGCP Parameter lines is OK*Mar 1 01:07:47.919:SUCCESS:SGCP message building OK*Mar 1 01:07:47.919:SUCCESS:END of building*Mar 1 01:07:47.919:SGCP Packet sent --->NTFY 23 ds1-1/13@mc1 SGCP 1.1X:362716780O:k0, 4081037, s0<---*Mar 1 01:07:47.919:NTFY Packet sent successfully.*Mar 1 01:07:47.955:Packet received -200 23*Mar 1 01:07:47.955:SUCCESS:SGCP Header parsing was OK*Mar 1 01:07:47.955:SUCCESS:END of Parsing*Mar 1 01:07:47.971:Packet received -CRCX 938694984 ds1-1/13@mc1 SGCP 1.1M:recvonlyL:p:10,e:on,s:off, a:G.711uR:huC:6*Mar 1 01:07:47.971:SUCCESS:SGCP Header parsing was OK*Mar 1 01:07:47.971:SUCCESS:Connection Mode parsing is OK*Mar 1 01:07:47.971:SUCCESS:Packet period parsing is OK*Mar 1 01:07:47.971:SUCCESS:Echo Cancellation parsing is OK*Mar 1 01:07:47.971:SUCCESS:Silence Supression parsing is OK*Mar 1 01:07:47.971:SUCCESS:CODEC strings parsing is OK*Mar 1 01:07:47.971:SUCCESS:Local Connection option parsing is OK*Mar 1 01:07:47.971:SUCCESS:Requested Event parsing is OK*Mar 1 01:07:47.975:SUCCESS:Call ID string(6) parsing is OK*Mar 1 01:07:47.975:SUCCESS:END of Parsing*Mar 1 01:07:47.979:SUCCESS:Conn ID string building is OK*Mar 1 01:07:47.979:SUCCESS:Building SGCP Parameter lines is OK*Mar 1 01:07:47.979:SUCCESS:SGCP message building OK*Mar 1 01:07:47.979:SUCCESS:END of building*Mar 1 01:07:47.979:SGCP Packet sent --->200 938694984 OKI:6v=0c=IN IP4 5.0.0.1m=audio 16538 RTP/AVP 0<---*Mar 1 01:07:48.188:Packet received -MDCX 779665338 ds1-1/13@mc1 SGCP 1.1I:6M:recvonlyL:p:10,e:on,s:off,a:G.711uR:huC:6v=0c=IN IP4 6.0.0.1m=audio 16392 RTP/AVP 0*Mar 1 01:07:48.188:SUCCESS:SGCP Header parsing was OK*Mar 1 01:07:48.188:SUCCESS:Conn ID string(6) parsing is OK*Mar 1 01:07:48.192:SUCCESS:Connection Mode parsing is OK*Mar 1 01:07:48.192:SUCCESS:Packet period parsing is OK*Mar 1 01:07:48.192:SUCCESS:Echo Cancellation parsing is OK*Mar 1 01:07:48.192:SUCCESS:Silence Supression parsing is OK*Mar 1 01:07:48.192:SUCCESS:CODEC strings parsing is OK*Mar 1 01:07:48.192:SUCCESS:Local Connection option parsing is OK*Mar 1 01:07:48.192:SUCCESS:Requested Event parsing is OK*Mar 1 01:07:48.192:SUCCESS:Call ID string(6) parsing is OK*Mar 1 01:07:48.192:SUCCESS:SDP Protocol version parsing OK*Mar 1 01:07:48.192:SUCCESS:SDP Conn Data OK*Mar 1 01:07:48.192:SUCCESS:END of Parsing*Mar 1 01:07:48.200:SUCCESS:Conn ID string building is OK*Mar 1 01:07:48.200:SUCCESS:Building SGCP Parameter lines is OK*Mar 1 01:07:48.200:SUCCESS:SGCP message building OK*Mar 1 01:07:48.200:SUCCESS:END of building*Mar 1 01:07:48.200:SGCP Packet sent --->200 779665338 OKI:6v=0c=IN IP4 5.0.0.1m=audio 16538 RTP/AVP 0<---*Mar 1 01:07:53.674:Packet received -MDCX 177780432 ds1-1/13@mc1 SGCP 1.1I:6M:sendrecvX:519556004L:p:10,e:on, s:off,a:G.711uC:6R:huS:hdv=0c=IN IP4 6.0.0.1m=audio 16392 RTP/AVP 0*Mar 1 01:07:53.674:SUCCESS:SGCP Header parsing was OK*Mar 1 01:07:53.674:SUCCESS:Conn ID string(6) parsing is OK*Mar 1 01:07:53.674:SUCCESS:Connection Mode parsing is OK*Mar 1 01:07:53.674:SUCCESS:Request ID string(519556004) parsing is OK*Mar 1 01:07:53.678:SUCCESS:Packet period parsing is OK*Mar 1 01:07:53.678:SUCCESS:Echo Cancellation parsing is OK*Mar 1 01:07:53.678:SUCCESS:Silence Supression parsing is OK*Mar 1 01:07:53.678:SUCCESS:CODEC strings parsing is OK*Mar 1 01:07:53.678:SUCCESS:Local Connection option parsing is OK*Mar 1 01:07:53.678:SUCCESS:Call ID string(6) parsing is OK*Mar 1 01:07:53.678:SUCCESS:Requested Event parsing is OK*Mar 1 01:07:53.678:SUCCESS:Signal Requests parsing is OK*Mar 1 01:07:53.678:SUCCESS:SDP Protocol version parsing OK*Mar 1 01:07:53.678:SUCCESS:SDP Conn Data OK*Mar 1 01:07:53.678:SUCCESS:END of Parsing*Mar 1 01:07:53.682:SUCCESS:Conn ID string building is OK*Mar 1 01:07:53.682:SUCCESS:Building SGCP Parameter lines is OK*Mar 1 01:07:53.682:SUCCESS:SGCP message building OK*Mar 1 01:07:53.682:SUCCESS:END of building*Mar 1 01:07:53.682:SGCP Packet sent --->200 177780432 OKI:6v=0c=IN IP4 5.0.0.1m=audio 16538 RTP/AVP 0<---*Mar 1 01:09:02.401:SUCCESS:Request ID string building is OK*Mar 1 01:09:02.401:SUCCESS:Building SGCP Parameter lines is OK*Mar 1 01:09:02.401:SUCCESS:SGCP message building OK*Mar 1 01:09:02.401:SUCCESS:END of building*Mar 1 01:09:02.401:SGCP Packet sent --->NTFY 24 ds1-1/13@mc1 SGCP 1.1X:519556004O:hu<---*Mar 1 01:09:02.401:NTFY Packet sent successfully.*Mar 1 01:09:02.437:Packet received -200 24*Mar 1 01:09:02.441:SUCCESS:SGCP Header parsing was OK*Mar 1 01:09:02.441:SUCCESS:END of Parsing*Mar 1 01:09:02.541:Packet received -DLCX 865375036 ds1-1/13@mc1 SGCP 1.1C:6S:hu*Mar 1 01:09:02.541:SUCCESS:SGCP Header parsing was OK*Mar 1 01:09:02.541:SUCCESS:Call ID string(6) parsing is OK*Mar 1 01:09:02.541:SUCCESS:Signal Requests parsing is OK*Mar 1 01:09:02.541:SUCCESS:END of Parsing*Mar 1 01:09:02.545:SUCCESS:SGCP message building OK*Mar 1 01:09:02.545:SUCCESS:END of building*Mar 1 01:09:02.545:SGCP Packet sent --->250 865375036 OK<---*Mar 1 01:09:02.577:Packet received -RQNT 254959796 ds1-1/13@mc1 SGCP 1.1X:358258758R:hd*Mar 1 01:09:02.577:SUCCESS:SGCP Header parsing was OK*Mar 1 01:09:02.577:SUCCESS:Request ID string(358258758) parsing is OK*Mar 1 01:09:02.577:SUCCESS:Requested Event parsing is OK*Mar 1 01:09:02.581:SUCCESS:END of Parsing*Mar 1 01:09:02.581:SUCCESS:SGCP message building OK*Mar 1 01:09:02.581:SUCCESS:END of building*Mar 1 01:09:02.581:SGCP Packet sent --->200 254959796 OKRelated Commands
debug snasw dlc
To display frame information entering and leaving the Systems Network Architecture (SNA) switch in real time to the console, use the debug snasw dlc command in privileged EXEC mode.
debug snasw dlc detail
Syntax Description
detail
Indicates that in addition to a one-line description of the frame being displayed, an entire hexadecimal dump of the frame will follow.
Defaults
By default, a one-line description of the frame is displayed.
Command Modes
Privileged EXEC
Command History
Usage Guidelines
Caution
Examples
The following shows sample output from the debug snasw dlc command:
Router# debug snasw dlcSequenceNumber Size of ISR/Link SNA BTU HPR Description of frame343 MVSD In sz:134 ISR fmh5 DLUR Rq ActPU NETA.APPNRA29344 MVSD Out sz:12 ISR +Rsp IPM slctd nws:0008345 @I000002 Out sz:18 ISR Rq ActPU346 MVSD Out sz:273 ISR fmh5 TOPOLOGY UPDATE347 @I000002 In sz:9 ISR +Rsp Data348 @I000002 In sz:12 ISR +Rsp IPM slctd nws:0002349 @I000002 In sz:29 ISR +Rsp ActPU350 MVSD Out sz:115 ISR fmh5 DLUR +Rsp ActPU351 MVSD In sz:12 ISR +Rsp IPM slctd nws:0007352 MVSD In sz:88 ISR fmh5 DLUR Rq ActLU NETA.MARTLU1353 MVSD Out sz:108 ISR fmh5 REGISTER354 @I000002 Out sz:27 ISR Rq ActLU NETA.MARTLU1Related Commands
debug snasw ips
To display internal signal information between the Systems Network Architecture (SNA) switch and the console in real time, use the debug snasw ips command in privileged EXEC mode.
debug snasw dlc
Syntax Description
This command has no arguments or keywords.
Defaults
By default, a one-line description of the interprocess signal is displayed.
Command Modes
Privileged EXEC
Command History
Usage Guidelines
Caution
Examples
The following is an example of the debug snasw ips command output:
Router# debug snasw ipsSequenceNumber Sending ReceivingSignal Name Process Process Queue11257 : DEALLOCATE_RCB : --(0) -> RM(2130000) Q 411258 : RCB_DEALLOCATED : RM(2130000) -> PS(22E0000) Q 211259 : RCB_DEALLOCATED : --(0) -> PS(22E0000) Q 211260 : VERB_SIGNAL : PS(22E0000) -> DR(20F0000) Q 211261 : FREE_SESSION : --(0) -> RM(2130000) Q 211262 : BRACKET_FREED : RM(2130000) -> HS(22FB0001) Q 211263 : BRACKET_FREED : --(0) -> HS(22FB0001) Q 211264 : VERB_SIGNAL : --(0) -> DR(20F0000) Q 211265 : DLC_MU : DLC(2340000) -> PC(22DD0001) Q 211266 : DLC_MU : --(0) -> PC(22DD0001) Q 2Related Commands
snasw ipstrace
Captures interprocess signal information between Switching Services components.
debug snmp bulkstat
To enable debugging messages for the SNMP Bulk Statistics feature, use the debug snmp bulkstat command in privileged EXEC mode. To disable debugging messages for this feature, use the no form of this command.
debug snmp bulkstat
no debug snmp bulkstat
Syntax Description
This command has no argument or keywords.
Command Modes
Privileged EXEC
Command History
Usage Guidelines
This command is intended primarily for Cisco support personnel. Debugging output for the Periodic MIB Data Collection and Transfer Mechanism (Bulk Statistics feature) includes messages for data collection, local file generation, and transfer attempts.
Examples
In the following example, debugging command output is enabled for the Periodic MIB Data Collection and Transfer Mechanism (Bulk Statistics feature). Note that the references to a VFile indicate a local bulk statistics file, usually followed by the filename. The filename uses the format specified-filename_device-name_date_time-stamp.
Router# debug snmp bulkstat00:17:38:BULKSTAT-DC:Poll timer fired for ifmib00:17:38:BULKSTAT-DC:In pollDataGroup00:17:38:BULKSTAT-DC:creating new filevfile:IfMIB_objects_ios108_030307_10111973900:17:38:BULKSTAT-DC:Too small state buffer for ifmib10200:17:38:BULKSTAT-DC:Increased buffer state to 102400:17:38:BULKSTAT-DC:Interface type data group00:17:38:BULKSTAT-DC:polling done00:18:38:BULKSTAT-DC:Poll timer fired for ifmib00:18:38:BULKSTAT-DC:In pollDataGroup00:18:38:BULKSTAT-DC:Interface type data group00:18:38:BULKSTAT-DC:polling done00:19:26:BULKSTAT-DC:Collection timer fired for IfMIB_objects00:19:26:BULKSTAT-TP:Transfer request forvfile:IfMIB_objects_ios108_030307_10111973900:19:30:BULKSTAT-TP:written vfileIfMIB_objects_ios108_030307_10111973900:19:30:BULKSTAT-TP:retained vfilevfile:IfMIB_objects_ios108_030307_10111973900:19:38:BULKSTAT-DC:Poll timer fired for ifmib00:19:38:BULKSTAT-DC:In pollDataGroup00:19:38:BULKSTAT-DC:creating new filevfile:IfMIB_objects_ios108_030307_10131973900:19:38:BULKSTAT-DC:Interface type data group00:19:38:BULKSTAT-DC:polling done00:20:38:BULKSTAT-DC:Poll timer fired for ifmib00:20:38:BULKSTAT-DC:In pollDataGroup00:20:38:BULKSTAT-DC:Interface type data group00:20:38:BULKSTAT-DC:polling done00:21:38:BULKSTAT-DC:Poll timer fired for ifmib00:21:38:BULKSTAT-DC:In pollDataGroup00:21:38:BULKSTAT-DC:Interface type data group00:21:38:BULKSTAT-DC:polling done00:22:26:BULKSTAT-DC:Collection timer fired for IfMIB_objects00:22:26:BULKSTAT-TP:Transfer request forvfile:IfMIB_objects_ios108_030307_10131973900:22:26:BULKSTAT-TP:written vfileIfMIB_objects_ios108_030307_10131973900:22:26:BULKSTAT-TP:retained vfilevfile:IfMIB_objects_ios108_030307_10131973900:22:38:BULKSTAT-DC:Poll timer fired for ifmib00:22:38:BULKSTAT-DC:In pollDataGroup00:22:38:BULKSTAT-DC:creating new filevfile:IfMIB_objects_ios108_030307_10161973900:22:38:BULKSTAT-DC:Interface type data group00:22:38:BULKSTAT-DC:polling done00:23:38:BULKSTAT-DC:Poll timer fired for ifmib00:23:38:BULKSTAT-DC:In pollDataGroup00:23:38:BULKSTAT-DC:Interface type data group00:23:38:BULKSTAT-DC:polling done00:24:38:BULKSTAT-DC:Poll timer fired for ifmib00:24:38:BULKSTAT-DC:In pollDataGroup00:24:38:BULKSTAT-DC:Interface type data group00:24:38:BULKSTAT-DC:polling done00:25:26:BULKSTAT-DC:Collection timer fired for IfMIB_objects00:25:26:BULKSTAT-TP:Transfer request forvfile:IfMIB_objects_ios108_030307_10161973900:25:26:BULKSTAT-TP:written vfileIfMIB_objects_ios108_030307_10161973900:25:26:BULKSTAT-TP:retained vfilevfile:IfMIB_objects_ios108_030307_10161973900:25:38:BULKSTAT-DC:Poll timer fired for ifmib00:25:38:BULKSTAT-DC:In pollDataGroup00:25:38:BULKSTAT-DC:creating new filevfile:IfMIB_objects_ios108_030307_10191973900:25:38:BULKSTAT-DC:Interface type data group00:25:38:BULKSTAT-DC:polling done00:26:38:BULKSTAT-DC:Poll timer fired for ifmib00:26:38:BULKSTAT-DC:In pollDataGroup00:26:38:BULKSTAT-DC:Interface type data group00:26:38:BULKSTAT-DC:polling doneRelated Commands
debug snmp packet
To display information about every Simple Network Management Protocol (SNMP) packet sent or received by the router, use the debug snmp packet command in privileged EXEC mode. To disable debugging output, use the no form of this command.
debug snmp packet
no debug snmp packet
Syntax Description
This command has no arguments or keywords.
Command Modes
Privileged EXEC
Examples
The following is sample output from the debug snmp packet command. In this example, the router receives a get-next request from the host at 172.16.63.17 and responds with the requested information.
Router# debug snmp packetSNMP: Packet received via UDP from 172.16.63.17 on Ethernet0SNMP: Get-next request, reqid 23584, errstat 0, erridx 0sysUpTime = NULL TYPE/VALUEsystem.1 = NULL TYPE/VALUEsystem.6 = NULL TYPE/VALUESNMP: Response, reqid 23584, errstat 0, erridx 0sysUpTime.0 = 2217027system.1.0 = Cisco Internetwork Operating System Softwaresystem.6.0 =SNMP: Packet sent via UDP to 172.16.63.17Based on the kind of packet sent or received, the output may vary. For get-bulk requests, a line similar to the following is displayed:
SNMP: Get-bulk request, reqid 23584, nonrptr 10, maxreps 20For traps, a line similar to the following is displayed:
SNMP: V1 Trap, ent 1.3.6.1.4.1.9.1.13, gentrap 3, spectrap 0Table 299 describes the significant fields shown in the display.
debug snmp requests
To display information about every Simple Network Management Protocol (SNMP) request made by the SNMP manager, use the debug snmp requests command in privileged EXEC mode. To disable debugging output, use the no form of this command.
debug snmp requests
no debug snmp requests
Syntax Description
This command has no arguments or keywords.
Command Modes
Privileged EXEC
Examples
The following is sample output from the debug snmp requests command:
Router# debug snmp requestsSNMP Manager API: requestdest: 171.69.58.33.161, community: publicretries: 3, timeout: 30, mult: 2, use session rttuserdata: 0x0Table 300 describes the significant fields shown in the display.
debug sntp adjust
To display information about Simple Network Time Protocol (SNTP) clock adjustments, use the debug sntp adjust command in privileged EXEC mode. To disable debugging output, use the no form of this command.
debug sntp adjust
no debug sntp adjust
Syntax Description
This command has no arguments or keywords.
Command Modes
Privileged EXEC
Examples
The following is sample output from the debug sntp adjust command when an offset to the time reported by the configured NTP server is calculated. The offset indicates the difference between the router time and the actual time (as kept by the server) and is displayed in milliseconds. The clock time is then successfully changed to the accurate time by adding the offset to the current router time.
Router# debug sntp adjustDelay calculated, offset 3.48Clock slewed.The following is sample output from the debug sntp adjust command when an offset to the time reported by a broadcast server is calculated. Because the packet is a broadcast packet, no transmission delay can be calculated. However, in this case, the offset is too large, so the clock is reset to the correct time.
Router# debug sntp adjustNo delay calculated, offset 11.18Clock stepped.debug sntp packets
To display information about Simple Network Time Protocol (SNTP) packets sent and received, use the debug sntp packets command in privileged EXEC mode. To disable debugging output, use the no form of this command.
debug sntp packets
no debug sntp packets
Syntax Description
This command has no arguments or keywords.
Command Modes
Privileged EXEC
Examples
The following is sample output from the debug sntp packets command when a message is received:
Router# debug sntp packetsReceived SNTP packet from 172.16.186.66, length 48leap 0, mode 1, version 3, stratum 4, ppoll 1024rtdel 00002B00, rtdsp 00003F18, refid AC101801 (172.16.24.1)ref B7237786.ABF9CDE5 (23:28:06.671 UTC Tue May 13 1997)org 00000000.00000000 (00:00:00.000 UTC Mon Jan 1 1900)rec 00000000.00000000 (00:00:00.000 UTC Mon Jan 1 1900)xmt B7237B5C.A7DE94F2 (23:44:28.655 UTC Tue May 13 1997)inp AF3BD529.810B66BC (00:19:53.504 UTC Mon Mar 1 1993)The following is sample output from the debug sntp packets command when a message is sent:
Router# debug sntp packetsSending SNTP packet to 172.16.25.1xmt AF3BD455.FBBE3E64 (00:16:21.983 UTC Mon Mar 1 1993)Table 301 describes the significant fields shown in the display.
debug sntp select
To display information about Simple Network Time Protocol (SNTP) server selection, use the debug sntp select command in privileged EXEC mode. To disable debugging output, use the no form of this command.
debug sntp select
no debug sntp select
Syntax Description
This command has no arguments or keywords.
Command Modes
Privileged EXEC
Examples
The following is sample output from the debug sntp select command. In this example, the router will synchronize its time to the server at 172.16.186.66.
Router# debug sntp selectSNTP: Selected 172.16.186.66debug source bridge
To display information about packets and frames transferred across a source-route bridge, use the debug source bridge command in privileged EXEC mode. To disable debugging output, use the no form of this command.
debug source bridge
no debug source bridge
Syntax Description
This command has no arguments or keywords.
Command Modes
Privileged EXEC
Examples
The following is sample output from the debug source bridge command for peer bridges using TCP as a transport mechanism. The remote source-route bridging (RSRB) network configuration has ring 2 and ring 1 bridged together through remote peer bridges. The remote peer bridges are connected via a serial line and use TCP as the transport mechanism.
Router# debug source bridgeRSRB: remote explorer to 5/192.108.250.1/1996 srn 2 [C840.0021.0050.0000]RSRB: Version/Ring XReq sent to peer 5/192.108.250.1/1996RSRB: Received version reply from 5/192.108.250.1/1996 (version 2)RSRB: DATA: 5/192.108.250.1/1996 Ring Xchg Rep, trn 2, vrn 5, off 18, len 10RSRB: added bridge 1, ring 1 for 5/192.108.240.1/1996RSRB: DATA: 5/192.108.250.1/1996 Explorer trn 2, vrn 5, off 18, len 69RSRB: DATA: 5/192.108.250.1/1996 Forward trn 2, vrn 5, off 0, len 92RSRB: DATA: forward Forward srn 2, br 1, vrn 5 to peer 5/192.108.250.1/1996The following line indicates that a remote explorer frame has been sent to IP address 192.108.250.1 and, like all RSRB TCP connections, has been assigned port 1996. The bridge belongs to ring group 5. The explorer frame originated from ring 2. The routing information field (RIF) descriptor has been generated by the local station and indicates that the frame was sent out via bridge 1 onto virtual ring 5.
RSRB: remote explorer to 5/192.108.250.1/1996 srn 2 [C840.0021.0050.0000]The following line indicates that a request for remote peer information has been sent to IP address 192.108.250.1, TCP port 1996. The bridge belongs to ring group 5.
RSRB: Version/Ring XReq sent to peer 5/192.108.250.1/1996The following line is the response to the version request previously sent. The response is sent from IP address 192.108.250.1, TCP port 1996. The bridge belongs to ring group 5.
RSRB: Received version reply from 5/192.108.250.1/1996 (version 2)The following line is the response to the ring request previously sent. The response is sent from IP address 192.108.250.1, TCP port 1996. The target ring number is 2, virtual ring number is 5, the offset is 18, and the length of the frame is 10 bytes.
RSRB: DATA: 5/192.108.250.1/1996 Ring Xchg Rep, trn 2, vrn 5, off 0, len 10The following line indicates that bridge 1 and ring 1 were added to the source-bridge table for IP address 192.108.250.1, TCP port 1996:
RSRB: added bridge 1, ring 1 for 5/192.108.250.1/1996The following line indicates that a packet containing an explorer frame came across virtual ring 5 from IP address 192.108.250.1, TCP port 1996. The packet is 69 bytes in length. This packet is received after the Ring Exchange information was received and updated on both sides.
RSRB: DATA: 5/192.108.250.1/1996 Explorer trn 2, vrn 5, off 18, len 69The following line indicates that a packet containing data came across virtual ring 5 from IP address 192.108.250.1 over TCP port 1996. The packet is being placed on the local target ring 2. The packet is 92 bytes in length.
RSRB: DATA: 5/192.108.250.1/1996 Forward trn 2, vrn 5, off 0, len 92The following line indicates that a packet containing data is being forwarded to the peer that has IP address 192.108.250.1 address belonging to local ring 2 and bridge 1. The packet is forwarded via virtual ring 5. This packet is sent after the Ring Exchange information was received and updated on both sides.
RSRB: DATA: forward Forward srn 2, br 1, vrn 5 to peer 5/192.108.250.1/1996The following is sample output from the debug source bridge command for peer bridges using direct encapsulation as a transport mechanism. The RSRB network configuration has ring 1 and ring 2 bridged together through peer bridges. The peer bridges are connected via a serial line and use TCP as the transport mechanism.
Router# debug source bridgeRSRB: remote explorer to 5/Serial1 srn 1 [C840.0011.0050.0000]RSRB: Version/Ring XReq sent to peer 5/Serial1RSRB: Received version reply from 5/Serial1 (version 2)RSRB: IFin: 5/Serial1 Ring Xchg, Rep trn 0, vrn 5, off 0, len 10RSRB: added bridge 1, ring 1 for 5/Serial1The following line indicates that a remote explorer frame was sent to remote peer Serial1, which belongs to ring group 5. The explorer frame originated from ring 1. The RIF descriptor 0011.0050 was generated by the local station and indicates that the frame was sent out via bridge 1 onto virtual ring 5.
RSRB: remote explorer to 5/Serial1 srn 1 [C840.0011.0050.0000]The following line indicates that a request for remote peer information was sent to Serial1. The bridge belongs to ring group 5.
RSRB: Version/Ring XReq sent to peer 5/Serial1The following line is the response to the version request previously sent. The response is sent from Serial 1. The bridge belongs to ring group 5 and the version is 2.
RSRB: Received version reply from 5/Serial1 (version 2)The following line is the response to the ring request previously sent. The response is sent from Serial1. The target ring number is 2, virtual ring number is 5, the offset is 0, and the length of the frame is 39 bytes.
RSRB: IFin: 5/Serial1 Ring Xchg Rep, trn 2, vrn 5, off 0, len 39The following line indicates that bridge 1 and ring 1 were added to the source-bridge table for Serial1:
RSRB: added bridge 1, ring 1 for 5/Serial1debug source error
To display source-route bridging (SRB) errors, use the debug source error command in privileged EXEC mode. To disable debugging output, use the no form of this command.
debug source error
no debug source error
Syntax Description
This command has no arguments or keywords.
Command Modes
Privileged EXEC
Usage Guidelines
The debug source error command displays some output also found in the debug source bridge output. See the debug source bridge command for other possible output.
Examples
In all of the following examples of debug source error command messages, the variable number is the Token Ring interface. For example, if the line of output starts with SRB1, the output relates to the Token Ring 1 interface. SRB indicates a source-route bridging message. RSRB indicates a remote source-route bridging message. SRTLB indicates a source-route translational bridging (SR/TLB) message.
In the following example, a packet of protocol protocol-type was dropped:
SRBnumber drop: Routed protocol protocol-typeIn the following example, an Address Resolution Protocol (ARP) packet was dropped. ARP is defined in RFC 826.
SRBnumber drop:TYPE_RFC826_ARPIn the following example, the current Cisco IOS version does not support Qualified Logical Link Control (QLLC). Reconfigure the router with an image that has the IBM feature set.
RSRB: QLLC not supported in version versionPlease reconfigure.In the following example, the packet was dropped because the outgoing interface of the router was down:
RSRB IF: outgoing interface not up, dropping packetIn the following example, the router received an out-of-sequence IP sequence number in a Fast Sequenced Transport (FST) packet. FST has no recovery for this problem like TCP encapsulation does.
RSRB FST: bad sequence number dropping.In the following example, the router was unable to locate the virtual interface:
RSRB: couldn't find virtual interfaceIn the following example, the TCP queue of the peer router is full. TCPD indicates that this is a TCP debug.
RSRB TCPD: tcp queue full for peerIn the following example, the router was unable to send data to the peer router. A result of 1 indicates that the TCP queue is full. A result of —1 indicates that the RSRB peer is closed.
RSRB TCPD: tcp send failed for peer resultIn the following example, the routing information identifier (RII) was not set in the explorer packet going forward. The packet will not support SRB, so it is dropped.
vrforward_explorer - RII not setIn the following example, a packet sent to a virtual bridge in the router did not include a routing information field (RIF) to tell the router which route to use:
RSRB: no RIF on packet sent to virtual bridgeThe following example indicates that the RIF did not contain any information or the length field was set to zero:
RSRB: RIF length of zero sent to virtual bridgeThe following message occurs when the local service access point (LSAP) is out of range. The variable lsap-out is the value, type is the type of RSRB peer, and state is the state of the RSRB peer.
VRP: rsrb_lsap_out = lsap-out, type = type, state = stateIn the following message, the router is unable to find another router with which to exchange bridge protocol data units (BPDUs). BPDUs are exchanged to set up the spanning tree and determine the forwarding path.
RSRB(span): BPDU's peer not foundRelated Commands
debug source bridge
Displays information about packets and frames transferred across a source-route bridge.
debug source event
Displays information on SRB activity.
![]()
![]()
![]()
![]()
![]()
![]()
![]()
![]()
Posted: Tue Jul 3 10:57:15 PDT 2007
All contents are Copyright © 1992--2007 Cisco Systems, Inc. All rights reserved.
Important Notices and Privacy Statement.