|
|

Table Of Contents
debug ppp multilink negotiation
debug packet
To display per-packet debugging output, use the debug packet command in privileged EXEC mode. To disable debugging output, use the no form of this command.
debug packet [interface number [vcd vcd-number] | vc vpi/vci | vc-name]
no debug packet [interface number [vcd vcd-number] | vc vpi/vci | vc-name]
Syntax Description
Defaults
Debugging for packets is disabled by default.
Command Modes
Privileged EXEC
Command History
9.21
This command was introduced.
12.2(13)T
Support for Apollo Domain and Banyan VINES was removed.
Usage Guidelines
The debug packet command displays all process-level packets for both outbound and inbound packets. This command is useful for determining whether packets are being received and sent correctly. The output reports information online when a packet is received or a transmission is attempted.
For sent packets, the information is displayed only after the protocol data unit (PDU) is entirely encapsulated and a next hop VC is found. If information is not displayed, the address translation probably failed during encapsulation. When a next hop VC is found, the packet is displayed exactly as it will be presented on the wire. Having a display indicates that the packets are properly encapsulated for transmission.
For received packets, information is displayed for all incoming frames. The display can show whether the sending station properly encapsulates the frames. Because all incoming frames are displayed, this information is useful when performing back-to-back testing and corrupted frames cannot be dropped by an intermediary switch.
The debug packet command also displays the initial bytes of the actual PDU in hexadecimal. This information can be decoded only by qualified support or engineering personnel.
CautionBecause the debug packet command generates a substantial amount of output for every packet processed, use it only when traffic on the network is low so other activity on the system is not adversely affected.
Examples
The following is sample output from the debug packet command:
Router# debug packet2/0.5(I): VCD:0x9 VCI:0x23 Type:0x0 SAP:AAAA CTL:03 OUI:000000 TYPE:0800 Length0x704500 002E 0000 0000 0209 92ED 836C A26E FFFF FFFF 1108 006D 0001 0000 0000A5CC 6CA2 0000 000A 0000 6411 76FF 0100 6C08 00FF FFFF 0003 E805 DCFF 0105Table 259 describes the significant fields shown in the display.
The following two lines of output are the binary data, which are the contents of the protocol data unit (PDU) before encapsulation:
4500 002E 0000 0000 0209 92ED 836C A26E FFFF FFFF 1108 006D 0001 0000 0000A5CC 6CA2 0000 000A 0000 6411 76FF 0100 6C08 00FF FFFF 0003 E805 DCFF 0105The following is sample output from the debug packet command:
Router# debug packetEthernet0: Unknown ARPA, src 0000.0c00.6fa4, dst ffff.ffff.ffff, type 0x0a0data 00000c00f23a00000c00ab45, len 60Serial3: Unknown HDLC, size 64, type 0xaaaa, flags 0x0F00Serial2: Unknown PPP, size 128Serial7: Unknown FRAME-RELAY, size 174, type 0x5865, DLCI 7aSerial0: compressed TCP/IP packet droppedTable 260 describes the significant fields shown in the display.
debug pad
To display debugging messages for all packet assembler/disassembler (PAD) connections, use the debug pad command in privileged EXEC mode. To disable debugging output, use the no form of this command.
debug pad
no debug pad
Syntax Description
This command has no arguments or keywords.
Defaults
No default behavior or values
Command Modes
Privileged EXEC
Command History
Examples
Use the debug pad command to gather information to forward to the Cisco Technical Assistance Center (TAC) to assist in troubleshooting a problem that involves PAD connections.
The following example shows output of the debug pad and debug x25 event commands for an incoming PAD call destined for a terminal line. The incoming PAD call is rejected by the terminal line because the selected network closed user group (CUG) has not been subscribed to by the caller:
Router# debug padRouter# debug x25 eventSerial1/1:X.25 I R1 Call (16) 8 lci 8From (7):2001534 To (9):200261150Facilities:(2)Closed User Group (basic):99Call User Data (4):0x01000000 (pad)pad_svc_announce:destination matched 1PAD:incoming call to 200261150 on line 130 CUD length 4!PAD130:Incoming Call packet, Closed User Group (CUG) service protection, selected network CUG not subscribedPAD:CUG service protection Cause:11 Diag:65Serial1/1:X.25 O R1 Clear (5) 8 lci 8Cause 0, Diag 65 (DTE originated/Facility code not allowed)Serial1/1:X.25 I R1 Clear Confirm (3) 8 lci 8The following example shows the output of the debug pad command for an outgoing PAD call initiated from a terminal line with a subscribed CUG that bars outgoing access:
!PAD130:Outgoing Call packet, Closed User Group - CUG service validation, selected CUG
!bars outgoing access
PAD130:Closing connection to . In 0/0, out 0/0debug piafs events
To check the debugging messages for Personal Handyphone Internet Access Forum Standard (PIAFS) calls, use the debug piafs events command in privileged EXEC mode. To disable debugging output, use the no form of this command.
debug piafs events
no debug piafs events
Syntax Description
This command has no arguments or keywords.
Defaults
No default behavior or values
Command Modes
Privileged EXEC
Command History
12.2(8)T
This command was introduced on Cisco 803, Cisco 804, and Cisco 813 routers.
Usage Guidelines
The debug piafs events command provides debugging information for the PIAFS calls on the router, including the inband negotiation process.
Examples
The debug piafs events command was configured to provide the following information for PIAFS calls:
Router# debug piafs events02:16:39:PIAFS events debugging is on02:16:167516180371:PIAFS: RX <- CDAPI :cdapi_route_call Request02:16:167517398148:PIAFS: RX <- CDAPI :CDAPI_MSG_CONNECT_IND02:16:171798691839:PIAFS: TX -> CDAPI :CDAPI_MSG_SUBTYPE_ALERT_REQ02:16:167503724545:PIAFS: TX -> CDAPI :CDAPI_MSG_CONNECT_RESP02:16:167503765504:PIAFS: TX -> CDAPI :CDAPI_MSG_CONN_ACTIVE_REQ02:16:167503724544:PIAFS: RX <- CDAPI :CDAPI_MSG_CONN_ACTIVE_IND02:16:171798691839:PIAFS:Network allotted Channel :B102:16:167503765504:PIAFS:Enabling QMC in PIAFS mode for B102:16:171798691839:PIAFS:piafs_driver_enable_settings()02:16:167503765504:PIAFS:The speed is :6402:16:167503724544:PIAFS:Starting 64 kbps PIAFS Incoming02:16:39:PIAFS:RX <- NEGO_SYNC_REQUEST[GSN:13 RSN:1 CRSN:1 SISN:255]02:16:39:PIAFS:Updating conf resp num02:16:39:PIAFS:TX -> NEGO_SYNC_RECEPTION[GSN:1 RSN:1 CRSN:13 SISN:255]02:16:39:PIAFS:RX <- NEGO_SYNC_REQUEST[GSN:14 RSN:1 CRSN:1 SISN:255]02:16:39:PIAFS:TX -> NEGO_SYNC_RECEPTION[GSN:2 RSN:2 CRSN:13 SISN:255]02:16:39:PIAFS:RX <- NEGO_SYNC_REQUEST[GSN:15 RSN:1 CRSN:1 SISN:255]02:16:39:PIAFS:TX -> NEGO_SYNC_RECEPTION[GSN:3 RSN:3 CRSN:13 SISN:255]02:16:39:PIAFS:RX <- NEGO_SYNC_REQUEST[GSN:16 RSN:1 CRSN:1 SISN:255]02:16:39:PIAFS:TX -> NEGO_SYNC_RECEPTION[GSN:4 RSN:4 CRSN:13 SISN:255]02:16:39:PIAFS:RX <- NEGO_SYNC_REQUEST[GSN:17 RSN:1 CRSN:1 SISN:255]02:16:39:PIAFS:TX -> NEGO_SYNC_RECEPTION[GSN:5 RSN:5 CRSN:13 SISN:255]02:16:39:PIAFS:RX <- NEGO_SYNC_REQUEST[GSN:18 RSN:1 CRSN:1 SISN:255]02:16:39:PIAFS:TX -> NEGO_SYNC_RECEPTION[GSN:6 RSN:6 CRSN:13 SISN:255]02:16:39:PIAFS:RX <- NEGO_SYNC_REQUEST[GSN:19 RSN:1 CRSN:1 SISN:255]02:16:39:PIAFS:TX -> NEGO_SYNC_RECEPTION[GSN:7 RSN:7 CRSN:13 SISN:255]02:16:39:PIAFS:RX <- CONTROL_REQUEST(comm parameter)[Seq No:0]02:16:39:PIAFS:Rx Parameters:02:16:39:PIAFS: Data Protocol:Version 102:16:39:PIAFS: Control Protocol:Version 102:16:39:PIAFS: RTF value:902:16:39:PIAFS: Compression:V.42bis02:16:39:PIAFS: Frame Length:8002:16:39:PIAFS: Frame Number:6302:16:39:PIAFS:TX -> CONTROL_RECEPTION[0]02:16:39:PIAFS:ACKed all the Rx control parameters02:16:39:PIAFS:Piafs layer up & Main FSM set to DATA02:16:39:PIAFS:Compression v42bis enabled02:16:39:PIAFS:V42BIS:v42bis_init()02:16:39:PIAFS:V42BIS:v42bis_init()02:16:39:PIAFS:V42BIS:Negotiated Values for P1, P2 are - 4096 , 25002:16:39:PIAFS:Incoming call invoking ISDN_CALL_CONNECT02:16:39:%LINK-3-UPDOWN:Interface BRI0:1, changed state to up02:16:39:PIAFS:RX <- CONTROL_REQUEST(comm parameter)[Seq No:0]02:16:39:PIAFS:Rx Parameters:02:16:39:PIAFS: Data Protocol:Version 102:16:39:PIAFS: Control Protocol:Version 102:16:39:PIAFS: RTF value:902:16:39:PIAFS: Compression:V.42bis02:16:39:PIAFS: Frame Length:8002:16:39:PIAFS: Frame Number:6302:16:39:PIAFS:TX -> CONTROL_RECEPTION[0]02:16:39:PIAFS:ACKed all the Rx control parameters02:16:39:PIAFS:RX <- CONTROL_REQUEST(comm parameter)[Seq No:0]02:16:39:PIAFS:Rx Parameters:02:16:39:PIAFS: Data Protocol:Version 102:16:39:PIAFS: Control Protocol:Version 102:16:39:PIAFS: RTF value:902:16:39:PIAFS: Compression:V.42bis02:16:39:PIAFS: Frame Length:8002:16:39:PIAFS: Frame Number:6302:16:39:PIAFS:TX -> CONTROL_RECEPTION[0]02:16:39:PIAFS:ACKed all the Rx control parameters02:16:39:PIAFS:RX <- CONTROL_REQUEST(comm parameter)[Seq No:0]02:16:39:PIAFS:Rx Parameters:02:16:39:PIAFS: Data Protocol:Version 102:16:39:PIAFS: Control Protocol:Version 102:16:39:PIAFS: RTF value:902:16:39:PIAFS: Compression:V.42bis02:16:39:PIAFS: Frame Length:8002:16:39:PIAFS: Frame Number:6302:16:39:PIAFS:TX -> CONTROL_RECEPTION[0]02:16:39:PIAFS:ACKed all the Rx control parameters02:16:39:PIAFS:RX <- CONTROL_REQUEST(comm parameter)[Seq No:0]02:16:39:PIAFS:Rx Parameters:02:16:39:PIAFS: Data Protocol:Version 102:16:39:PIAFS: Control Protocol:Version 102:16:39:PIAFS: RTF value:902:16:39:PIAFS: Compression:V.42bis02:16:39:PIAFS: Frame Length:8002:16:39:PIAFS: Frame Number:6302:16:39:PIAFS:TX -> CONTROL_RECEPTION[0]02:16:39:PIAFS:ACKed all the Rx control parameters02:16:39:PIAFS:RX <- CONTROL_REQUEST(comm parameter)[Seq No:0]02:16:39:PIAFS:Rx Parameters:02:16:39:PIAFS: Data Protocol:Version 102:16:39:PIAFS: Control Protocol:Version 102:16:39:PIAFS: RTF value:902:16:39:PIAFS: Compression:V.42bis02:16:39:PIAFS: Frame Length:8002:16:39:PIAFS: Frame Number:6302:16:39:PIAFS:TX -> CONTROL_RECEPTION[0]02:16:39:PIAFS:ACKed all the Rx control parameters02:16:39:PIAFS:RX <- CONTROL_REQUEST(comm parameter)[Seq No:0]02:16:39:PIAFS:Rx Parameters:02:16:39:PIAFS: Data Protocol:Version 102:16:39:PIAFS: Control Protocol:Version 102:16:39:PIAFS: RTF value:902:16:39:PIAFS: Compression:V.42bis02:16:39:PIAFS: Frame Length:8002:16:39:PIAFS: Frame Number:6302:16:39:PIAFS:TX -> CONTROL_RECEPTION[0]02:16:39:PIAFS:ACKed all the Rx control parameters02:16:39:PIAFS:RX <- CONTROL_REQUEST(comm parameter)[Seq No:0]02:16:39:PIAFS:Rx Parameters:02:16:39:PIAFS: Data Protocol:Version 102:16:39:PIAFS: Control Protocol:Version 102:16:39:PIAFS: RTF value:902:16:39:PIAFS: Compression:V.42bis02:16:39:PIAFS: Frame Length:8002:16:39:PIAFS: Frame Number:6302:16:39:PIAFS:TX -> CONTROL_RECEPTION[0]02:16:39:PIAFS:ACKed all the Rx control parameters02:16:39:PIAFS:piafs_setmap() tx_map FFFFFFFF02:16:39:PIAFS:piafs_setmap() rx_map 002:16:41:PIAFS:PPP:Autoselect sample 7E02:16:41:PIAFS:PPP:Autoselect sample 7EFF02:16:41:PIAFS:PPP:Autoselect sample 7EFF7D02:16:41:PIAFS:PPP:Autoselect sample 7EFF7D2302:16:41:PIAFS:piafs_setmap() tx_map FFFFFFFF02:16:41:PIAFS:piafs_setmap() rx_map 002:16:42:PIAFS:piafs_setmap() tx_map A000002:16:42:PIAFS:piafs_setmap() rx_map 0Table 261 describes the significant fields shown in the display.
debug pots
To display information on the telephone interfaces, use the debug pots command in privileged EXEC mode. To disable debugging output, use the no form of this command.
debug pots {driver | csm} [1 | 2]
no debug pots {driver | csm} [1 | 2]
Syntax Description
Command Modes
Privileged EXEC
Usage Guidelines
The debug pots command displays driver and CSM debug information for telephone ports 1 and 2.
Examples
The following is sample output from the debug pots driver 1 command. This sample display indicates that the telephone port driver is not receiving caller ID information from the ISDN line. Therefore, the analog caller ID device attached to the telephone port does not display caller ID information.
Router# debug pots driver 100:01:51:POTS DRIVER port=1 activate ringer: cadence=0 callerId=Unknown00:01:51:POTS DRIVER port=1 state=Idle drv_event=RING_EVENT00:01:51:POTS DRIVER port=1 enter_ringing00:01:51:POTS DRIVER port=1 cmd=1900:01:51:POTS DRIVER port=1 activate disconnect00:01:51:POTS DRIVER port=1 state=Ringing drv_event=DISCONNECT_EVENT00:01:51:POTS DRIVER port=1 cmd=1A00:01:51:POTS DRIVER port=1 enter_idle00:01:51:POTS DRIVER port=1 ts connect: 0 000:01:51:POTS DRIVER port=1 cmd=D00:01:51:POTS DRIVER port=1 report onhook00:01:51:POTS DRIVER port=1 activate tone=SILENCE_TONE00:01:51:POTS DRIVER port=1 state=Idle drv_event=TONE_EVENT00:01:51:POTS DRIVER port=1 activate tone=SILENCE_TONE00:01:51:POTS DRIVER port=1 state=Idle drv_event=TONE_EVENT00:01:53:POTS DRIVER port=1 activate ringer: cadence=0 callerId=Unknown00:01:53:POTS DRIVER port=1 state=Idle drv_event=RING_EVENT00:01:53:POTS DRIVER port=1 enter_ringing00:01:53:POTS DRIVER port=1 cmd=1900:01:55:POTS DRIVER port=1 cmd=1A00:02:49:POTS DRIVER port=1 state=Ringing drv_event=OFFHOOK_EVENT00:02:49:POTS DRIVER port=1 cmd=1A00:02:49:POTS DRIVER port=1 enter_suspend00:02:49:POTS DRIVER port=1 cmd=A00:02:49:POTS DRIVER port=1 report offhook00:02:49:POTS DRIVER port=1 activate connect: endpt=1 calltype=TWO_PARTY_CALL00:02:49:POTS DRIVER port=1 state=Suspend drv_event=CONNECT_EVENT00:02:49:POTS DRIVER port=1 enter_connect: endpt=1 calltype=000:02:49:POTS DRIVER port=1 cmd=A00:02:49:POTS DRIVER port=1 ts connect: 1 000:02:49:POTS DRIVER port=1 activate connect: endpt=1 calltype=TWO_PARTY_CALL00:02:49:POTS DRIVER port=1 state=Connect drv_event=CONNECT_EVENT00:02:49:POTS DRIVER port=1 enter_connect: endpt=1 calltype=000:02:49:POTS DRIVER port=1 cmd=A00:02:49:POTS DRIVER port=1 ts connect: 1 000:02:55:POTS DRIVER port=1 state=Connect drv_event=ONHOOK_EVENT00:02:55:POTS DRIVER port=1 enter_idle00:02:55:POTS DRIVER port=1 ts connect: 0 000:02:55:POTS DRIVER port=1 cmd=D00:02:55:POTS DRIVER port=1 report onhook00:02:55:POTS DRIVER port=1 activate tone=SILENCE_TONE00:02:55:POTS DRIVER port=1 state=Idle drv_event=TONE_EVENT00:02:55:POTS DRIVER port=1 activate tone=SILENCE_TONE00:02:55:POTS DRIVER port=1 state=Idle drv_event=TONE_EVENTThe following is sample output from the debug pots csm 1 command. This sample display indicates that a dial peer contains an invalid destination pattern (555-1111).
Router# debug pots csm 101:57:28:EVENT_FROM_ISDN:dchanidb=0x66CB38, call_id=0x11, ces=0x2 bchan=0x0, event=0x1, cause=0x001:57:28:Dial peer not found, route call to port 101:57:28:CSM_PROC_IDLE:CSM_EVENT_ISDN_CALL, call_id=0x11, port=101:57:28:Calling number `5551111'01:57:40:CSM_PROC_RINGING:CSM_EVENT_VDEV_OFFHOOK, call_id=0x11, port=101:57:40:EVENT_FROM_ISDN:dchan_idb=0x66CB38, call_id=0x11, ces=0x2 bchan=0x0, event=0x4, cause=0x001:57:40:CSM_PROC_CONNECTING:CSM_EVENT_ISDN_CONNECTED, call_id=0x11, port=101:57:47:CSM_PROC_CONNECTING:CSM_EVENT_VDEV_ONHOOK, call_id=0x11, port=101:57:201863503872: %ISDN-6-DISCONNECT:Interface BRI0:1 disconnected from unknown, call lasted 5485 seconds01:57:47: %ISDN-6-DISCONNECT:Interface BRI0:1 disconnected from unknown, call lasted 5485 seconds01:57:47:EVENT_FROM_ISDN:dchan _idb=0x66CB38, call_id=0x11, ces=0x2 bchan=0xFFFFFFFF, event=0x0, cause=0x101:57:47:CSM_PROC_NEAR_END_DISCONNECT:CSM_debug pots csm
To activate events from which an application can determine and display the status and progress of calls to and from plain old telephone service (POTS) ports, use the debug pots csm command in privileged EXEC mode.
debug pots csm
Syntax Description
This command has no arguments or keywords.
Command Modes
Privileged EXEC
Command History
Examples
To see debugging messages, enter the logging console global configuration mode command as follows:
Router(config)# logging consoleRouter(config)# exitDebugging messages are displayed in one of two formats that are relevant to the POTS dial feature:
hh:mm:ss: CSM_STATE: CSM_EVENT, call id = ??, port = ?or
hh:mm:ss: EVENT_FROM_ISDN:dchan_idb=0x???????, call_id=0x????, ces=? bchan=0x????????,
event=0x?, cause=0x??
Table 262 describes the significant fields shown in the display.
Table 262 debug pots csm Field Descriptions
hh:mm:ss
Timestamp (in hours, minutes, and seconds).
CSM_STATE
One of the call CSM states listed in Table 263.
CSM_EVENT
One of the CSM events listed in Table 264.
call id
Hexadecimal value from 0x00 to 0xFF.
port
Telephone port 1 or 2.
EVENT_FROM_ISDN
A CSM event. Table 264 shows a list of CSM events.
dchan_idb
Internal data structure address.
ces
Connection end point suffix used by ISDN.
bchan
Channel used by the call. A value of 0xFFFFFFFF indicates that a channel is not assigned.
event
A hexadecimal value that is translated into a CSM event. Table 265 shows a list of events and the corresponding CSM events.
cause
A hexadecimal value that is given to call-progressing events. Table 266 shows a list of cause values and definitions.
Table 263 shows the values for CSM states.
Table 264 shows the values for CSM events.
Table 265 shows the values for events that are translated into CSM events.
Table 266 shows cause values that are assigned only to call-progressing events.
Examples
This section provides debug output examples for three call scenarios, displaying the sequence of events that occur during a POTS dial call or POTS disconnect call.
Call Scenario 1
In this example call scenario, port 1 is on the hook, the application dial is set to call 4085552221, and the far-end successfully connects.
Router# debug pots csmRouter# test pots 1 dial 4085552221#Router#The following output shows an event indicating that port 1 is being used by the dial application:
01:58:27: CSM_PROC_IDLE: CSM_EVENT_VDEV_APPLICATION_CALL, call id = 0x0, port = 1The following output shows events indicating that the CSM is receiving the application digits of the number to dial:
01:58:27: CSM_PROC_APPLIC_DIALING: CSM_EVENT_VDEV_DIGIT, call id = 0x0, port = 101:58:27: CSM_PROC_APPLIC_DIALING: CSM_EVENT_VDEV_DIGIT, call id = 0x0, port = 101:58:27: CSM_PROC_APPLIC_DIALING: CSM_EVENT_VDEV_DIGIT, call id = 0x0, port = 101:58:27: CSM_PROC_APPLIC_DIALING: CSM_EVENT_VDEV_DIGIT, call id = 0x0, port = 101:58:27: CSM_PROC_APPLIC_DIALING: CSM_EVENT_VDEV_DIGIT, call id = 0x0, port = 101:58:27: CSM_PROC_APPLIC_DIALING: CSM_EVENT_VDEV_DIGIT, call id = 0x0, port = 101:58:27: CSM_PROC_APPLIC_DIALING: CSM_EVENT_VDEV_DIGIT, call id = 0x0, port = 101:58:27: CSM_PROC_APPLIC_DIALING: CSM_EVENT_VDEV_DIGIT, call id = 0x0, port = 101:58:27: CSM_PROC_APPLIC_DIALING: CSM_EVENT_VDEV_DIGIT, call id = 0x0, port = 101:58:27: CSM_PROC_APPLIC_DIALING: CSM_EVENT_VDEV_DIGIT, call id = 0x0, port = 1The following output shows that the telephone connected to port 1 is off the hook:
01:58:39: CSM_PROC_APPLIC_DIALING: CSM_EVENT_VDEV_OFFHOOK, call id = 0x0, port = 1The following output shows a call-proceeding event pair indicating that the router ISDN software has sent the dialed digits to the ISDN switch:
01:58:40: EVENT_FROM_ISDN:dchan_idb=0x280AF38, call_id=0x8004, ces=0x1 bchan=0x0,
event=0x3, cause=0x0
01:58:40: CSM_PROC_ENBLOC_DIALING: CSM_EVENT_ISDN_PROC, call id =0x8004, port = 1The following output shows the call-progressing event pair indicating that the telephone at the far end is ringing:
01:58:40: EVENT_FROM_ISDN:dchan_idb=0x280AF38, call_id=0x8004, ces=0x1 bchan=0xFFFFFFFF,
event=0x5, cause=0x0
01:58:40: CSM_PROC_ENBLOC_DIALING: CSM_EVENT_ISDN_CALL_PROGRESSING, call id = 0x8004, port = 1The following output shows a call-connecting event pair indicating that the telephone at the far end has answered:
01:58:48: EVENT_FROM_ISDN:dchan_idb=0x280AF38, call_id=0x8004, ces=0x1 bchan=0xFFFFFFFF,
event=0x4, cause=0x0
01:58:48: CSM_PROC_CONNECTING: CSM_EVENT_ISDN_CONNECTED, call id = 0x8004, port = 1The following output shows a call-progressing event pair indicating that the telephone at the far end has hung up and that the calling telephone is receiving an in-band tone from the ISDN switch:
01:58:55: EVENT_FROM_ISDN:dchan_idb=0x280AF38, call_id=0x8004, ces=0x1 bchan=0xFFFFFFFF,
event=0x5, cause=0x10
01:58:55: CSM_PROC_CONNECTED: CSM_EVENT_ISDN_CALL_PROGRESSING, call id = 0x8004, port = 1The following output shows that the telephone connected to port 1 has hung up:
01:58:57: CSM_PROC_CONNECTED: CSM_EVENT_VDEV_ONHOOK, call id = 0x8004, port = 1The following output shows an event pair indicating that the call has been terminated:
01:58:57: EVENT_FROM_ISDN:dchan_idb=0x280AF38, call_id=0x8004, ces=0x1 bchan=0xFFFFFFFF,
event=0x0, cause=0x0
01:58:57: CSM_PROC_NEAR_END_DISCONNECT: CSM_EVENT_ISDN_DISCONNECTED, call id = 0x8004, port = 1813_local#Call Scenario 2
In this example scenario, port 1 is on the hook, the application dial is set to call 4085552221, and the destination number is busy.
Router# debug pots csmRouter# test pots 1 dial 4085552221#Router#The following output shows that port 1 is used by the dial application:
01:59:42: CSM_PROC_IDLE: CSM_EVENT_VDEV_APPLICATION_CALL, call id = 0x0, port = 1The following output shows the events indicating that the CSM is receiving the application digits of the number to call:
01:59:42: CSM_PROC_APPLIC_DIALING: CSM_EVENT_VDEV_DIGIT, call id = 0x0, port = 101:59:42: CSM_PROC_APPLIC_DIALING: CSM_EVENT_VDEV_DIGIT, call id = 0x0, port = 101:59:42: CSM_PROC_APPLIC_DIALING: CSM_EVENT_VDEV_DIGIT, call id = 0x0, port = 101:59:42: CSM_PROC_APPLIC_DIALING: CSM_EVENT_VDEV_DIGIT, call id = 0x0, port = 101:59:42: CSM_PROC_APPLIC_DIALING: CSM_EVENT_VDEV_DIGIT, call id = 0x0, port = 101:59:42: CSM_PROC_APPLIC_DIALING: CSM_EVENT_VDEV_DIGIT, call id = 0x0, port = 101:59:42: CSM_PROC_APPLIC_DIALING: CSM_EVENT_VDEV_DIGIT, call id = 0x0, port = 101:59:42: CSM_PROC_APPLIC_DIALING: CSM_EVENT_VDEV_DIGIT, call id = 0x0, port = 101:59:42: CSM_PROC_APPLIC_DIALING: CSM_EVENT_VDEV_DIGIT, call id = 0x0, port = 101:59:42: CSM_PROC_APPLIC_DIALING: CSM_EVENT_VDEV_DIGIT, call id = 0x0, port = 1The following output shows an event indicating that the telephone connected to port 1 is off the hook:
01:59:52: CSM_PROC_APPLIC_DIALING: CSM_EVENT_VDEV_OFFHOOK, call id = 0x0, port = 1The following output shows a call-proceeding event pair indicating that the telephone at the far end is busy:
01:59:52: EVENT_FROM_ISDN:dchan_idb=0x280AF38, call_id=0x8005, ces=0x1 bchan=0x0,
event=0x3, cause=0x11
01:59:52: CSM_PROC_ENBLOC_DIALING: CSM_EVENT_ISDN_PROC, call id = 0x8005, port = 1The following output shows a call-progressing event pair indicating that the calling telephone is receiving an in-band busy tone from the ISDN switch:
01:59:58: EVENT_FROM_ISDN:dchan_idb=0x280AF38, call_id=0x8005, ces=0x1 bchan=0xFFFFFFFF,
event=0x5, cause=0x0
01:59:58: CSM_PROC_ENBLOC_DIALING: CSM_EVENT_ISDN_CALL_PROGRESSING, call id = 0x8005, port = 1The following output shows an event indicating that the calling telephone has hung up:
02:00:05: CSM_PROC_ENBLOC_DIALING: CSM_EVENT_VDEV_ONHOOK, call id = 0x8005, port = 1The following output shows an event pair indicating that the call has been terminated:
02:00:05: EVENT_FROM_ISDN:dchan_idb=0x280AF38, call_id=0x8005, ces=0x1 bchan=0xFFFFFFFF,
event=0x0, cause=0x0
02:00:05: CSM_PROC_NEAR_END_DISCONNECT: CSM_EVENT_ISDN_DISCONNECTED, call id = 0x8005, port = 1Call Scenario 3
In this example call scenario, port 1 is on the hook, the application dial is set to call 4086661112, the far end successfully connects, and the command test pots disconnect terminates the call:
Router# debug pots csmRouter# test pots 1 dial 4086661112Router#The following output follows the same sequence of events as shown in Call Scenario 1:
1d03h: CSM_PROC_IDLE: CSM_EVENT_VDEV_APPLICATION_CALL, call id = 0x0, port = 11d03h: CSM_PROC_APPLIC_DIALING: CSM_EVENT_VDEV_DIGIT, call id = 0x0, port = 11d03h: CSM_PROC_APPLIC_DIALING: CSM_EVENT_VDEV_DIGIT, call id = 0x0, port = 11d03h: CSM_PROC_APPLIC_DIALING: CSM_EVENT_VDEV_DIGIT, call id = 0x0, port = 11d03h: CSM_PROC_APPLIC_DIALING: CSM_EVENT_VDEV_DIGIT, call id = 0x0, port = 11d03h: CSM_PROC_APPLIC_DIALING: CSM_EVENT_VDEV_DIGIT, call id = 0x0, port = 11d03h: CSM_PROC_APPLIC_DIALING: CSM_EVENT_VDEV_DIGIT, call id = 0x0, port = 11d03h: CSM_PROC_APPLIC_DIALING: CSM_EVENT_VDEV_DIGIT, call id = 0x0, port = 11d03h: CSM_PROC_APPLIC_DIALING: CSM_EVENT_VDEV_DIGIT, call id = 0x0, port = 11d03h: CSM_PROC_APPLIC_DIALING: CSM_EVENT_VDEV_DIGIT, call id = 0x0, port = 11d03h: CSM_PROC_APPLIC_DIALING: CSM_EVENT_VDEV_DIGIT, call id = 0x0, port = 11d03h: CSM_PROC_APPLIC_DIALING: CSM_EVENT_VDEV_OFFHOOK, call id = 0x0, port = 11d03h: EVENT_FROM_ISDN:dchan_idb=0x2821F38, call_id=0x8039, ces=0x1bchan=0x0, event=0x3, cause=0x01d03h: CSM_PROC_ENBLOC_DIALING: CSM_EVENT_ISDN_PROC, call id = 0x8039, port = 11d03h: EVENT_FROM_ISDN:dchan_idb=0x2821F38, call_id=0x8039, ces=0x1bchan=0xFFFFFFFF, event=0x5, cause=0x01d03h: CSM_PROC_ENBLOC_DIALING: CSM_EVENT_ISDN_CALL_PROGRESSING, call id = 0x8039, port = 1Router# test pots 1 disconnectThe test pots disconnect command disconnects the call before you physically need to put the telephone back on the hook:
1d03h: CSM_PROC_CONNECTING: CSM_EVENT_VDEV_APPLICATION_HANGUP_CALL, call id = 0x8039,
     port = 1
1d03h: EVENT_FROM_ISDN:dchan_idb=0x2821F38, call_id=0x8039, ces=0x1bchan=0xFFFFFFFF, event=0x0, cause=0x01d03h: CSM_PROC_DISCONNECTING: CSM_EVENT_ISDN_DISCONNECTED, call id = 0x8039, port = 11d03h: CSM_PROC_DISCONNECTING: CSM_EVENT_TIMEOUT, call id = 0x8039, port = 1debug ppp
To display information on traffic and exchanges in an internetwork implementing the Point-to-Point Protocol (PPP), use the debug ppp command in privileged EXEC mode. To disable debugging output, use the no form of this command.
debug ppp {packet | negotiation | error | authentication | compression | cbcp}
no debug ppp {packet | negotiation | error | authentication | compression | cbcp}
Syntax Description
Command Modes
Privileged EXEC
Usage Guidelines
Use the debug ppp command when trying to find the following:
•
•
•
•
•
•
•
•
Refer to Internet RFCs 1331, 1332, and 1333 for details concerning PPP-related nomenclature and protocol information.
Caution
Examples
The following is sample output from the debug ppp packet command as seen from the Link Quality Monitor (LQM) side of the connection. This example depicts packet exchanges under normal PPP operation.
Router# debug ppp packetPPP Serial4(o): lcp_slqr() state = OPEN magic = D21B4, len = 48PPP Serial4(i): pkt type 0xC025, datagramsize 52PPP Serial4(i): lcp_rlqr() state = OPEN magic = D3454, len = 48PPP Serial4(i): pkt type 0xC021, datagramsize 16PPP Serial4: I LCP ECHOREQ(9) id 3 (C) magic D3454PPP Serial4: input(C021) state = OPEN code = ECHOREQ(9) id = 3 len = 12PPP Serial4: O LCP ECHOREP(A) id 3 (C) magic D21B4PPP Serial4(o): lcp_slqr() state = OPEN magic = D21B4, len = 48PPP Serial4(i): pkt type 0xC025, datagramsize 52PPP Serial4(i): lcp_rlqr() state = OPEN magic = D3454, len = 48PPP Serial4(i): pkt type 0xC021, datagramsize 16PPP Serial4: I LCP ECHOREQ(9) id 4 (C) magic D3454PPP Serial4: input(C021) state = OPEN code = ECHOREQ(9) id = 4 len = 12PPP Serial4: O LCP ECHOREP(A) id 4 (C) magic D21B4PPP Serial4(o): lcp_slqr() state = OPEN magic = D21B4, len = 48PPP Serial4(i): pkt type 0xC025, datagramsize 52PPP Serial4(i): lcp_rlqr() state = OPEN magic = D3454, len = 48PPP Serial4(i): pkt type 0xC021, datagramsize 16PPP Serial4: I LCP ECHOREQ(9) id 5 (C) magic D3454PPP Serial4: input(C021) state = OPEN code = ECHOREQ(9) id = 5 len = 12PPP Serial4: O LCP ECHOREP(A) id 5 (C) magic D21B4PPP Serial4(o): lcp_slqr() state = OPEN magic = D21B4, len = 48PPP Serial4(i): pkt type 0xC025, datagramsize 52PPP Serial4(i): lcp_rlqr() state = OPEN magic = D3454, len = 48PPP Serial4(i): pkt type 0xC021, datagramsize 16PPP Serial4: I LCP ECHOREQ(9) id 6 (C) magic D3454PPP Serial4: input(C021) state = OPEN code = ECHOREQ(9) id = 6 len = 12PPP Serial4: O LCP ECHOREP(A) id 6 (C) magic D21B4PPP Serial4(o): lcp_slqr() state = OPEN magic = D21B4, len = 48PPP Serial4(i): pkt type 0xC025, datagramsize 52PPP Serial4(i): lcp_rlqr() state = OPEN magic = D3454, len = 48PPP Serial4(i): pkt type 0xC021, datagramsize 16PPP Serial4: I LCP ECHOREQ(9) id 7 (C) magic D3454PPP Serial4: input(C021) state = OPEN code = ECHOREQ(9) id = 7 len = 12PPP Serial4: O LCP ECHOREP(A) id 7 (C) magic D21B4PPP Serial4(o): lcp_slqr() state = OPEN magic = D21B4, len = 48Table 267 describes the significant fields shown in the display.
To elaborate on the displayed output, consider the partial exchange. This sequence shows that one side is using ECHO for its keepalives and the other side is using LQRs.
Router# debug ppp packetPPP Serial4(o): lcp_slqr() state = OPEN magic = D21B4, len = 48PPP Serial4(i): pkt type 0xC025, datagramsize 52PPP Serial4(i): lcp_rlqr() state = OPEN magic = D3454, len = 48PPP Serial4(i): pkt type 0xC021, datagramsize 16PPP Serial4: I LCP ECHOREQ(9) id 3 (C) magic D3454PPP Serial4: input(C021) state = OPEN code = ECHOREQ(9) id = 3 len = 12PPP Serial4: O LCP ECHOREP(A) id 3 (C) magic D21B4PPP Serial4(o): lcp_slqr() state = OPEN magic = D21B4, len = 48The first line states that the router with debugging enabled has sent an LQR to the other side of the PPP connection:
PPP Serial4(o): lcp_slqr() state = OPEN magic = D21B4, len = 48The next two lines indicate that the router has received a packet of type C025 (LQM) and provides details about the packet:
PPP Serial4(i): pkt type 0xC025, datagramsize 52PPP Serial4(i): lcp_rlqr() state = OPEN magic = D3454, len = 48The next two lines indicate that the router received an ECHOREQ of type C021 (LCP). The other side is sending ECHOs. The router on which debugging is configured for LQM but also responds to ECHOs.
PPP Serial4(i): pkt type 0xC021, datagramsize 16PPP Serial4: I LCP ECHOREQ(9) id 3 (C) magic D3454Next, the router is detected to have responded to the ECHOREQ with an ECHOREP and is preparing to send out an LQR:
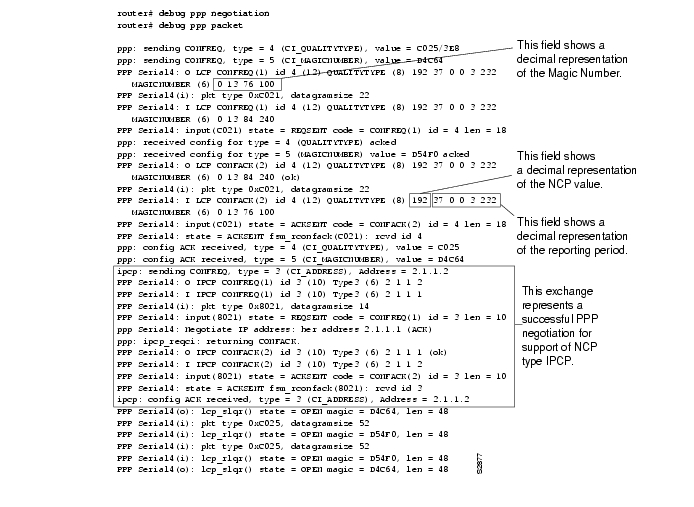
PPP Serial4: O LCP ECHOREP(A) id 3 (C) magic D21B4PPP Serial4(o): lcp_slqr() state = OPEN magic = D21B4, len = 48The following is sample output from the debug ppp negotiation command. This is a normal negotiation, where both sides agree on Network Control Program (NCP) parameters. In this case, protocol type IP is proposed and acknowledged.
Router# debug ppp negotiationppp: sending CONFREQ, type = 4 (CI_QUALITYTYPE), value = C025/3E8ppp: sending CONFREQ, type = 5 (CI_MAGICNUMBER), value = 3D56CACppp: received config for type = 4 (QUALITYTYPE) ackedppp: received config for type = 5 (MAGICNUMBER) value = 3D567F8 acked (ok)PPP Serial4: state = ACKSENT fsm_rconfack(C021): rcvd id 5ppp: config ACK received, type = 4 (CI_QUALITYTYPE), value = C025ppp: config ACK received, type = 5 (CI_MAGICNUMBER), value = 3D56CACppp: ipcp_reqci: returning CONFACK.(ok)PPP Serial4: state = ACKSENT fsm_rconfack(8021): rcvd id 4Table 268 describes significant fields shown in the display.
The first two lines indicate that the router is trying to bring up LCP and will use the indicated negotiation options (Quality Protocol and Magic Number). The value fields are the values of the options themselves. C025/3E8 translates to Quality Protocol LQM. 3E8 is the reporting period (in hundredths of a second). 3D56CAC is the value of the Magic Number for the router.
ppp: sending CONFREQ, type = 4 (CI_QUALITYTYPE), value = C025/3E8ppp: sending CONFREQ, type = 5 (CI_MAGICNUMBER), value = 3D56CACThe next two lines indicate that the other side negotiated for options 4 and 5 as requested and acknowledged both. If the responding end does not support the options, a CONFREJ is sent by the responding node. If the responding end does not accept the value of the option, a Configure-Negative-Acknowledge (CONFNAK) is sent with the value field modified.
ppp: received config for type = 4 (QUALITYTYPE) ackedppp: received config for type = 5 (MAGICNUMBER) value = 3D567F8 acked (ok)The next three lines indicate that the router received a CONFAK from the responding side and displays accepted option values. Use the rcvd id field to verify that the CONFREQ and CONFACK have the same ID field.
PPP Serial4: state = ACKSENT fsm_rconfack(C021): rcvd id 5ppp: config ACK received, type = 4 (CI_QUALITYTYPE), value = C025ppp: config ACK received, type = 5 (CI_MAGICNUMBER), value = 3D56CACThe next line indicates that the router has IP routing enabled on this interface and that the IPCP NCP negotiated successfully:
ppp: ipcp_reqci: returning CONFACK.In the last line, the state of the router is listed as ACKSENT.
PPP Serial4: state = ACKSENT fsm_rconfack(C021): rcvd id 5\The following is sample output from when the debug ppp packet and debug ppp negotiation commands are enabled at the same time.
The following is sample output from the debug ppp negotiation command when the remote side of the connection is unable to respond to LQM requests:
Router# debug ppp negotiationppp: sending CONFREQ, type = 4 (CI_QUALITYTYPE), value = C025/3E8ppp: sending CONFREQ, type = 5 (CI_MAGICNUMBER), value = 44B7010ppp: sending CONFREQ, type = 4 (CI_QUALITYTYPE), value = C025/3E8ppp: sending CONFREQ, type = 5 (CI_MAGICNUMBER), value = 44B7010ppp: sending CONFREQ, type = 4 (CI_QUALITYTYPE), value = C025/3E8ppp: sending CONFREQ, type = 5 (CI_MAGICNUMBER), value = 44B7010ppp: sending CONFREQ, type = 4 (CI_QUALITYTYPE), value = C025/3E8ppp: sending CONFREQ, type = 5 (CI_MAGICNUMBER), value = 44B7010ppp: sending CONFREQ, type = 4 (CI_QUALITYTYPE), value = C025/3E8ppp: sending CONFREQ, type = 5 (CI_MAGICNUMBER), value = 44B7010ppp: sending CONFREQ, type = 4 (CI_QUALITYTYPE), value = C025/3E8ppp: sending CONFREQ, type = 5 (CI_MAGICNUMBER), value = 44B7010ppp: sending CONFREQ, type = 4 (CI_QUALITYTYPE), value = C025/3E8ppp: sending CONFREQ, type = 5 (CI_MAGICNUMBER), value = 44B7010ppp: sending CONFREQ, type = 4 (CI_QUALITYTYPE), value = C025/3E8ppp: sending CONFREQ, type = 5 (CI_MAGICNUMBER), value = 44B7010ppp: sending CONFREQ, type = 4 (CI_QUALITYTYPE), value = C025/3E8ppp: sending CONFREQ, type = 5 (CI_MAGICNUMBER), value = 44B7010ppp: sending CONFREQ, type = 4 (CI_QUALITYTYPE), value = C025/3E8ppp: sending CONFREQ, type = 5 (CI_MAGICNUMBER), value = 44B7010ppp: sending CONFREQ, type = 4 (CI_QUALITYTYPE), value = C025/3E8ppp: sending CONFREQ, type = 5 (CI_MAGICNUMBER), value = 44B7010ppp: sending CONFREQ, type = 4 (CI_QUALITYTYPE), value = C025/3E8ppp: sending CONFREQ, type = 5 (CI_MAGICNUMBER), value = 44C1488The following is sample output when no response is detected for configuration requests (with both the debug ppp negotiation and debug ppp packet commands enabled):
Router# debug ppp negotiationRouter# debug ppp packetppp: sending CONFREQ, type = 4 (CI_QUALITYTYPE), value = C025/3E8ppp: sending CONFREQ, type = 5 (CI_MAGICNUMBER), value = 44DFDC8PPP Serial4: O LCP CONFREQ(1) id 14 (12) QUALITYTYPE (8) 192 37 0 0 3 232MAGICNUMBER (6) 4 77 253 200ppp: TIMEout: Time= 44E0980 State= 3ppp: sending CONFREQ, type = 4 (CI_QUALITYTYPE), value = C025/3E8ppp: sending CONFREQ, type = 5 (CI_MAGICNUMBER), value = 44DFDC8PPP Serial4: O LCP CONFREQ(1) id 15 (12) QUALITYTYPE (8) 192 37 0 0 3 232MAGICNUMBER (6) 4 77 253 200ppp: TIMEout: Time= 44E1828 State= 3ppp: sending CONFREQ, type = 4 (CI_QUALITYTYPE), value = C025/3E8ppp: sending CONFREQ, type = 5 (CI_MAGICNUMBER), value = 44DFDC8PPP Serial4: O LCP CONFREQ(1) id 16 (12) QUALITYTYPE (8) 192 37 0 0 3 232MAGICNUMBER (6) 4 77 253 200ppp: TIMEout: Time= 44E27C8 State= 3ppp: sending CONFREQ, type = 4 (CI_QUALITYTYPE), value = C025/3E8ppp: sending CONFREQ, type = 5 (CI_MAGICNUMBER), value = 44DFDC8PPP Serial4: O LCP CONFREQ(1) id 17 (12) QUALITYTYPE (8) 192 37 0 0 3 232MAGICNUMBER (6) 4 77 253 200ppp: TIMEout: Time= 44E3768 State= 3The following is sample output from the debug ppp error command. These messages might appear when the Quality Protocol option is enabled on an interface that is already running PPP.
Router# debug ppp errorPPP Serial3(i): rlqr receive failure. successes = 15PPP: myrcvdiffp = 159 peerxmitdiffp = 41091PPP: myrcvdiffo = 2183 peerxmitdiffo = 1714439PPP: threshold = 25PPP Serial4(i): rlqr transmit failure. successes = 15PPP: myxmitdiffp = 41091 peerrcvdiffp = 159PPP: myxmitdiffo = 1714439 peerrcvdiffo = 2183PPP: l->OutLQRs = 1 LastOutLQRs = 1PPP: threshold = 25PPP Serial3(i): lqr_protrej() Stop sending LQRs.PPP Serial3(i): The link appears to be looped back.Table 269 describes the significant fields shown in the display.
The following is sample output from the debug ppp authentication command. Use this command to determine why an authentication fails.
Router# debug ppp authenticationSerial0: Unable to authenticate. No name received from peerSerial0: Unable to validate CHAP response. USERNAME pioneer not found.Serial0: Unable to validate CHAP response. No password defined for USERNAME pioneerSerial0: Failed CHAP authentication with remote.Remote message is Unknown nameSerial0: remote passed CHAP authentication.Serial0: Passed CHAP authentication with remote.Serial0: CHAP input code = 4 id = 3 len = 48In general, these messages are self-explanatory. Fields that can show optional output are outlined in Table 270.
The following shows sample output from the debug ppp command using the cbcp keyword. This output depicts packet exchanges under normal PPP operation where the Cisco access server is waiting for the remote PC to respond to the MSCB request. The router also has debug ppp negotiation and service timestamps msec commands enabled.
Router# debug ppp cbcpDec 17 00:48:11.302: As8 MCB: User mscb Callback Number - Client ANYDec 17 00:48:11.306: Async8 PPP: O MCB Request(1) id 1 len 9Dec 17 00:48:11.310: Async8 MCB: O 1 1 0 9 2 5 0 1 0Dec 17 00:48:11.314: As8 MCB: O Request Id 1 Callback Type Client-Num delay 0Dec 17 00:48:13.342: As8 MCB: Timeout in state WAIT_RESPONSEDec 17 00:48:13.346: Async8 PPP: O MCB Request(1) id 2 len 9Dec 17 00:48:13.346: Async8 MCB: O 1 2 0 9 2 5 0 1 0Dec 17 00:48:13.350: As8 MCB: O Request Id 2 Callback Type Client-Num delay 0Dec 17 00:48:15.370: As8 MCB: Timeout in state WAIT_RESPONSEDec 17 00:48:15.374: Async8 PPP: O MCB Request(1) id 3 len 9Dec 17 00:48:15.374: Async8 MCB: O 1 3 0 9 2 5 0 1 0Dec 17 00:48:15.378: As8 MCB: O Request Id 3 Callback Type Client-Num delay 0Dec 17 00:48:17.398: As8 MCB: Timeout in state WAIT_RESPONSEDec 17 00:48:17.402: Async8 PPP: O MCB Request(1) id 4 len 9Dec 17 00:48:17.406: Async8 MCB: O 1 4 0 9 2 5 0 1 0Dec 17 00:48:17.406: As8 MCB: O Request Id 4 Callback Type Client-Num delay 0Dec 17 00:48:19.426: As8 MCB: Timeout in state WAIT_RESPONSEDec 17 00:48:19.430: Async8 PPP: O MCB Request(1) id 5 len 9Dec 17 00:48:19.430: Async8 MCB: O 1 5 0 9 2 5 0 1 0Dec 17 00:48:19.434: As8 MCB: O Request Id 5 Callback Type Client-Num delay 0Dec 17 00:48:21.454: As8 MCB: Timeout in state WAIT_RESPONSEDec 17 00:48:21.458: Async8 PPP: O MCB Request(1) id 6 len 9Dec 17 00:48:21.462: Async8 MCB: O 1 6 0 9 2 5 0 1 0Dec 17 00:48:21.462: As8 MCB: O Request Id 6 Callback Type Client-Num delay 0Dec 17 00:48:23.482: As8 MCB: Timeout in state WAIT_RESPONSEDec 17 00:48:23.486: Async8 PPP: O MCB Request(1) id 7 len 9Dec 17 00:48:23.490: Async8 MCB: O 1 7 0 9 2 5 0 1 0Dec 17 00:48:23.490: As8 MCB: O Request Id 7 Callback Type Client-Num delay 0Dec 17 00:48:25.510: As8 MCB: Timeout in state WAIT_RESPONSEDec 17 00:48:25.514: Async8 PPP: O MCB Request(1) id 8 len 9Dec 17 00:48:25.514: Async8 MCB: O 1 8 0 9 2 5 0 1 0Dec 17 00:48:25.518: As8 MCB: O Request Id 8 Callback Type Client-Num delay 0Dec 17 00:48:26.242: As8 PPP: I pkt type 0xC029, datagramsize 18Dec 17 00:48:26.246: Async8 PPP: I MCB Response(2) id 8 len 16Dec 17 00:48:26.250: Async8 MCB: I 2 8 0 10 2 C C 1 32 34 39 32 36 31 33 0Dec 17 00:48:26.254: As8 MCB: Received responseDec 17 00:48:26.258: As8 MCB: Response CBK-Client-Num 2 12 12, addr 1-2492613Dec 17 00:48:26.262: Async8 PPP: O MCB Ack(3) id 9 len 16Dec 17 00:48:26.266: Async8 MCB: O 3 9 0 10 2 C C 1 32 34 39 32 36 31 33 0Dec 17 00:48:26.270: As8 MCB: O Ack Id 9 Callback Type Client-Num delay 12Dec 17 00:48:26.270: As8 MCB: Negotiated MCB with peerDec 17 00:48:26.390: As8 LCP: I TERMREQ [Open] id 4 len 8 (0x00000000)Dec 17 00:48:26.390: As8 LCP: O TERMACK [Open] id 4 len 4Dec 17 00:48:26.394: As8 MCB: Peer terminating the linkDec 17 00:48:26.402: As8 MCB: Initiate Callback for mscb at 2492613 using AsyncThe following is sample output from the debug ppp compression command with service timestamps enabled and shows a typical PPP packet exchange between the router and Microsoft client where the MPPC header sequence numbers increment correctly:
Router# debug ppp compression00:04:14: BR0:1 MPPC: Decomp - hdr/exp_cc# 0x2003/0x000300:04:14: BR0:1 MPPC: Decomp - hdr/exp_cc# 0x2004/0x000400:04:14: BR0:1 MPPC: Decomp - hdr/exp_cc# 0x2005/0x000500:04:14: BR0:1 MPPC: Decomp - hdr/exp_cc# 0x2006/0x000600:04:14: BR0:1 MPPC: Decomp - hdr/exp_cc# 0x2007/0x0007Table 271 describes the significant fields shown in the display.
The following shows sample output from debug ppp negotiation and debug ppp error commands, which can be used to troubleshoot initial PPP negotiation and setup errors. This example shows a virtual interface (virtual interface 1) during normal PPP operation and CCP negotiation.
Router# debug ppp negotiation errorVt1 PPP: Unsupported or un-negotiated protocol. Link arpVPDN: Chap authentication succeeded for p5200Vi1 PPP: Phase is DOWN, SetupVi1 VPDN: Virtual interface created for dinesh@cisco.comVi1 VPDN: Set to Async interfaceVi1 PPP: Phase is DOWN, SetupVi1 VPDN: Clone from Vtemplate 1 filterPPP=0 blockingVi1 CCP: Re-Syncing history using legacy method%LINK-3-UPDOWN: Interface Virtual-Access1, changed state to upVi1 PPP: Treating connection as a dedicated lineVi1 PPP: Phase is ESTABLISHING, Active OpenVi1 LCP: O CONFREQ [Closed] id 1 len 25Vi1 LCP: ACCM 0x000A0000 (0x0206000A0000)Vi1 LCP: AuthProto CHAP (0x0305C22305)Vi1 LCP: MagicNumber 0x000FB69F (0x0506000FB69F)Vi1 LCP: PFC (0x0702)Vi1 LCP: ACFC (0x0802)Vi1 VPDN: Bind interface direction=2Vi1 PPP: Treating connection as a dedicated lineVi1 LCP: I FORCED CONFREQ len 21Vi1 LCP: ACCM 0x000A0000 (0x0206000A0000)Vi1 LCP: AuthProto CHAP (0x0305C22305)Vi1 LCP: MagicNumber 0x12A5E4B5 (0x050612A5E4B5)Vi1 LCP: PFC (0x0702)Vi1 LCP: ACFC (0x0802)Vi1 VPDN: PPP LCP accepted sent & rcv CONFACKVi1 PPP: Phase is AUTHENTICATING, by this endVi1 CHAP: O CHALLENGE id 1 len 27 from "l_4000"Vi1 CHAP: I RESPONSE id 20 len 37 from "dinesh@cisco.com"Vi1 CHAP: O SUCCESS id 20 len 4Vi1 PPP: Phase is UPVi1 IPCP: O CONFREQ [Closed] id 1 len 10Vi1 IPCP: Address 15.2.2.3 (0x03060F020203)Vi1 CCP: O CONFREQ [Not negotiated] id 1 len 10Vi1 CCP: MS-PPC supported bits 0x00000001 (0x120600000001)Vi1 IPCP: I CONFREQ [REQsent] id 1 len 34Vi1 IPCP: Address 0.0.0.0 (0x030600000000)Vi1 IPCP: PrimaryDNS 0.0.0.0 (0x810600000000)Vi1 IPCP: PrimaryWINS 0.0.0.0 (0x820600000000)Vi1 IPCP: SecondaryDNS 0.0.0.0 (0x830600000000)Vi1 IPCP: SecondaryWINS 0.0.0.0 (0x840600000000)Vi1 IPCP: Using the default poolVi1 IPCP: Pool returned 11.2.2.5Vi1 IPCP: O CONFREJ [REQsent] id 1 len 16Vi1 IPCP: PrimaryWINS 0.0.0.0 (0x820600000000)Vi1 IPCP: SecondaryWINS 0.0.0.0 (0x840600000000)Vi1 CCP: I CONFREQ [REQsent] id 1 len 15Vi1 CCP: MS-PPC supported bits 0x00000001 (0x120600000001)Vi1 CCP: Stacker history 1 check mode EXTENDED (0x1105000104)Vi1 CCP: Already accepted another CCP option, rejecting this STACKERVi1 CCP: O CONFREJ [REQsent] id 1 len 9Vi1 CCP: Stacker history 1 check mode EXTENDED (0x1105000104)Vi1 IPCP: I CONFACK [REQsent] id 1 len 10Vi1 IPCP: Address 15.2.2.3 (0x03060F020203)Vi1 CCP: I CONFACK [REQsent] id 1 len 10Vi1 CCP: MS-PPC supported bits 0x00000001 (0x120600000001)Vi1 CCP: I CONFREQ [ACKrcvd] id 2 len 10Vi1 CCP: MS-PPC supported bits 0x00000001 (0x120600000001)Vi1 CCP: O CONFACK [ACKrcvd] id 2 len 10Vi1 CCP: MS-PPC supported bits 0x00000001 (0x120600000001)Vi1 CCP: State is OpenVi1 IPCP: I CONFREQ [ACKrcvd] id 2 len 22Vi1 IPCP: Address 0.0.0.0 (0x030600000000)Vi1 IPCP: PrimaryDNS 0.0.0.0 (0x810600000000)Vi1 IPCP: SecondaryDNS 0.0.0.0 (0x830600000000)Vi1 IPCP: O CONFNAK [ACKrcvd] id 2 len 22Vi1 IPCP: Address 11.2.2.5 (0x03060B020205)Vi1 IPCP: PrimaryDNS 171.69.1.148 (0x8106AB450194)Vi1 IPCP: SecondaryDNS 171.69.2.132 (0x8306AB450284)Vi1 IPCP: I CONFREQ [ACKrcvd] id 3 len 22Vi1 IPCP: Address 11.2.2.5 (0x03060B020205)Vi1 IPCP: PrimaryDNS 171.69.1.148 (0x8106AB450194)Vi1 IPCP: SecondaryDNS 171.69.2.132 (0x8306AB450284)Vi1 IPCP: O CONFACK [ACKrcvd] id 3 len 22Vi1 IPCP: Address 11.2.2.5 (0x03060B020205)Vi1 IPCP: PrimaryDNS 171.69.1.148 (0x8106AB450194)Vi1 IPCP: SecondaryDNS 171.69.2.132 (0x8306AB450284)Vi1 IPCP: State is OpenVi1 IPCP: Install route to 11.2.2.5debug pppatm
To enable debug reports for PPP over ATM (PPPoA) events, errors, and states, either globally or conditionally, on an interface or virtual circuit (VC), use the debug pppatm command in privileged EXEC mode. To disable debugging output, use the no form of this command.
debug pppatm {event | error | state} [interface atm interface-number [subinterface-number]] vc {[vpi/vci]vci | virtual-circuit-name}
no debug pppatm {event | error | state} [interface atm interface-number [subinterface-number] vc {[vpi/]vci | virtual-circuit-name}
Syntax Description
Defaults
No default behavior or values
Command Modes
Privileged EXEC
Command History
Usage Guidelines
Each specific PPPoA debug report must be requested on a separate command line; see the "Examples" section.
Examples
The following is example output of a PPPoA session with event, error, and state debug reports enabled on ATM interface 1/0.10:
Router# debug pppatm event interface atm1/0.10Router# debug pppatm error interface atm1/0.10Router# debug pppatm state interface atm1/0.1000:03:08: PPPATM: ATM1/0.10 0/101 [1], Event = Clear Session00:03:08: PPPATM: ATM1/0.10 0/101 [1], Event = Disconnecting00:03:08: PPPATM: ATM1/0.10 0/101 [1], Event = AAA gets dynamic attrs00:03:08: PPPATM: ATM1/0.10 0/101 [1], Event = AAA gets dynamic attrs00:03:08: PPPATM: ATM1/0.10 0/101 [1], Event = SSS Cleanup00:03:08: PPPATM: ATM1/0.10 0/101 [0], State = DOWN00:03:08: PPPATM: ATM1/0.10 0/101 [0], Event = Up Pending00:03:16: PPPATM: ATM1/0.10 0/101 [0], Event = Up Dequeued00:03:16: PPPATM: ATM1/0.10 0/101 [0], Event = Processing Up00:03:16: PPPATM: ATM1/0.10 0/101 [2], Event = Access IE allocated00:03:16: PPPATM: ATM1/0.10 0/101 [2], Event = Set Pkts to SSS00:03:16: PPPATM: ATM1/0.10 0/101 [2], Event = AAA gets retrived attrs00:03:16: PPPATM: ATM1/0.10 0/101 [2], Event = AAA gets nas port details00:03:16: PPPATM: ATM1/0.10 0/101 [2], Event = AAA gets dynamic attrs00:03:16: PPPATM: ATM1/0.10 0/101 [2], Event = AAA gets dynamic attrs00:03:16: PPPATM: ATM1/0.10 0/101 [2], Event = AAA unique id allocated00:03:16: PPPATM: ATM1/0.10 0/101 [2], Event = No AAA method list set00:03:16: PPPATM: ATM1/0.10 0/101 [2], Event = SSS Request00:03:16: PPPATM: ATM1/0.10 0/101 [2], State = NAS_PORT_POLICY_INQUIRY00:03:16: PPPATM: ATM1/0.10 0/101 [2], Event = SSS Msg Received = 100:03:16: PPPATM: ATM1/0.10 0/101 [2], State = PPP_START00:03:16: PPPATM: ATM1/0.10 0/101 [2], Event = PPP Msg Received = 100:03:16: PPPATM: ATM1/0.10 0/101 [2], State = LCP_NEGOTIATION00:03:27: PPPATM: ATM1/0.10 0/101 [2], Event = PPP Msg Received = 400:03:27: PPPATM: ATM1/0.10 0/101 [2], Event = HW Switch support FORW = 000:03:27: PPPATM: ATM1/0.10 0/101 [2], Event = Access IE get nas port00:03:27: PPPATM: ATM1/0.10 0/101 [2], Event = AAA gets dynamic attrs00:03:27: PPPATM: ATM1/0.10 0/101 [2], Event = AAA gets dynamic attrs00:03:27: PPPATM: ATM1/0.10 0/101 [2], Event = PPP Msg Received = 500:03:27: PPPATM: ATM1/0.10 0/101 [2], Event = Set Pkts to SSS00:03:27: PPPATM: ATM1/0.10 0/101 [2], State = FORWARDEDTable 272 describes the significant fields shown in the display.
Related Commands
atm pppatm passive
Places an ATM subinterface into passive mode.
show pppatm summary
Displays PPPoA session counts.
debug ppp bap
To display general Bandwidth Allocation Control Protocol (BACP) transactions, use the debug ppp bap command in privileged EXEC mode. To disable debugging output, use the no form of this command.
debug ppp bap [error | event | negotiation]
no debug ppp bap [error | event | negotiation]
Syntax Description
Command Modes
Privileged EXEC
Usage Guidelines
Do not use this command when memory is scarce or in very high traffic situations.
Examples
The following types of events generate the debugging messages displayed in the figures in this section:
•
•
•
•
•
•
•
•
•
•
•
•
•
•
•
The following is sample output from the debug ppp bap command:
Router# debug ppp bapBAP Virtual-Access1: group "laudrup" (2) (multilink) without precedence createdBAP laudrup: sending CallReq, id 2, len 38 on BRI3:1 to remoteBAP Virtual-Access1: received CallRsp, id 2, len 13BAP laudrup: CallRsp, id 2, ACKBAP laudrup: attempt1 to dial 19995776677 on BRI3---> reason BAP - Multilink bundle overloadedBAP laudrup: sending StatusInd, id 2, len 44 on Virtual-Access1 to remoteBAP Virtual-Access1: received StatusRsp, id 2, len 1BAP laudrup: StatusRsp, id 2, ACKTable 273 describes the significant fields shown in the display.
The debug ppp bap event command might show state transitions and protocol actions, in addition to the basic debug ppp bap command.
The following is sample output from the debug ppp bap event command:
Router# debug ppp bap eventBAP laudrup: Idle --> AddWaitBAP laudrup: AddWait --> AddPendingBAP laudrup: AddPending --> IdleThe following is sample output from the debug ppp bap event command:
Router# debug ppp bap eventPeer does not support a message typeNo response to a particular requestNo response to all request retransmissionsNot configured to initiate link additionExpected action by peer has not occurredExceeded number of retriesNo links available to call outUnable to provide phone numbers for callbackMaximum number of links in the groupMinimum number of links in the groupUnable to process link addition at presentUnable to process link removal at presentNot configured/unable to initiate link removalLink addition completed notificationLink addition failed notificationDetermination of location of the group configLink with specified discriminator not in groupLink removal failedCall failure with statusFailed to dial specified numberDiscarding retransmissionUnable to find received identifierReceived StatusInd when no call pendingDiscarding message with no phone deltaUnable to send message in particular stateReceived a zero identifierRequest has precedenceThe error messages displayed might be added to the basic output when the debug ppp bap error command is used. Because the errors are very rare, you might never see these messages.
Router# debug ppp bap errorUnable to find appropriate request for received responseInvalid message type of queueReceived request is not part of the groupAdd link attempt failed to locate groupRemove link attempt failed to locate groupUnable to inform peer of link additionChanging of precedence cannot locate groupReceived short header/illegal length/short packetInvalid configuration information lengthUnable to NAK incomplete optionsUnable to determine current number of linksNo interface list to dial onAttempt to send invalid dataLocal link discriminator is not in groupReceived response type is incorrect for identifierThe messages displayed might be added to the basic output when the debug ppp bap negotiation command is used:
Router# debug ppp bap negotiationBAP laudrup: adding link speed 64 kbps for type 0x1 len 5BAP laudrup: adding reason "User initiated addition", len 25BAP laudrup: CallRsp, id 4, ACKBAP laudrup: link speed 64 kbps for types 0x1, len 5 (ACK)BAP laudrup: phone number "1: 0 2: ", len 7 (ACK)BAP laudrup: adding call status 0, action 0 len 4BAP laudrup: adding 1 phone numbers "1: 0 2: " len 7BAP laudrup: adding reason "Successfully added link", len 25BAP laudrup: StatusRsp, id 4, ACKAdditional negotiation messages might also be displayed for the following:
Received BAP messageSending messageDecode individual options for send/receiveNotification of invalid optionsThe following shows additional reasons for a particular BAP action that might be displayed in an "adding reason" line of the debug ppp bap negotiation command output:
"Outgoing add request has precedence""Outgoing remove request has precedence""Unable to change request precedence""Unable to determine valid phone delta""Attempting to add link""Link addition is pending""Attempting to remove link""Link removal is pending""Precedence of peer marked CallReq for no action""Callback request rejected due to configuration""Call request rejected due to configuration""No links of specified type(s) available""Drop request disallowed due to configuration""Discriminator is invalid""No response to call requests""Successfully added link""Attempt to dial destination failed""No interfaces present to dial out""No dial string present to dial out""Mandatory options incomplete""Load has not exceeded threshold""Load is above threshold""Currently attempting to dial destination""No response to CallReq from race condition"Table 274 describes the reasons for a BACP Negotiation Action.
debug ppp multilink events
To display information about events affecting multilink groups established for Bandwidth Allocation Control Protocol (BACP), use the debug ppp multilink events command in privileged EXEC mode. To disable debugging output, use the no form of this command.
debug ppp multilink events
no debug ppp multilink events
Syntax Description
This command has no arguments or keywords.
Command Modes
Privileged EXEC
Usage Guidelines
Caution
Examples
The following is sample output from the debug ppp multilink events command:
Router# debug ppp multilink eventsMLP laudrup: established BAP group 4 on Virtual-Access1, physical BRI3:1MLP laudrup: removed BAP group 4Other event messages include the following:
Unable to find bundle for BAP group identifierUnable to find physical interface to start BAPUnable to create BAP groupAttempt to start BACP when inactive or runningAttempt to start BACP on non-MLP interfaceLink protocol has gone down, removing BAP groupLink protocol has gone down, BAP not running or presentTable 275 describes the significant fields shown in the display.
debug ppp multilink fragments
To display information about individual multilink fragments and important multilink events, use the debug ppp multilink fragments command in privileged EXEC mode. To disable debugging output, use the no form of this command.
debug ppp multilink fragments
no debug ppp multilink fragments
Syntax Description
This command has no arguments or keywords.
Command Modes
Privileged EXEC
Usage Guidelines
Caution
Examples
The following is sample output from the debug ppp multilink fragments command when used with the ping EXEC command. The debug output indicates that a multilink PPP packet on interface BRI 0 (on the B channel) is an input (I) or output (O) packet. The output also identifies the sequence number of the packet and the size of the fragment.
Router# debug ppp multilink fragmentsRouter# ping 7.1.1.7Type escape sequence to abort.Sending 5, 100-byte ICMP Echos to 7.1.1.7, timeout is 2 seconds:!!!!!Success rate is 100 percent (5/5), round-trip min/avg/max = 32/34/36 msRouter#2:00:28: MLP BRI0: B-Channel 1: O seq 80000000: size 582:00:28: MLP BRI0: B-Channel 2: O seq 40000001: size 592:00:28: MLP BRI0: B-Channel 2: I seq 40000001: size 592:00:28: MLP BRI0: B-Channel 1: I seq 80000000: size 582:00:28: MLP BRI0: B-Channel 1: O seq 80000002: size 582:00:28: MLP BRI0: B-Channel 2: O seq 40000003: size 592:00:28: MLP BRI0: B-Channel 2: I seq 40000003: size 592:00:28: MLP BRI0: B-Channel 1: I seq 80000002: size 582:00:28: MLP BRI0: B-Channel 1: O seq 80000004: size 582:00:28: MLP BRI0: B-Channel 2: O seq 40000005: size 592:00:28: MLP BRI0: B-Channel 2: I seq 40000005: size 592:00:28: MLP BRI0: B-Channel 1: I seq 80000004: size 582:00:28: MLP BRI0: B-Channel 1: O seq 80000006: size 582:00:28: MLP BRI0: B-Channel 2: O seq 40000007: size 592:00:28: MLP BRI0: B-Channel 2: I seq 40000007: size 592:00:28: MLP BRI0: B-Channel 1: I seq 80000006: size 582:00:28: MLP BRI0: B-Channel 1: O seq 80000008: size 582:00:28: MLP BRI0: B-Channel 2: O seq 40000009: size 592:00:28: MLP BRI0: B-Channel 2: I seq 40000009: size 592:00:28: MLP BRI0: B-Channel 1: I seq 80000008: size 58debug ppp multilink negotiation
Note
To display information about events affecting multilink groups established controlled by Bandwidth Allocation Control Protocol (BACP), use the debug ppp multilink negotiation command in privileged EXEC mode. To disable debugging output, use the no form of this command.
debug ppp multilink negotiation
no debug ppp multilink negotiation
Syntax Description
This command has no arguments or keywords.
Command Modes
Privileged EXEC
Command History
Usage Guidelines
Caution
Examples
The following sample output shows Link Control Protocol (LCP) and Network Control Program (NCP) messages that might appear in debug ppp multilink negotiation command. These messages show information about PPP negotiations between the multilink peers.
Router# debug ppp multilink negotiationppp: sending CONFREQ, type = 23 (CI_LINK_DISCRIMINATOR), value = 0xFPPP BRI3:1: received config for type = 23 (LINK_DISCRIMINATOR) value = 0xA ackedRouter# debug ppp multilink negotiationppp: sending CONFREQ, type = 1 (CI_FAVORED_PEER), value = 0x647BD090PPP Virtual-Access1: received CONFREQ, type 1, value = 0x382BBF5 (ACK)PPP Virtual-Access1: BACP returning CONFACKppp: config ACK received, type = 1 (CI_FAVORED_PEER), value = 0x647BD090PPP Virtual-Access1: BACP upTable 276 describes the significant fields shown in the display.
debug pppoe
To display debugging information for PPP over Ethernet (PPPoE) sessions, use the debug pppoe command in privileged EXEC mode. To disable debugging output, use the no form of this command.
debug pppoe {data | errors | events | packets} [rmac remote-mac-address | interface type number [vc {[vpi/]vci | vc-name}] [vlan vlan-id]]
no debug pppoe {data | errors | events | packets} [rmac remote-mac-address | interface type number [vc {[vpi/]vci | vc-name}] [vlan vlan-id]]
Syntax Description
Command Modes
Privileged EXEC
Command History
Examples
The following examples show sample output from the debug pppoe command:
Router# debug pppoe events interface atm1/0.10 vc 101PPPoE protocol events debugging is onRouter#00:41:55:PPPoE 0:I PADI R:00b0.c2e9.c470 L:ffff.ffff.ffff 0/101 ATM1/0.1000:41:55:PPPoE 0:O PADO, R:00b0.c2e9.c470 L:0001.c9f0.0c1c 0/101 ATM1/0.1000:41:55:PPPoE 0:I PADR R:00b0.c2e9.c470 L:0001.c9f0.0c1c 0/101 ATM1/0.1000:41:55:PPPoE :encap string prepared00:41:55:[3]PPPoE 3:Access IE handle allocated00:41:55:[3]PPPoE 3:pppoe SSS switch updated00:41:55:[3]PPPoE 3:AAA unique ID allocated00:41:55:[3]PPPoE 3:No AAA accounting method list00:41:55:[3]PPPoE 3:Service request sent to SSS00:41:55:[3]PPPoE 3:Created R:0001.c9f0.0c1c L:00b0.c2e9.c470 0/101 ATM1/0.1000:41:55:[3]PPPoE 3:State REQ_NASPORT Event MORE_KEYS00:41:55:[3]PPPoE 3:O PADS R:00b0.c2e9.c470 L:0001.c9f0.0c1c 0/101 ATM1/0.1000:41:55:[3]PPPoE 3:State START_PPP Event DYN_BIND00:41:55:[3]PPPoE 3:data path set to PPP00:41:57:[3]PPPoE 3:State LCP_NEGO Event PPP_LOCAL00:41:57:PPPoE 3/SB:Sent vtemplate request on base Vi200:41:57:[3]PPPoE 3:State CREATE_VA Event VA_RESP00:41:57:[3]PPPoE 3:Vi2.1 interface obtained00:41:57:[3]PPPoE 3:State PTA_BIND Event STAT_BIND00:41:57:[3]PPPoE 3:data path set to Virtual Acess00:41:57:[3]PPPoE 3:Connected PTARouter# debug pppoe errors interface atm1/0.10PPPoE protocol errors debugging is onRouter#00:44:30:PPPoE 0:Max session count(1) on mac(00b0.c2e9.c470) reached.00:44:30:PPPoE 0:Over limit or Resource low. R:00b0.c2e9.c470 L:ffff.ffff.ffff 0/101 ATM1/0.10Table 277 describes significant fields shown in the displays.
Related Commands
debug presence
To display debugging information about the presence service, use the debug presence command in privileged EXEC mode. To disable debugging messages, use the no form of this command.
debug presence {all | asnl | errors | event | info | timer | trace | xml}
no debug presence {all | asnl | errors | event | info | timer | trace | xml}
Syntax Description
Command Modes
Privileged EXEC
Command History
12.4(11)XJ
This command was introduced.
12.4(15)T
This command was integrated into Cisco IOS Release 12.4(15)T.
Examples
The following example shows output from the debug presence asnl command:
Router# debug presence asnl*Sep 4 07:15:24.295: //PRESENCE:[17]:/presence_get_sccp_status: line is closed*Sep 4 07:15:24.295: //PRESENCE:[17]:/presence_handle_line_update: line status changes, send NOTIFY*Sep 4 07:15:24.295: //PRESENCE:[17]:/presence_set_line_status: new line status [busy ]*Sep 4 07:15:24.299: //PRESENCE:[17]:/presence_asnl_callback: type [5]*Sep 4 07:15:24.299: //PRESENCE:[17]:/presence_asnl_callback: ASNL_RESP_NOTIFY_DONE*Sep 4 07:15:24.299: //PRESENCE:[24]:/presence_get_sccp_status: line is closed*Sep 4 07:15:24.299: //PRESENCE:[24]:/presence_handle_line_update: line status changes, send NOTIFY*Sep 4 07:15:24.299: //PRESENCE:[24]:/presence_set_line_status: new line status [busy ]*Sep 4 07:15:24.299: //PRESENCE:[24]:/presence_asnl_callback: type [5]*Sep 4 07:15:24.299: //PRESENCE:[24]:/presence_asnl_callback: ASNL_RESP_NOTIFY_DONE*Sep 4 07:15:24.299: //PRESENCE:[240]:/presence_get_sccp_status: line is closed*Sep 4 07:15:24.299: //PRESENCE:[240]:/presence_handle_line_update: line status changes, send NOTIFY*Sep 4 07:15:24.299: //PRESENCE:[240]:/presence_set_line_status: new line status [busy ]*Sep 4 07:15:24.299: //PRESENCE:[766]:/presence_get_sccp_status: line is closed*Sep 4 07:15:24.299: //PRESENCE:[766]:/presence_handle_line_update: line status changes, send NOTIFY*Sep 4 07:15:24.299: //PRESENCE:[766]:/presence_set_line_status: new line status [busy ]*Sep 4 07:15:24.359: //PRESENCE:[766]:/presence_asnl_callback: type [5]*Sep 4 07:15:24.359: //PRESENCE:[766]:/presence_asnl_callback: ASNL_RESP_NOTIFY_DONE*Sep 4 07:15:24.811: //PRESENCE:[240]:/presence_asnl_callback: type [5]*Sep 4 07:15:24.811: //PRESENCE:[240]:/presence_asnl_callback: ASNL_RESP_NOTIFY_DONE*Sep 4 07:15:26.719: //PRESENCE:[17]:/presence_get_sccp_status: line is open*Sep 4 07:15:26.719: //PRESENCE:[17]:/presence_handle_line_update: line status changes, send NOTIFY*Sep 4 07:15:26.719: //PRESENCE:[17]:/presence_set_line_status: new line status [idle ]*Sep 4 07:15:26.719: //PRESENCE:[17]:/presence_asnl_callback: type [5]*Sep 4 07:15:26.719: //PRESENCE:[17]:/presence_asnl_callback: ASNL_RESP_NOTIFY_DONE*Sep 4 07:15:26.719: //PRESENCE:[24]:/presence_get_sccp_status: line is open*Sep 4 07:15:26.719: //PRESENCE:[24]:/presence_handle_line_update: line status changes, send NOTIFY*Sep 4 07:15:26.719: //PRESENCE:[24]:/presence_set_line_status: new line status [idle ]*Sep 4 07:15:26.723: //PRESENCE:[24]:/presence_asnl_callback: type [5]*Sep 4 07:15:26.723: //PRESENCE:[24]:/presence_asnl_callback: ASNL_RESP_NOTIFY_DONEThe following example shows output from the debug presence event command:
Router# debug presence event*Sep 4 07:16:02.715: //PRESENCE:[0]:/presence_sip_line_update: SIP nothing to update*Sep 4 07:16:02.723: //PRESENCE:[17]:/presence_handle_notify_done: sip stack response code [29]*Sep 4 07:16:02.723: //PRESENCE:[24]:/presence_handle_notify_done: sip stack response code [29]*Sep 4 07:16:02.791: //PRESENCE:[240]:/presence_handle_notify_done: sip stack response code [17]*Sep 4 07:16:02.791: //PRESENCE:[766]:/presence_handle_notify_done: sip stack response code [17]*Sep 4 07:16:04.935: //PRESENCE:[0]:/presence_sip_line_update: SIP nothing to update*Sep 4 07:16:04.943: //PRESENCE:[17]:/presence_handle_notify_done: sip stack response code [29]*Sep 4 07:16:04.943: //PRESENCE:[24]:/presence_handle_notify_done: sip stack response code [29]*Sep 4 07:16:04.995: //PRESENCE:[240]:/presence_handle_notify_done: sip stack response code [17]*Sep 4 07:16:04.999: //PRESENCE:[766]:/presence_handle_notify_done: sip stack response code [17]The following example shows output from the debug presence info command:
Router# debug presence info*Sep 4 07:16:20.887: //PRESENCE:[17]:/presence_handle_line_update: get line status from ccvdbPtr*Sep 4 07:16:20.887: //PRESENCE:[17]:/presence_get_sccp_status: dn_tag 2*Sep 4 07:16:20.887: //PRESENCE:[16]:/presence_start_element_handler: line 1: unknown element <presence>*Sep 4 07:16:20.887: //PRESENCE:[16]:/presence_start_element_handler: line 1: unknown element <dm:person>*Sep 4 07:16:20.887: //PRESENCE:[16]:/presence_start_element_handler: line 1: unknown element <status>*Sep 4 07:16:20.887: //PRESENCE:[16]:/presence_start_element_handler: line 1: unknown element <e:activities>*Sep 4 07:16:20.887: //PRESENCE:[16]:/presence_start_element_handler: line 1: unknown element <tuple>*Sep 4 07:16:20.887: //PRESENCE:[16]:/presence_start_element_handler: line 1: unknown element <status>*Sep 4 07:16:20.887: //PRESENCE:[16]:/presence_start_element_handler: line 1: unknown element <e:activities>*Sep 4 07:16:20.887: //PRESENCE:[0]:/presence_asnl_free_resp:*Sep 4 07:16:20.887: //PRESENCE:[24]:/presence_handle_line_update: get line status from ccvdbPtr*Sep 4 07:16:20.887: //PRESENCE:[24]:/presence_get_sccp_status: dn_tag 2*Sep 4 07:16:20.891: //PRESENCE:[23]:/presence_start_element_handler: line 1: unknown element <presence>The following example shows output from the debug presence timer command:
Router# debug presence timer*Sep 4 07:16:41.271: //PRESENCE:[17]:/presence_asnl_notify_body_handler: expires time 3600*Sep 4 07:16:41.271: //PRESENCE:[24]:/presence_asnl_notify_body_handler: expires time 3600*Sep 4 07:16:41.271: //PRESENCE:[240]:/presence_asnl_notify_body_handler: expires time 607*Sep 4 07:16:41.275: //PRESENCE:[766]:/presence_asnl_notify_body_handler: expires time 602*Sep 4 07:16:43.331: //PRESENCE:[17]:/presence_asnl_notify_body_handler: expires time 3600*Sep 4 07:16:43.331: //PRESENCE:[24]:/presence_asnl_notify_body_handler: expires time 3600*Sep 4 07:16:43.331: //PRESENCE:[240]:/presence_asnl_notify_body_handler: expires time 605*Sep 4 07:16:43.331: //PRESENCE:[766]:/presence_asnl_notify_body_handler: expires time 600The following example shows output from the debug presence trace command:
Router# debug presence trace*Sep 4 07:16:56.191: //PRESENCE:[17]:/presence_line_update:*Sep 4 07:16:56.191: //PRESENCE:[24]:/presence_line_update:*Sep 4 07:16:56.191: //PRESENCE:[240]:/presence_line_update:*Sep 4 07:16:56.191: //PRESENCE:[766]:/presence_line_update:*Sep 4 07:16:56.199: //PRESENCE:[17]:/presence_get_node_by_subid:*Sep 4 07:16:56.199: //PRESENCE:[17]:/presence_handle_line_update:*Sep 4 07:16:56.199: //PRESENCE:[17]:/presence_get_sccp_status:*Sep 4 07:16:56.199: //PRESENCE:[17]:/presence_asnl_notify_body_handler:*Sep 4 07:16:56.199: //PRESENCE:[24]:/presence_get_node_by_subid:*Sep 4 07:16:56.199: //PRESENCE:[24]:/presence_handle_line_update:*Sep 4 07:16:56.199: //PRESENCE:[24]:/presence_get_sccp_status:*Sep 4 07:16:56.199: //PRESENCE:[24]:/presence_asnl_notify_body_handler:*Sep 4 07:16:56.199: //PRESENCE:[240]:/presence_get_node_by_subid:*Sep 4 07:16:56.199: //PRESENCE:[240]:/presence_handle_line_update:*Sep 4 07:16:56.199: //PRESENCE:[240]:/presence_get_sccp_status:*Sep 4 07:16:56.199: //PRESENCE:[240]:/presence_asnl_notify_body_handler:*Sep 4 07:16:56.199: //PRESENCE:[766]:/presence_get_node_by_subid:*Sep 4 07:16:56.203: //PRESENCE:[766]:/presence_handle_line_update:*Sep 4 07:16:56.203: //PRESENCE:[766]:/presence_get_sccp_status:*Sep 4 07:16:56.203: //PRESENCE:[766]:/presence_asnl_notify_body_handler:*Sep 4 07:16:59.743: //PRESENCE:[17]:/presence_line_update:*Sep 4 07:16:59.743: //PRESENCE:[24]:/presence_line_update:*Sep 4 07:16:59.743: //PRESENCE:[240]:/presence_line_update:*Sep 4 07:16:59.743: //PRESENCE:[766]:/presence_line_update:The following example shows output from the debug presence trace command:
Router# debug presence trace*Sep 4 07:17:17.351: //PRESENCE:[17]:/presence_xml_encode:*Sep 4 07:17:17.355: //PRESENCE:[17]:/xml_encode_presence: keyword = presence*Sep 4 07:17:17.355: //PRESENCE:[17]:/xml_encode_person: keyword = person*Sep 4 07:17:17.355: //PRESENCE:[17]:/xml_encode_generic: keyword = Closed*Sep 4 07:17:17.355: //PRESENCE:[17]:/xml_encode_activities: keyword = activities*Sep 4 07:17:17.355: //PRESENCE:[17]:/xml_encode_otp: keyword = On-the-phone*Sep 4 07:17:17.355: //PRESENCE:[17]:/xml_encode_tuple: keyword = tuple*Sep 4 07:17:17.355: //PRESENCE:[17]:/xml_encode_status: keyword = status*Sep 4 07:17:17.355: //PRESENCE:[17]:/xml_encode_generic: keyword = Closed*Sep 4 07:17:17.355: //PRESENCE:[17]:/xml_encode_otp: keyword = On-the-phone*Sep 4 07:17:17.355: <?xml version="1.0" encoding="UTF-8"?><presence xmlns="urn:ietf:params:xml:ns:pidf" entity="sip:6003@1.4.171.34" xmlns:e="urn:ietf:params:xml:ns:pidf:status:rpid" xmlns:dm="urn:ietf:params:xml:ns:pidf:data-model"><dm:person><status><basic>Closed</basic></status><e:activities><e:on-the-phone/></e:activities></dm:person><tuple id="cisco-cme"><status><basic>Closed</basic><e:activities><e:on-the-phone/></e:activities></status></tuple></presence>Related Commands
debug priority
To display priority queueing output, use the debug priority command in privileged EXEC mode. To disable debugging output, use the no form of this command.
debug priority
no debug priority
Syntax Description
This command has no arguments or keywords.
Command Modes
Privileged EXEC
Examples
The following example shows how to enable priority queueing output:
Router# debug priorityPriority output queueing debugging is onThe following is sample output from the debug priority command when the Frame Relay PVC Interface Priority Queueing (FR PIPQ) feature is configured on serial interface 0:
Router# debug priority00:49:05:PQ:Serial0 dlci 100 -> high00:49:05:PQ:Serial0 output (Pk size/Q 24/0)00:49:05:PQ:Serial0 dlci 100 -> high00:49:05:PQ:Serial0 output (Pk size/Q 24/0)00:49:05:PQ:Serial0 dlci 100 -> high00:49:05:PQ:Serial0 output (Pk size/Q 24/0)00:49:05:PQ:Serial0 dlci 200 -> medium00:49:05:PQ:Serial0 output (Pk size/Q 24/1)00:49:05:PQ:Serial0 dlci 300 -> normal00:49:05:PQ:Serial0 output (Pk size/Q 24/2)00:49:05:PQ:Serial0 dlci 400 -> low00:49:05:PQ:Serial0 output (Pk size/Q 24/3)Related Commands
debug proxy h323 statistics
To enable proxy RTP statistics, use the debug proxy h323 statistics command in privileged EXEC mode. To disable debugging output, use the no form of this command.
debug proxy h323 statistics
no debug proxy h323 statistics
Syntax Description
This command has no arguments or keywords.
Command Modes
Privileged EXEC
Command History
Usage Guidelines
Enter the show proxy h323 detail-call EXEC command to see the statistics.
debug pvcd
To display the permanent virtual circuit (PVC) Discovery events and Interim Local Management Interface (ILMI) MIB traffic used when discovering PVCs, use the debug pvcd command in privileged EXEC mode. To disable debugging output, use the no form of this command.
debug pvcd
no debug pvcd
Syntax Description
This command has no arguments or keywords.
Command Modes
Privileged EXEC
Usage Guidelines
This command is primarily used by Cisco technical support representatives.
Examples
The following is sample output from the debug pvcd command:
Router# debug pvcdPVCD: PVCD enabled w/ SubifPVCD(2/0): clearing event queuePVCD: 2/0 Forgetting discovered PVCs...PVCD: Removing all dynamic PVCs on 2/0PVCD: Restoring MIXED PVCs w/ default parms on 2/0PVCD: Marking static PVCs as UNKNWN on 2/0PVCD: Marking static PVC 0/50 as UNKNWN on 2/0 ...PVCD: Trying to discover PVCs on 2/0...PVCD: pvcd_discoverPVCsPVCD: pvcd_pingPVCD: fPortEntry.5.0 = 2PVCD: pvcd_getPeerVccTableSizePVCD: fLayerEntry.5.0 = 13PVCD:end allocating VccTable size 13PVCD: pvcd_getPeerVccTablePVCD:******* 2/0: getNext on fVccEntry = NULL TYPE/VALUE numFileds = 19 numVccs = 13PVCD: Creating Dynamic PVC 0/33 on 2/0PVCD(2/0): Before _update_inheritance() and _create_pvc() VC 0/33: DYNAMICPVCD: After _create_pvc() VC 0/33: DYNAMIC0/33 on 2/0 : UBR PCR = -1PVCD: Creating Dynamic PVC 0/34 on 2/0PVCD(2/0): Before _update_inheritance() and _create_pvc() VC 0/34: DYNAMICPVCD: After _create_pvc() VC 0/34: DYNAMIC0/34 on 2/0 : UBR PCR -1PVCD: Creating Dynamic PVC 0/44 on 2/0PVCD(2/0): Before _update_inheritance() and _create_pvc() VC 0/44: DYNAMICPVCD: After _create_pvc() VC 0/44: DYNAMIC0/44 on 2/0 : UBR PCR = -1PVCD: PVC 0/50 with INHERITED_QOSTYPEPVCD: _oi_state_change ( 0/50, 1 = ILMI_VC_UP )PVCD: Creating Dynamic PVC 0/60 on 2/0PVCD(2/0): Before _update_inheritance() and _create_pvc() VC 0/60: DYNAMICPVCD: After _create_pvc() VC 0/60: DYNAMIC0/60 on 2/0 : UBR PCR = -1PVCD: Creating Dynamic PVC 0/80 on 2/0PVCD(2/0): Before _update_inheritance() and _create_pvc() VC 0/80: DYNAMICPVCD: After _create_pvc() VC 0/80: DYNAMIC0/80 on 2/0 : UBR PCR = -1PVCD: Creating Dynamic PVC 0/99 on 2/0debug pvdm2dm
To view contents of packets flowing through PVDMII-xxDM digital modem devices, use the debug pvdm2dm command in privileged EXEC mode. To disable debug activity, use the no form of this command.
debug pvdm2dm packet <modem | pvdm> <slot>/<port | pvdm slot>
no debug pvdm2dm
Syntax Description
packet
Debugs packets
modem
Debugs modem packets
pvdm
Debugs PVDM packets
slot
Router slot for pvdms/modems
port
Modem number
pvdm slot
PVDM number
Command Default
Disabled
Command Modes
Privileged EXEC
Command History
Usage Guidelines
To debug the contents of modem packets for a specific modem, use the following command:
•
By removing the specific modem number at the end, one can enable packet debugging for all the modems available on the router:
•
The following command enables packet debugging for all packets flowing through a particular PVDMII-xxDM device:
•
The following command enables debugging of packets flowing through any PVDMII-xxDM device:
•
The following command enables debugging of packets flowing through any PVDMII-xxDM device and any PVDMII-xxDM-based modem channel:
•
To see what debug flags are set, and to view the contents of debugged packets, use the show debugging command.
Examples
The following example sets debugging for a specific modem. The following show debugging command displays the debug flag that is set, and gives a typical printout for one debugged packet:
Router# debug pvdm2dm packet modem 0/322Router# show debuggingPVDM2 DM:Modem 0/322 packet debugging is onRouter#May 24 17:35:16.318: pvdm2_dm_tx_dsp_pak_common: bay 0, dsp 0 May 24 17:35:16.318: pvdm2_dm_dump_pak_hex: pak: 43E1F6FC size 8 May 24 17:35:16.318: 00 08 00 00 00 1C 00 00 May 24 17:35:16.322:The following example sets debugging for all PVDMII-xxDM modems available on the router.
Router# debug pvdm2dm packetRouter# show debuggingPVDM2 DM:Modem 0/322 packet debugging is onModem 0/323 packet debugging is onModem 0/324 packet debugging is on...Modem 0/355 packet debugging is onModem 0/356 packet debugging is onModem 0/357 packet debugging is onRouter#The following example sets debugging for a particular PVDMII-xxDM device.
Router# debug pvdm2dm packet pvdm 0/0Router# show debuggingPVDM2 DM:PVDM2 0/0 packet debugging is onRouter#The following example sets debugging for all PVDMII-xxDM devices in the router.
Router# debug pvdm2dm packet pvdmRouter# show debuggingPVDM2 DM:PVDM2 0/0 packet debugging is onPVDM2 0/1 packet debugging is onPVDM2 0/2 packet debugging is onRouter#In all of these examples, the output describing the debugged packets is similar to that of the first example, except that the packet contents will vary.
Related Commands
show debugging
Displays information about the type of debugging enabled for your router.
debug pxf tbridge
To enable debugging of parallel express forwarding (PXF) transparent bridging, use the debug pxf tbridge command in privileged EXEC mode. To disable the debugging, use the no form of this command.
debug pxf tbridge
no debug pxf tbridge
Syntax Description
This command has no arguments or keywords.
Command Modes
Privileged EXEC
Command History
Examples
The following example shows that BVI100 has been removed from the Software Mac-address Filter (SMF) table:
Router# debug pxf tbridge*Feb 8 18:39:04.710: rpmxf_tbridge_add_remove_bvi_from_smf: Deleting BVI entry 100 from SMF table.*Feb 8 18:39:04.710: rpmxf_tbridge_add_remove_bvi_from_smf: BVI 100 ICM programming*Feb 8 18:39:04.710: rpmxf_tbridge_add_remove_bvi_from_smf: Successfully removed SMF entry for bvi 100*Feb 8 18:39:04.710: rpmxf_tbridge_add_remove_bvi_from_smf: Deleting BVI entry 100 from SMF table.*Feb 8 18:39:04.710: rpmxf_tbridge_add_remove_bvi_from_smf: BVI 100 ICM programming*Feb 8 18:39:04.710: rpmxf_tbridge_add_remove_bvi_from_smf: Successfully removed SMF entry for bvi 100*Feb 8 18:39:05.178: %SYS-5-CONFIG_I: Configured from console by vty0(CROI_MASTER_000A004B)*Feb 8 18:39:06.710: %LINK-5-CHANGED: Interface BVI100, changed state to administratively down*Feb 8 18:39:07.710:%LINEPROTO-5-UPDOWN: Line protocol on Interface BVI100, changed state to downThe following example shows that BVI is configured and that the SMF entry has been updated:
Router# debug pxf tbridge*Feb 8 18:39:16.398:Note: A random mac address of 0000.0ceb.c0f8 has been chosen for BVI in bridge group 100 since there is no mac address associated with the selected interface.*Feb 8 18:39:16.398: Ensure that this address is unique.*Feb 8 18:39:16.398: rpmxf_tbridge_smf_update: SMF update for Switch1.1: BVI 100 Mac Address 0000.0ceb.c0f8*Feb 8 18:39:16.398: rpmxf_tbridge_smf_update: BVI 100 ICM programming*Feb 8 18:39:16.398: rpmxf_tbridge_smf_update: Successfully updated SMF entry for bvi 100*Feb 8 18:39:16.398: rpmxf_tbridge_smf_update: SMF update for Switch1.1:BVI 100 Mac Address 0000.0ceb.c0f8*Feb 8 18:39:16.398: rpmxf_tbridge_smf_update: BVI 100 ICM programming*Feb 8 18:39:16.398: rpmxf_tbridge_smf_update: Successfully updated SMF entry for bvi 100*Feb 8 18:39:16.886: %SYS-5-CONFIG_I: Configured from console by vty0(CROI_MASTER_000A004B)*Feb 8 18:39:18.394: %LINK-3-UPDOWN: Interface BVI100, changed state to up*Feb 8 18:39:19.394: %LINEPROTO-5-UPDOWN: Line protocol on Interface BVI100, changed state to upRelated Commands
debug qllc error
To display quality link line control (QLLC) errors, use the debug qllc error command in privileged EXEC mode. To disable debugging output, use the no form of this command.
debug qllc error
no debug qllc error
Syntax Description
This command has no arguments or keywords.
Command Modes
Privileged EXEC
Usage Guidelines
This command helps you track down errors in the QLLC interactions with X.25 networks. Use the debug qllc error command in conjunction with the debug x25 all command to see the connection. The data shown by this command only flows through the router on the X.25 connection. Some forms of this command can generate a substantial amount of output and network traffic.
Examples
The following is sample output from the debug qllc error command:
Router# debug qllc error%QLLC-3-GENERRMSG: qllc_close - bad qllc pointer Caller 00407116 Caller 00400BD2QLLC 4000.1111.0002: NO X.25 connection. Discarding XID and calling outThe following line indicates that the QLLC connection was closed:
%QLLC-3-GENERRMSG: qllc_close - bad qllc pointer Caller 00407116 Caller 00400BD2The following line shows the virtual MAC address of the failed connection:
QLLC 4000.1111.0002: NO X.25 connection. Discarding XID and calling outdebug qllc event
To enable debugging of quality link line control (QLLC) events, use the debug qllc event command in privileged EXEC mode. To disable debugging output, use the no form of this command.
debug qllc event
no debug qllc event
Syntax Description
This command has no arguments or keywords.
Command Modes
Privileged EXEC
Usage Guidelines
Use the debug qllc event command to display primitives that might affect the state of a QLLC connection. An example of these events is the allocation of a QLLC structure for a logical channel indicator when an X.25 call has been accepted with the QLLC call user data. Other examples are the receipt and transmission of LAN explorer and exchange identification (XID) frames.
Examples
The following is sample output from the debug qllc event command:
Router# debug qllc eventQLLC: allocating new qllc lci 9QLLC: tx POLLING TEST, da 4001.3745.1088, sa 4000.1111.0001QLLC: rx explorer response, da 4000.1111.0001, sa c001.3745.1088, rif 08B0.1A91.1901.A040QLLC: gen NULL XID, da c001.3745.1088, sa 4000.1111.0001, rif 0830.1A91.1901.A040, dsap 4, ssap 4QLLC: rx XID response, da 4000.1111.0001, sa c001.3745.1088, rif 08B0.1A91.1901.A040The following line indicates that a new QLLC data structure has been allocated:
QLLC: allocating new qllc lci 9The following lines show transmission and receipt of LAN explorer or test frames:
QLLC: tx POLLING TEST, da 4001.3745.1088, sa 4000.1111.0001QLLC: rx explorer response, da 4000.1111.0001, sa c001.3745.1088, rif 08B0.1A91.1901.A040The following lines show XID events:
QLLC: gen NULL XID, da c001.3745.1088, sa 4000.1111.0001, rif 0830.1A91.1901.A040, dsap 4,
ssap 4
QLLC: rx XID response, da 4000.1111.0001, sa c001.3745.1088, rif 08B0.1A91.1901.A040debug qllc packet
To display quality link line control (QLLC) events and QLLC data packets, use the debug qllc packet command in privileged EXEC mode. To disable debugging output, use the no form of this command.
debug qllc packet
no debug qllc packet
Syntax Description
This command has no arguments or keywords.
Command Modes
Privileged EXEC
Usage Guidelines
This command helps you to track down errors in the QLLC interactions with X.25 networks. The data shown by this command only flows through the router on the X25 connection. Use the debug qllc packet command in conjunction with the debug x25 all command to see the connection and the data that flows through the router.
Examples
The following is sample output from the debug qllc packet command:
Router# debug qllc packet14:38:05: Serial2/5 QLLC I: Data Packet.-RSP 9 bytes.14:38:07: Serial2/6 QLLC I: Data Packet.-RSP 112 bytes.14:38:07: Serial2/6 QLLC O: Data Packet. 128 bytes.14:38:08: Serial2/6 QLLC I: Data Packet.-RSP 9 bytes.14:38:08: Serial2/6 QLLC I: Data Packet.-RSP 112 bytes.14:38:08: Serial2/6 QLLC O: Data Packet. 128 bytes.14:38:08: Serial2/6 QLLC I: Data Packet.-RSP 9 bytes.14:38:12: Serial2/5 QLLC I: Data Packet.-RSP 112 bytes.14:38:12: Serial2/5 QLLC O: Data Packet. 128 bytes.The following lines indicate that a packet was received on the interfaces:
14:38:05: Serial2/5 QLLC I: Data Packet.-RSP 9 bytes.14:38:07: Serial2/6 QLLC I: Data Packet.-RSP 112 bytes.The following lines show that a packet was sent on the interfaces:
14:38:07: Serial2/6 QLLC O: Data Packet. 128 bytes.14:38:12: Serial2/5 QLLC O: Data Packet. 128 bytes.debug qllc state
To enable debugging of quality link line control (QLLC) events, use the debug qllc state command in privileged EXEC mode. To disable debugging output, use the no form of this command.
debug qllc state
no debug qllc state
Syntax Description
This command has no arguments or keywords.
Command Modes
Privileged EXEC
Usage Guidelines
Use the debug qllc state command to show when the state of a QLLC connection has changed. The typical QLLC connection goes from states ADM to SETUP to NORMAL. The NORMAL state indicates that a QLLC connection exists and is ready for data transfer.
Examples
The following is sample output from the debug qllc state command:
Router# debug qllc stateSerial2 QLLC O: QSM-CMDSerial2: X25 O D1 DATA (5) Q 8 lci 9 PS 4 PR 3QLLC: state ADM -> SETUPSerial2: X25 I D1 RR (3) 8 lci 9 PR 5Serial2: X25 I D1 DATA (5) Q 8 lci 9 PS 3 PR 5Serial2 QLLC I: QUA-RSPQLLC: addr 00, ctl 73QLLC: qsetupstate: recvd qua rspQLLC: state SETUP -> NORMALThe following line indicates that a QLLC connection attempt is changing state from ADM to SETUP:
QLLC: state ADM -> SETUPThe following line indicates that a QLLC connection attempt is changing state from SETUP to NORMAL:
QLLC: state SETUP -> NORMALdebug qllc timer
To display quality link line control (QLLC) timer events, use the debug qllc timer command in privileged EXEC mode. To disable debugging output, use the no form of this command.
debug qllc timer
no debug qllc timer
Syntax Description
This command has no arguments or keywords.
Command Modes
Privileged EXEC
Usage Guidelines
The QLLC process periodically cycles and checks status of itself and its partner. If the partner is not found in the desired state, an LAPB primitive command is re-sent until the partner is in the desired state or the timer expires.
Examples
The following is sample output from the debug qllc timer command:
Router# debug qllc timer14:27:24: Qllc timer lci 257, state ADM retry count 0 Caller 00407116 Caller 00400BD214:27:34: Qllc timer lci 257, state NORMAL retry count 014:27:44: Qllc timer lci 257, state NORMAL retry count 114:27:54: Qllc timer lci 257, state NORMAL retry count 1The following line of output shows the state of a QLLC partner on a given X.25 logical channel identifier:
14:27:24: Qllc timer lci 257, state ADM retry count 0 Caller 00407116 Caller 00400BD2Other messages are informational and appear every ten seconds.
debug qllc x25
To display X.25 packets that affect a quality link line control (QLLC) connection, use the debug qllc x25 command in privileged EXEC mode. To disable debugging output, use the no form of this command.
debug qllc x25
no debug qllc x25
Syntax Description
This command has no arguments or keywords.
Command Modes
Privileged EXEC
Usage Guidelines
This command is helpful to track down errors in the QLLC interactions with X.25 networks. Use the debug qllc x25 command in conjunction with the debug x25 events or debug x25 all commands to see the X.25 events between the router and its partner.
Examples
The following is sample output from the debug qllc x25 command:
Router# debug qllc x2515:07:23: QLLC X25 notify lci 257 event 115:07:23: QLLC X25 notify lci 257 event 515:07:34: QLLC X25 notify lci 257 event 3 Caller 00407116 Caller 00400BD215:07:35: QLLC X25 notify lci 257 event 4Table 278 describes the significant fields shown in the display.
debug qos ha
To debug Quality of Service (QoS) information on the networking device, use the debug qos ha command in privileged EXEC mode. To disable the display of debugging output, use the no form of this command.
debug qos ha [detail]
no debug qos ha [detail]
Syntax Description
Command Modes
Privileged EXEC
Command History
Usage Guidelines
Use to determine that QoS in running properly on your networking device.
Examples
The following example enables QoS debugging:
Router# debug qos hadebug radius
To display information associated with RADIUS, use the debug radius command in privileged EXEC mode. To disable debugging output, use the no form of this command.
debug radius [brief | hex]
no debug radius [brief | hex]
Syntax Description
brief
(Optional) Displays abbreviated debug output.
hex
(Optional) Displays debugging output in hexadecimal notation.
Defaults
Debugging output in ASCII format is enabled.
Command Modes
Privileged EXEC
Command History
11.2(1)T
This command was introduced.
12.2(11)T
The brief and hex keywords were added. The default output format became ASCII rather than hexadecimal.
Usage Guidelines
RADIUS is a distributed security system that secures networks against unauthorized access. Cisco supports RADIUS under the authentication, authorization, and accounting (AAA) security system. When RADIUS is used on the router, you can use the debug radius command to display detailed debugging and troubleshooting information in ASCII format. Use the debug radius brief command for abbreviated output displaying client/server interaction and minimum packet information. Use the debug radius hex command to display packet dump information that has not been truncated in hex format.
Examples
The following is sample output from the debug radius command:
Router# debug radiusRadius protocol debugging is onRadius packet hex dump debugging is offRouter#00:02:50: RADIUS: ustruct sharecount=300:02:50: Radius: radius_port_info() success=0 radius_nas_port=100:02:50: RADIUS: Initial Transmit ISDN 0:D:23 id 0 10.0.0.1:1824, Accounting-Request, len 35800:02:50: RADIUS: NAS-IP-Address [4] 6 10.0.0.000:02:50: RADIUS: Vendor, Cisco [26] 19 VT=02 TL=13 ISDN 0:D:2300:02:50: RADIUS: NAS-Port-Type [61] 6 Async00:02:50: RADIUS: User-Name [1] 12 "4085554206"00:02:50: RADIUS: Called-Station-Id [30] 7 "52981"00:02:50: RADIUS: Calling-Station-Id [31] 12 "4085554206"00:02:50: RADIUS: Acct-Status-Type [40] 6 Start00:02:50: RADIUS: Service-Type [6] 6 Login00:02:50: RADIUS: Vendor, Cisco [26] 27 VT=33 TL=21 h323-gw-id=5300_43.00:02:50: RADIUS: Vendor, Cisco [26] 55 VT=01 TL=49 h323-incoming-conf-id=8F3A3163 B4980003 0 29BD000:02:50: RADIUS: Vendor, Cisco [26] 31 VT=26 TL=25 h323-call-origin=answer00:02:50: RADIUS: Vendor, Cisco [26] 32 VT=27 TL=26 h323-call-type=Telephony00:02:50: RADIUS: Vendor, Cisco [26] 57 VT=25 TL=51 h323-setup-time=*16:02:48.681 PST Fri Dec 31 199900:02:50: RADIUS: Vendor, Cisco [26] 46 VT=24 TL=40 h323-conf-id=8F3A3163 B4980003 0 29BD000:02:50: RADIUS: Acct-Session-Id [44] 10 "00000002"00:02:50: RADIUS: Delay-Time [41] 6 000:02:51: RADIUS: Received from id 0 1.7.157.1:1824, Accounting-response, len 2000:02:51: %ISDN-6-CONNECT: Interface Serial0:22 is now connected to 408527420600:03:01: RADIUS: ustruct sharecount=300:03:01: Radius: radius_port_info() success=0 radius_nas_port=100:03:01: RADIUS: Initial Transmit ISDN 0:D:23 id 1 1.7.157.1:1823, Access-Request, len 17100:03:01: RADIUS: NAS-IP-Address [4] 6 10.0.0.000:03:01: RADIUS: Vendor, Cisco [26] 19 VT=02 TL=13 ISDN 0:D:2300:03:01: RADIUS: NAS-Port-Type [61] 6 Async00:03:01: RADIUS: User-Name [1] 8 "123456"00:03:01: RADIUS: Vendor, Cisco [26] 46 VT=24 TL=40 h323-conf-id=8F3A3163 B4980003 0 29BD000:03:01: RADIUS: Calling-Station-Id [31] 12 "4085554206"00:03:01: RADIUS: User-Password [2] 18 *00:03:01: RADIUS: Vendor, Cisco [26] 36 VT=01 TL=30 h323-ivr-out=transactionID:000:03:01: RADIUS: Received from id 1 1.7.157.1:1823, Access-Accept, len 11500:03:01: RADIUS: Service-Type [6] 6 Login00:03:01: RADIUS: Vendor, Cisco [26] 29 VT=101 TL=23 h323-credit-amount=4500:03:01: RADIUS: Vendor, Cisco [26] 27 VT=102 TL=21 h323-credit-time=3300:03:01: RADIUS: Vendor, Cisco [26] 26 VT=103 TL=20 h323-return-code=000:03:01: RADIUS: Class [25] 7 6C6F63616C00:03:01: RADIUS: saved authorization data for user 62321E14 at 6233D25800:03:13: %ISDN-6-DISCONNECT: Interface Serial0:22 disconnected from 4085274206, call lasted 22 seconds00:03:13: RADIUS: ustruct sharecount=200:03:13: Radius: radius_port_info() success=0 radius_nas_port=100:03:13: RADIUS: Sent class "local" at 6233D2C4 from user 62321E1400:03:13: RADIUS: Initial Transmit ISDN 0:D:23 id 2 1.7.157.1:1824, Accounting-Request, len 77500:03:13: RADIUS: NAS-IP-Address [4] 6 10.0.0.000:03:13: RADIUS: Vendor, Cisco [26] 19 VT=02 TL=13 ISDN 0:D:2300:03:13: RADIUS: NAS-Port-Type [61] 6 Async00:03:13: RADIUS: User-Name [1] 8 "123456"00:03:13: RADIUS: Called-Station-Id [30] 7 "52981"00:03:13: RADIUS: Calling-Station-Id [31] 12 "4085274206"00:03:13: RADIUS: Acct-Status-Type [40] 6 Stop00:03:13: RADIUS: Class [25] 7 6C6F63616C00:03:13: RADIUS: Undebuggable [45] 6 0000000100:03:13: RADIUS: Service-Type [6] 6 Login00:03:13: RADIUS: Vendor, Cisco [26] 27 VT=33 TL=21 h323-gw-id=5300_43.00:03:13: RADIUS: Vendor, Cisco [26] 55 VT=01 TL=49 h323-incoming-conf-id=8F3A3163 B4980003 0 29BD000:03:13: RADIUS: Vendor, Cisco [26] 31 VT=26 TL=25 h323-call-origin=answer00:03:13: RADIUS: Vendor, Cisco [26] 32 VT=27 TL=26 h323-call-type=Telephony00:03:13: RADIUS: Vendor, Cisco [26] 57 VT=25 TL=51 h323-setup-time=*16:02:48.681 PST Fri Dec 31 199900:03:13: RADIUS: Vendor, Cisco [26] 59 VT=28 TL=53 h323-connect-time=*16:02:48.946 PST Fri Dec 31 199900:03:13: RADIUS: Vendor, Cisco [26] 62 VT=29 TL=56in=000:03:13: RADIUS: Vendor, Cisco [26] 23 VT=01 TL=17 pre-bytes-out=000:03:13: RADIUS: Vendor, Cisco [26] 21 VT=01 TL=15 pre-paks-in=000:03:13: RADIUS: Vendor, Cisco [26] 22 VT=01 TL=16 pre-paks-out=000:03:13: RADIUS: Vendor, Cisco [26] 22 VT=01 TL=16 nas-rx-speed=000:03:13: RADIUS: Vendor, Cisco [26] 22 VT=01 TL=16 nas-tx-speed=000:03:13: RADIUS: Delay-Time [41] 6 000:03:13: RADIUS: Received from id 2 1.7.157.1:1824, Accounting-response, len 20h323-disconnect-time=*16:03:11.306 PST Fri Dec 31 199900:03:13: RADIUS: Vendor, Cisco [26] 32 VT=30 TL=26 h323-disconnect-cause=1000:03:13: RADIUS: Vendor, Cisco [26] 28 VT=31 TL=22 h323-voice-quality=000:03:13: RADIUS: Vendor, Cisco [26] 46 VT=24 TL=40 h323-conf-id=8F3A3163 B4980003 0 29BD000:03:13: RADIUS: Acct-Session-Id [44] 10 "00000002"00:03:13: RADIUS: Acct-Input-Octets [42] 6 000:03:13: RADIUS: Acct-Output-Octets [43] 6 8800000:03:13: RADIUS: Acct-Input-Packets [47] 6 000:03:13: RADIUS: Acct-Output-Packets [48] 6 55000:03:13: RADIUS: Acct-Session-Time [46] 6 2200:03:13: RADIUS: Vendor, Cisco [26] 30 VT=01 TL=24 subscriber=RegularLine00:03:13: RADIUS: Vendor, Cisco [26] 35 VT=01 TL=29 h323-ivr-out=Tariff:Unknown00:03:13: RADIUS: Vendor, Cisco [26] 22 VT=01 TL=16 pre-bytes-The following is sample output from the debug radius brief command:
Router# debug radius briefRadius protocol debugging is onRadius packet hex dump debugging is offRadius protocol in brief format debugging is on00:05:21: RADIUS: Initial Transmit ISDN 0:D:23 id 6 10.0.0.1:1824, Accounting-Request, len 35800:05:21: %ISDN-6-CONNECT: Interface Serial0:22 is now connected to 408527420600:05:26: RADIUS: Retransmit id 600:05:31: RADIUS: Tried all servers.00:05:31: RADIUS: No valid server found. Trying any viable server00:05:31: RADIUS: Tried all servers.00:05:31: RADIUS: No response for id 700:05:31: RADIUS: Initial Transmit ISDN 0:D:23 id 8 10.0.0.0:1823, Access-Request, len 17100:05:36: RADIUS: Retransmit id 800:05:36: RADIUS: Received from id 8 1.7.157.1:1823, Access-Accept, len 11500:05:47: %ISDN-6-DISCONNECT: Interface Serial0:22 disconnected from 4085274206, call lasted 26 seconds00:05:47: RADIUS: Initial Transmit ISDN 0:D:23 id 9 10.0.0.1:1824, Accounting-Request, len 77500:05:47: RADIUS: Received from id 9 1.7.157.1:1824, Accounting-response, len 20The following example shows debug radius hex output:
Router# debug radius hexRadius protocol debugging is onRadius packet hex dump debugging is onRouter#17:26:52: RADIUS: ustruct sharecount=317:26:52: Radius: radius_port_info() success=0 radius_nas_port=117:26:52: RADIUS: Initial Transmit ISDN 0:D:23 id 10 10.0.0.1:1824, Accounting-Request, len 36117:26:52: Attribute 4 6 01081D0317:26:52: Attribute 26 19 00000009020D4953444E20303A443A323317:26:52: Attribute 61 6 0000000017:26:52: Attribute 1 12 3430383532373432303617:26:52: Attribute 30 7 353239383117:26:52: Attribute 31 12 3430383532373432303617:26:52: Attribute 40 6 0000000117:26:52: Attribute 6 6 0000000117:26:52: Attribute 26 27 000000092115683332332D67772D69643D353330305F34332E17:26:52: Attribute 26 57 000000090133683332332D696E636F6D696E672D636F6E662D69643D3846334133313633204234393830303046 2030203342453731423817:26:52: Attribute 26 31 000000091A19683332332D63616C6C2D6F726967696E3D616E7377657217:26:52: Attribute 26 32 000000091B1A683332332D63616C6C2D747970653D54656C6570686F6E7917:26:52: Attribute 26 56 000000091932683332332D73657475702D74696D653D2A30393A32363A35322E3838302050535420536174204A 616E2031203230303017:26:52: Attribute 26 48 00000009182A683332332D636F6E662D69643D3846334133313633204234393830303046203020334245373142 3817:26:52: Attribute 44 10 303030303030303517:26:52: Attribute 41 6 0000000017:26:52: %ISDN-6-CONNECT: Interface Serial0:22 is now connected to 408527420617:26:52: RADIUS: Received from id 10 10.0.0.1:1824, Accounting-response, len 2017:27:01: RADIUS: ustruct sharecount=317:27:01: Radius: radius_port_info() success=0 radius_nas_port=117:27:01: RADIUS: Initial Transmit ISDN 0:D:23 id 11 10.0.0.0:1823, Access-Request, len 17317:27:01: Attribute 4 6 01081D0317:27:01: Attribute 26 19 00000009020D4953444E20303A443A323317:27:01: Attribute 61 6 0000000017:27:01: Attribute 1 8 31323334353617:27:01: Attribute 26 48 00000009182A683332332D636F6E662D69643D3846334133313633204234393830303046203020334245373142 3817:27:01: Attribute 31 12 3430383532373432303617:27:01: Attribute 2 18 C980D8D0E9A061B3D783C61AA6F2721417:27:01: Attribute 26 36 00000009011E683332332D6976722D6F75743D7472616E73616374696F6E49443A3317:27:01: RADIUS: Received from id 11 1.7.157.1:1823, Access-Accept, len 11517:27:01: Attribute 6 6 0000000117:27:01: Attribute 26 29 000000096517683332332D6372656469742D616D6F756E743D343517:27:01: Attribute 26 27 000000096615683332332D6372656469742D74696D653D333317:27:01: Attribute 26 26 000000096714683332332D72657475726E2D636F64653D3017:27:01: Attribute 25 7 6C6F63616C17:27:01: RADIUS: saved authorization data for user 61AA0698 at 6215087C17:27:09: %ISDN-6-DISCONNECT: Interface Serial0:22 disconnected from 4085554206, call lasted 17 seconds17:27:09: RADIUS: ustruct sharecount=217:27:09: Radius: radius_port_info() success=0 radius_nas_port=117:27:09: RADIUS: Sent class "local" at 621508E8 from user 61AA069817:27:09: RADIUS: Initial Transmit ISDN 0:D:23 id 12 1.7.157.1:1824, Accounting-Request, len 77617:27:09: Attribute 4 6 01081D0317:27:09: Attribute 26 19 00000009020D4953444E20303A443A323317:27:09: Attribute 61 6 0000000017:27:09: Attribute 1 8 31323334353617:27:09: Attribute 30 7 353239383117:27:09: Attribute 31 12 3430383532373432303617:27:09: Attribute 40 6 0000000217:27:09: Attribute 25 7 6C6F63616C17:27:09: Attribute 45 6 0000000117:27:09: Attribute 6 6 0000000117:27:09: Attribute 26 27 000000092115683332332D67772D69643D353330305F34332E17:27:09: Attribute 26 57 000000090133683332332D696E636F6D696E672D636F6E662D69643D3846334133313633204234393830303046 2030203342453731423817:27:09: Attribute 26 31 000000091A19683332332D63616C6C2D6F726967696E3D616E7377657217:27:09: Attribute 26 32 000000091B1A683332332D63616C6C2D747970653D54656C6570686F6E7917:27:09: Attribute 26 56 000000091932683332332D73657475702D74696D653D2A30393A32363A35322E3838302050535420536174204A 616E2031203230303017:27:09: Attribute 26 58 000000091C34683332332D636F6E6E6563742D74696D653D2A30393A32363A35322E3930372050535420536174 204A616E2031203230303017:27:09: Attribute 26 61 000000091D37683332332D646973636F6E6E6563742D74696D653D2A30393A32373A31302E3133372050535420 536174204A616E2031203230303017:27:09: Attribute 26 32 000000091E1A683332332D646973636F6E6E6563742D63617573653D313017:27:09: Attribute 26 28 000000091F16683332332D766F6963652D7175616C6974793D3017:27:09: Attribute 26 48 00000009182A683332332D636F6E662D69643D3846334133313633204234393830303046203020334245373142 3817:27:09: Attribute 44 10 303030303030303517:27:09: Attribute 42 6 0000000017:27:09: Attribute 43 6 00012CA017:27:09: Attribute 47 6 0000000017:27:09: Attribute 48 6 000001E117:27:09: Attribute 46 6 0000001117:27:09: Attribute 26 30 000000090118737562736372696265723D526567756C61724C696E6517:27:09: Attribute 26 35 00000009011D683332332D6976722D6F75743D5461726966663A556E6B6E6F776E17:27:09: Attribute 26 22 0000000901107072652D62797465732D696E3D3017:27:09: Attribute 26 23 0000000901117072652D62797465732D6F75743D3017:27:09: Attribute 26 21 00000009010F7072652D70616B732D696E3D3017:27:09: Attribute 26 22 0000000901107072652D70616B732D6F75743D3017:27:09: Attribute 26 22 0000000901106E61732D72782D73706565643D3017:27:09: Attribute 26 22 0000000901106E61732D74782D73706565643D3017:27:09: Attribute 41 6 0000000017:27:09: RADIUS: Received from id 12 10.0.0.1:1824, Accounting-response, len 20Related Commands
debug aaa accounting
Displays information on accountable events as they occur.
debug aaa authentication
Displays information on AAA/TACACS+ authentication.
debug radius accounting
To enable debugging of RADIUS accounting collection, use the debug radius accounting command in privileged EXEC mode. To disable the debugging, use the no form of this command.
debug radius accounting
no debug radius accounting
Syntax Description
This command has no arguments or keywords.
Command Modes
Privileged EXEC
Command History
Examples
The following example enables debugging of RADIUS accounting collection:
Router# debug radius accountingRadius protocol debugging is onRadius protocol brief debugging is offRadius protocol verbose debugging is offRadius packet hex dump debugging is offRadius packet protocol (authentication) debugging is offRadius packet protocol (accounting) debugging is onRadius packet retransmission debugging is offRadius server fail-over debugging is offRadius elog debugging is offRelated Commands
debug event-manager
Enables debugging of the event manager.
debug voice statistics
Enables debugging of voice statistics.
debug radius local-server
To control the display of debug messages for the local authentication server, use the debug radius local-server command in privileged EXEC mode.
debug radius local-server {packets | error | client}
Syntax Description
Defaults
No default behavior or values
Command Modes
Privileged EXEC
Command History
Related Commands
debug ras
To display the types and addressing of Registration, Admission and Status (RAS) messages sent and received, use the debug ras command in privileged EXEC mode. To disable debugging output, use the no form of this command.
debug ras
no debug ras
Syntax Description
This command has arguments or keywords.
Defaults
This command is disabled.
Command Modes
Privileged EXEC
Command History
Usage Guidelines
Use the debug ras command to display the types and addressing of RAS messages sent and received. The debug output lists the message type using mnemonics defined in International Telecommunications Union-Telecommunication (ITU-T) specification H.225.
Examples
In the following output, gateway GW13.cisco.com sends a RAS registration request (RRQ) message to gatekeeper GK15.cisco.com at IP address 10.9.53.15. GW13.cisco.com then receives a registration confirmation (RCF) message from the gatekeeper. If there is no response, it could mean that the gatekeeper is offline or improperly addressed. If you receive a reject (RRJ) message, it could mean that the gatekeeper is unable to handle another gateway or that the registration information is incorrect.
Router# debug ras*Mar 13 19:53:34.231: RASlib::ras_sendto:msg length 105 from10.9.53.13:8658 to 10.9.53.15:1719*Mar 13 19:53:34.231: RASLib::RASSendRRQ:RRQ (seq# 36939) sentto 10.9.53.15*Mar 13 19:53:34.247: RASLib::RASRecvData:successfully rcvdmessage of length 105 from 10.9.53.15:1719*Mar 13 19:53:34.251: RASLib::RASRecvData:RCF (seq# 36939) rcvdfrom [10.9.53.15:1719] on sock [0x6168356C]debug redundancy
To enable the display of events for troubleshooting redundant dial shelf controllers (DSCs), use the debug redundancy command in privileged EXEC mode. To disable debugging output, use the no form of this command.
debug redundancy {all | ui | clk | hub}
no debug redundancy {all | ui | clk | hub}
Syntax Description
Defaults
The command is disabled.
Command Modes
Privileged EXEC
Command History
Usage Guidelines
This command is issued from the router shelf console.
Examples
The output from this command consists of event announcements that can be used by authorized troubleshooting personnel.
![]()
![]()
![]()
![]()
![]()
![]()
![]()
![]()
Posted: Mon Jul 2 06:46:01 PDT 2007
All contents are Copyright © 1992--2007 Cisco Systems, Inc. All rights reserved.
Important Notices and Privacy Statement.