|
|

Table Of Contents
debug ip ospf database-timer rate-limit
debug ip ospf mpls traffic-eng advertisements
debug ip rtp header-compression
debug ip msdp
To debug Multicast Source Discovery Protocol (MSDP) activity, use the debug ip msdp command in privileged EXEC mode. To disable debugging output, use the no form of this command.
debug ip msdp [vrf vrf-name] [peer-address | name] [detail] [routes]
no debug ip msdp [vrf vrf-name] [peer-address | name] [detail] [routes]
Syntax Description
Defaults
No default behavior or values
Command Modes
Privileged EXEC
Command History
Examples
The following is sample output from the debug ip msdp command:
Router# debug ip msdpMSDP debugging is onRouter#MSDP: 224.150.44.254: Received 1388-byte message from peerMSDP: 224.150.44.254: SA TLV, len: 1388, ec: 115, RP: 172.31.3.92MSDP: 224.150.44.254: Peer RPF check passed for 172.31.3.92, used EMBGP peerMSDP: 224.150.44.250: Forward 1388-byte SA to peerMSDP: 224.150.44.254: Received 1028-byte message from peerMSDP: 224.150.44.254: SA TLV, len: 1028, ec: 85, RP: 172.31.3.92MSDP: 224.150.44.254: Peer RPF check passed for 172.31.3.92, used EMBGP peerMSDP: 224.150.44.250: Forward 1028-byte SA to peerMSDP: 224.150.44.254: Received 1388-byte message from peerMSDP: 224.150.44.254: SA TLV, len: 1388, ec: 115, RP: 172.31.3.111MSDP: 224.150.44.254: Peer RPF check passed for 172.31.3.111, used EMBGP peerMSDP: 224.150.44.250: Forward 1388-byte SA to peerMSDP: 224.150.44.250: Received 56-byte message from peerMSDP: 224.150.44.250: SA TLV, len: 56, ec: 4, RP: 192.168.76.241MSDP: 224.150.44.250: Peer RPF check passed for 192.168.76.241, used EMBGP peerMSDP: 224.150.44.254: Forward 56-byte SA to peerMSDP: 224.150.44.254: Received 116-byte message from peerMSDP: 224.150.44.254: SA TLV, len: 116, ec: 9, RP: 172.31.3.111MSDP: 224.150.44.254: Peer RPF check passed for 172.31.3.111, used EMBGP peerMSDP: 224.150.44.250: Forward 116-byte SA to peerMSDP: 224.150.44.254: Received 32-byte message from peerMSDP: 224.150.44.254: SA TLV, len: 32, ec: 2, RP: 172.31.3.78MSDP: 224.150.44.254: Peer RPF check passed for 172.31.3.78, used EMBGP peerMSDP: 224.150.44.250: Forward 32-byte SA to peerTable 145 describes the significant fields shown in the display.
Table 145 debug ip msdp Field Descriptions
MSDP
Protocol being debugged.
224.150.44.254:
IP address of the MSDP peer.
Received 1388-byte message from peer
MSDP event.
debug ip msdp resets
To debug Multicast Source Discovery Protocol (MSDP) peer reset reasons, use the debug ip msdp resets command in privileged EXEC mode.
debug ip msdp [vrf vrf-name] resets
Syntax Description
vrf
(Optional) Supports the Multicast Virtual Private Network (VPN) routing and forwarding (VRF) instance.
vrf-name
(Optional) Name assigned to the VRF.
Defaults
No default behavior or values
Command Modes
Privileged EXEC
Command History
debug ip nat
To display information about IP packets translated by the IP Network Address Translation (NAT) feature, use the debug ip nat command in privileged EXEC mode. To disable debugging output, use the no form of this command.
debug ip nat [access-list | detailed | h323 | ipsec | port | pptp | route | sip | skinny | vrf | wlan-nat]
no debug ip nat [access-list | detailed | h323 | ipsec | port | pptp | route | sip | skinny | vrf | wlan-nat]
Syntax Description
Command Modes
Privileged EXEC
Command History
Usage Guidelines
The NAT feature reduces the need for unique, registered IP addresses. It can also save private network administrators from needing to renumber hosts and routers that do not conform to global IP addressing.
Use the debug ip nat command to verify the operation of the NAT feature by displaying information about each packet that the router translates. The debug ip nat detailed command generates a description of each packet considered for translation. This command also displays information about certain errors or exception conditions, such as the failure to allocate a global address. To display messages related to the processing of H.225 signaling and H.245 messages, use the debug ip nat h323 command. To display messages related to the processing of SIP messages, use the debug ip nat sip command. To display messages related to the processing of VRF messages, use the debug ip nat vrf command.
CautionBecause the debug ip nat command generates a substantial amount of output, use it only when traffic on the IP network is low, so other activity on the system is not adversely affected.
Examples
The following is sample output from the debug ip nat command. In this example, the first two lines show the Domain Name System (DNS) request and reply debugging output. The remaining lines show debugging output from a Telnet connection from a host on the inside of the network to a host on the outside of the network. All Telnet packets, except for the first packet, were translated in the fast path, as indicated by the asterisk (*).
Router# debug ip natNAT: s=192.168.1.95->172.31.233.209, d=172.31.2.132 [6825]NAT: s=172.31.2.132, d=172.31.233.209->192.168.1.95 [21852]NAT: s=192.168.1.95->172.31.233.209, d=172.31.1.161 [6826]NAT*: s=172.31.1.161, d=172.31.233.209->192.168.1.95 [23311]NAT*: s=192.168.1.95->172.31.233.209, d=172.31.1.161 [6827]NAT*: s=192.168.1.95->172.31.233.209, d=172.31.1.161 [6828]NAT*: s=172.31.1.161, d=172.31.233.209->192.168.1.95 [23313]NAT*: s=172.31.1.161, d=172.31.233.209->192.168.1.95 [23325]Table 146 describes the significant fields shown in the display.
The following is sample output from the debug ip nat detailed command. In this example, the first two lines show the debugging output produced by a DNS request and reply. The remaining lines show the debugging output from a Telnet connection from a host on the inside of the network to a host on the outside of the network. In this example, the inside host 192.168.1.95 was assigned the global address 172.31.233.193.
Router# debug ip nat detailedNAT: i: udp (192.168.1.95, 1493) -> (172.31.2.132, 53) [22399]NAT: o: udp (172.31.2.132, 53) -> (172.31.233.193, 1493) [63671]NAT*: i: tcp (192.168.1.95, 1135) -> (172.31.2.75, 23) [22400]NAT*: o: tcp (172.31.2.75, 23) -> (172.31.233.193, 1135) [22002]NAT*: i: tcp (192.168.1.95, 1135) -> (172.31.2.75, 23) [22401]NAT*: i: tcp (192.168.1.95, 1135) -> (172.31.2.75, 23) [22402]NAT*: o: tcp (172.31.2.75, 23) -> (172.31.233.193, 1135) [22060]NAT*: o: tcp (172.31.2.75, 23) -> (172.31.233.193, 1135) [22071]The following is sample output from the debug ip nat h323 command. In this example, an H.323 call is established between two hosts, one host on the inside and the other host on the outside. The debugging output displays the H.323 message names that NAT recognizes and the embedded IP addresses contained in those messages.
Router# debug ip nat h323NAT:H225:[0] processing a Setup messageNAT:H225:[0] found Setup sourceCallSignallingNAT:H225:[0] fix transportAddress addr=192.168.122.50 port=11140NAT:H225:[0] found Setup fastStartNAT:H225:[0] Setup fastStart PDU length:18NAT:H245:[0] processing OpenLogicalChannel message, forward channelnumber 1NAT:H245:[0] found OLC forward mediaControlChannelNAT:H245:[0] fix TransportAddress addr=192.168.122.50 port=16517NAT:H225:[0] Setup fastStart PDU length:29NAT:H245:[0] Processing OpenLogicalChannel message, forward channelnumber 1NAT:H245:[0] found OLC reverse mediaChannelNAT:H245:[0] fix Transportaddress addr=192.168.122.50 port=16516NAT:H245:[0] found OLC reverse mediaControlChannelNAT:H245:[0] fix TransportAddress addr=192.168.122.50 port=16517NAT:H225:[1] processing an Alerting messageNAT:H225:[1] found Alerting fastStartNAT:H225:[1] Alerting fastStart PDU length:25NAT:H245:[1] processing OpenLogicalChannel message, forward channelnumber 1NAT:H323:[0] received pak, payload_len=46NAT:H323:[0] processed up to new_payload_len 4NAT:H323:[0] expecting data len=42--payload_len left 42NAT:H323:[0] try to process tpkt with len 42, payload_len left 42NAT:H225:processing a Facility messageNAT:H225:pdu_len :31 msg_IE:28NAT:H323:choice-value:9NAT:H225:[0] found h245TunnelingNAT:H225:[0] found h245ControlNAT:H225:[0] h245control PDU length:20NAT:H245:[0] processing OpenLogicalChannel message, forward channelnumber 2NAT:H245:[0] found OLC forward mediaControlChannelNAT:H245:[0] fix TransportAddress addr=192.168.122.50 port=51001NAT:H245:[0] TransportAddress addr changed 192.168.122.50->135.25.30.129NAT:H245:[0] message changed, encoding backNAT:H245:exit process tpkt with new_len 20NAT:H225:message changed, encoding backNAT:H323:[0] processed up to new_payload_len 46NAT:H323:[0] new pak payload len is 46Table 147 describes the significant fields shown in the display.
The following is sample output from the debug ip nat ipsec command:
Router# debug ip nat ipsec5d21h:NAT:new IKE going In->Out, source addr 192.168.122.35, destination addr 192.168.22.20, initiator cookie0x9C42065D5d21h:NAT:IPSec:created In->Out ESP translation IL=192.168.122.35 SPI=0xAAE32A0A, IG=192.168.22.40, OL=192.168.22.20,OG=192.168.22.205d21h:NAT:IPSec:created Out->In ESP translation OG=192.168.22.20 SPI=0xA64B5BB6, OL=192.168.22.20, IG=192.168.22.40,IL=192.168.122.355d21h:NAT:new IKE going In->Out, source addr 192.168.122.20, destination addr 192.168.22.20, initiator cookie0xC91738FF5d21h:NAT:IPSec:created In->Out ESP translation IL=192.168.122.20 SPI=0x3E2E1B92, IG=192.168.22.40, OL=192.168.22.20,OG=192.168.22.205d21h:NAT:IPSec:Inside host (IL=192.168.122.20) trying to open an ESP connection to Outside host (OG=192.168.22.20),wait for Out->In reply5d21h:NAT:IPSec:created Out->In ESP translation OG=192.168.22.20 SPI=0x1B201366, OL=192.168.22.20, IG=192.168.22.40,IL=192.168.122.20The following is sample output from the debug ip nat sip command. In this example, one IP phone registers with a Cisco SIP proxy and then calls another IP phone. The debugging output displays the SIP messages that NAT recognizes and the embedded IP addresses contained in those messages.
Router# debug ip nat sipNAT:SIP:[0] processing REGISTER messageNAT:SIP:[0] translated embedded address192.168.122.3->10.2.2.2NAT:SIP:[0] translated embedded address192.168.122.3->10.2.2.2NAT:SIP:[0] message body foundNAT:SIP:[0] found address/port in SDP body:192.168.122.2020332NAT:SIP:[1] processing SIP/2.0 100 Trying reply messageNAT:SIP:[1] translated embedded address10.2.2.2->192.168.122.3NAT:SIP:[1] processing SIP/2.0 200 OK reply messageNAT:SIP:[1] translated embedded address10.2.2.2->192.168.122.3NAT:SIP:[1] translated embedded address10.2.2.2->192.168.122.3NAT:SIP:[1] processing INVITE messageNAT:SIP:[1] translated embedded address10.2.2.2->192.168.122.3NAT:SIP:[1] message body foundNAT:SIP:[1] found address/port in SDP body:192.168.22.20Table 148 describes the significant fields shown in the display.
The following is sample output from the debug ip nat vrf command:
Router# debug ip nat vrf6d00h:NAT:address not stolen for 192.168.121.113, proto 1 port 72246d00h:NAT:creating portlist proto 1 globaladdr 10.2.2.106d00h:NAT:Allocated Port for 192.168.121.113 -> 10.2.2.10:wanted 7224 got 72246d00h:NAT:i:icmp (192.168.121.113, 7224) -> (172.31.88.2, 7224) [2460]6d00h:NAT:s=192.168.121.113->10.2.2.10, d=172.31.88.2 [2460] vrf=> shop6d00h:NAT*:o:icmp (172.31.88.2, 7224) -> (10.2.2.10, 7224) [2460] vrf=> shop6d00h:NAT*:s=172.31.88.2, d=10.2.2.10->192.168.121.113 [2460] vrf=> shop6d00h:NAT:Allocated Port for 192.168.121.113 -> 10.2.2.10:wanted 7225 got 72256d00h:NAT:i:icmp (192.168.121.113, 7225) -> (172.31.88.2, 7225) [2461]6d00h:NAT:s=192.168.121.113->10.2.2.10, d=172.31.88.2 [2461] vrf=> shop6d00h:NAT*:o:icmp (172.31.88.2, 7225) -> (10.2.2.10, 7225) [2461] vrf=> shop6d00h:NAT*:s=172.31.88.2, d=10.2.2.10->192.168.121.113 [2461] vrf=> shop6d00h:NAT:Allocated Port for 192.168.121.113 -> 10.2.2.10:wanted 7226 got 72266d00h:NAT:i:icmp (192.168.121.113, 7226) -> (172.31.88.2, 7226) [2462]6d00h:NAT:s=192.168.121.113->10.2.2.10, d=172.31.88.2 [2462] vrf=> shopTable 149 describes the significant fields shown in the display.
The following is sample output from the debug ip nat wlan-nat command:
Router# debug ip nat wlan-natWLAN-NAT: Creating secure ARP entry (10.1.1.1,0010.7bc2.9ff6)WLAN-NAT: Triggered Acct Start for (172.30.1.10,0010.7bc2.9ff6)WLAN-NAT: Extracting addr:172.30.1.10,input_idb:Ethernet1/2 from pakWLAN-NAT: Saving address:172.30.1.10,input_idb:Ethernet1/2 in pakAfter the WLAN-entry times out, the following debugs will be seen:
Router# debug ip nat wlan-natWLAN-NAT: Removing secure arp entry (10.1.1.1,0010.7bc2.9ff6)WLAN-NAT: triggered Acct Stop for (172.30.1.10,0010.7bc2.9ff6)Table 150 describes the significant fields shown in the display.
Table 150 debug ip nat wlan-nat Field Descriptions
WLAN
Indicates that a wireless LAN is being translated.
NAT
Indicates that the packet is being translated using NAT.
Related Commands
debug ip ospf database-timer rate-limit
To display when link-state advertisement (LSA) rate-limiting timers will expire, use the debug ip ospf database-timer rate-limit command in privileged EXEC mode.
debug ip ospf database-timer rate-limit [access-list-number]
Syntax Description
Command Modes
Privileged EXEC
Command History
Usage Guidelines
Use this command if you need to see when the timers will expire per LSA. Use an access list if you want to limit the output.
Examples
The following is sample output from the debug ip ospf database-timer rate-limit command for an example configuration that includes the timers throttle lsa all 100 10000 45000 command. Comments are inserted to explain the preceding output.
Router# debug ip ospf database-timer rate-limitOSPF rate limit timer events debugging is on*Mar 12 20:18:20.383:OSPF:Starting rate limit timer for 10.10.24.410.10.24.4 1 with 100ms delayThe interface is shut down, which causes OSPF to generate a new router LSA. The system starts a timer for 100 milliseconds.
*Mar 12 20:18:20.495:OSPF:Rate limit timer is expired for 10.10.24.410.10.24.4 1The rate limit timer is expired after 100 milliseconds (a small delta is added to the timer).
*Mar 12 20:18:20.495:OSPF:For next LSA generation - wait :10000ms next:20000ms*Mar 12 20:18:20.495:OSPF:Build router LSA for area 24, router ID10.10.24.4, seq 0x80000003The system will generate update a router LSA after the timer expires.
debug ip ospf events
To display information on Open Shortest Path First (OSPF)-related events, such as adjacencies, flooding information, designated router selection, and shortest path first (SPF) calculation, use the debug ip ospf events command in privileged EXEC mode. To disable debugging output, use the no form of this command.
debug ip ospf events
no debug ip ospf events
Syntax Description
This command has no arguments or keywords.
Command Modes
Privileged EXEC
Examples
The following is sample output from the debug ip ospf events command:
Router# debug ip ospf eventsOSPF:hello with invalid timers on interface Ethernet0hello interval received 10 configured 10net mask received 255.255.255.0 configured 255.255.255.0dead interval received 40 configured 30The debug ip ospf events output shown might appear if any of the following situations occurs:
•
•
•
If a router configured for OSPF routing is not seeing an OSPF neighbor on an attached network, perform the following tasks:
•
•
In the following example line, the neighbor and this router are not part of a stub area (that is, one is a part of a transit area and the other is a part of a stub area, as explained in RFC 1247):
OSPF: hello packet with mismatched E bitRelated Commands
debug ip ospf mpls traffic-eng advertisements
To print information about traffic engineering advertisements in Open Shortest Path First (OSPF) link state advertisement (LSA) messages, use the debug ip ospf mpls traffic-eng advertisements command in privileged EXEC mode. To disable debugging output, use the no form of this command.
debug ip ospf mpls traffic-eng advertisements
no debug ip ospf mpls traffic-eng advertisements
Syntax Description
This command has no arguments or keywords
Defaults
No default behavior or values
Command Modes
Privileged EXEC
Command History
Examples
In the following example, information about traffic engineering advertisements is printed in OSPF LSA messages:
Router# debug ip ospf mpls traffic-eng advertisementsOSPF:IGP delete router node 10.106.0.6 fragment 0 with 0 linksTE Router ID 10.106.0.6OSPF:IGP update router node 10.110.0.10 fragment 0 with 0 linksTE Router ID 10.110.0.10OSPF:MPLS announce router node 10.106.0.6 fragment 0 with 1 linksLink connected to Point-to-Point networkLink ID :10.110.0.10Interface Address :10.1.0.6Neighbor Address :10.1.0.10Admin Metric :10Maximum bandwidth :1250000Maximum reservable bandwidth :625000Number of Priority :8Priority 0 :625000 Priority 1 :625000Priority 2 :625000 Priority 3 :625000Priority 4 :625000 Priority 5 :625000Priority 6 :625000 Priority 7 :625000Affinity Bit :0x0Table 151 describes the significant fields shown in the display.
debug ip ospf packet
To display information about each Open Shortest Path First (OSPF) packet received, use the debug ip ospf packet command in privileged EXEC mode. To disable debugging output, use the no form of this command.
debug ip ospf packet
no debug ip ospf packet
Syntax Description
This command has no arguments or keywords.
Command Modes
Privileged EXEC
Examples
The following is sample output from the debug ip ospf packet command:
Router# debug ip ospf packetOSPF: rcv. v:2 t:1 l:48 rid:200.0.0.117aid:0.0.0.0 chk:6AB2 aut:0 auk:The debug ip ospf packet command produces one set of information for each packet received. The output varies slightly depending on which authentication is used. The following is sample output from the debug ip ospf packet command when message digest algorithm 5 (MD5) authentication is used.
Router# debug ip ospf packetOSPF: rcv. v:2 t:1 l:48 rid:192.168.0.116aid:0.0.0.0 chk:0 aut:2 keyid:1 seq:0x0Table 152 describes the significant fields shown in the display.
Related Commands
debug ip http client
Displays information on OSPF-related events, such as adjacencies, flooding information, designated router selection, and SPF calculation.
debug ip ospf rib
To display debugging information for Open Shortest Path First (OSPF) Version 2 routes in the global or local Routing Information Base (RIB), use the debug ip ospf rib command in privileged EXEC mode. To disable the debugging of OSPF Version 2 routes, use the no form of this command.
debug ip ospf rib [local | [redistribution | global [access-list-number]]] [detail]
no debug ip ospf rib [local | [redistribution | global [access-list-number]]] [detail]
Syntax Description
Command Modes
Privileged EXEC (#)
Command History
Usage Guidelines
You can use the output from the debug ip ospf rib command to learn about the function of the local RIB and the interaction between the route redistribution process and the global RIB. For example, you can learn why the routes that OSPF placed in the global RIB are not the same ones that you anticipated.
A Cisco Technical Assistance Center representative may ask you to turn on debugging using the debug ip ospf rib command as part of troubleshooting a problem.
To monitor updates from the OSPF database to the OSPF local RIB, use the local keyword, and to monitor updates from the OSPF database to the OSPF global RIB, use the global keyword.
It is highly recommended that you limit the debugging output to information specific to the IP prefix that is associated with a specific access list by entering the access-list-number argument.
Examples
The following is sample output from the debug ip ospf rib command with the access-list-number argument used in order to limit the debugging output to information specific to the IP prefix that is associated with the specific access list 1:
Router# show running-config | include access-list 1access-list 112 permit 10.1.1.0 0.0.0.255! access-list 1 is configuredRouter# debug ip ospf rib local detail 1*May 31 21:28:17.331: OSPF-RIB-LOCAL: Delete intra-area connectedroute 192.168.130.2/255.255.255.0, area 1, dist 10, for interfaceEthernet0/0.1*May 31 21:28:17.331: OSPF-RIB-LOCAL: Local RIB process OSPF-1Router clear*May 31 21:28:17.331: OSPF-RIB-LOCAL: Add intra-area connectedroute 192.168.130.2/255.255.255.0, area 1, dist 10, for interfaceEthernet0/0.1...debug ip ospf spf statistic
To display statistical information while running the shortest path first (SPF) algorithm, use the debug ip ospf spf statistic command in privileged EXEC mode. To disable the debugging output, use the no form of this command.
debug ip ospf spf statistic
no debug ip ospf spf statistic
Syntax Description
This command has no arguments or keywords.
Command Modes
Privileged EXEC
Command History
Usage Guidelines
The debug ip ospf spf statistic command displays the SPF calculation times in milliseconds, the node count, and a time stamp.
Examples
The following is sample output from the debug ip ospf spf statistic command:
Router# debug ip ospf spf statistic00:05:59: OSPF: Begin SPF at 359.216ms, process time 60ms00:05:59: spf_time 00:05:59.216, wait_interval 0s00:05:59: OSPF: End SPF at 359.216ms, Total elapsed time 0ms00:05:59: Intra: 0ms, Inter: 0ms, External: 0ms00:05:59: R: 4, N: 2, Stubs: 100:05:59: SN: 1, SA: 0, X5: 1, X7: 000:05:59: SPF suspends: 0 intra, 1 totalTable 153 describes the significant fields shown in the display.
debug ip packet
To display general IP debugging information and IP security option (IPSO) security transactions, use the debug ip packet command in privileged EXEC mode. To disable debugging output, use the no form of this command.
debug ip packet [access-list-number] [detail] [dump]
no debug ip packet [access-list-number]
Syntax Description
Command Modes
Privileged EXEC
Usage Guidelines
If a communication session is closing when it should not be, an end-to-end connection problem can be the cause. The debug ip packet command is useful for analyzing the messages traveling between the local and remote hosts. IP packet debugging captures the packets that are process switched including received, generated and forwarded packets. IP packets that are switched in the fast path are not captured.
IPSO security transactions include messages that describe the cause of failure each time a datagram fails a security test in the system. This information is also sent to the sending host when the router configuration allows it.
Caution
Caution
Examples
The following is sample output from the debug ip packet command:
Router# debug ip packetIP packet debugging is onIP: s=172.29.13.44 (Fddi0), d=10.125.254.1 (Serial2), g=172.29.16.2, forwardIP: s=172.29.1.57 (Ethernet4), d=10.36.125.2 (Serial2), g=172.29.16.2, forwardIP: s=172.29.1.6 (Ethernet4), d=255.255.255.255, rcvd 2IP: s=172.29.1.55 (Ethernet4), d=172.29.2.42 (Fddi0), g=172.29.13.6, forwardIP: s=172.29.89.33 (Ethernet2), d=10.130.2.156 (Serial2), g=172.29.16.2, forwardIP: s=172.29.1.27 (Ethernet4), d=172.29.43.126 (Fddi1), g=172.29.23.5, forwardIP: s=172.29.1.27 (Ethernet4), d=172.29.43.126 (Fddi0), g=172.29.13.6, forwardIP: s=172.29.20.32 (Ethernet2), d=255.255.255.255, rcvd 2IP: s=172.29.1.57 (Ethernet4), d=10.36.125.2 (Serial2), g=172.29.16.2, access deniedThe output shows two types of messages that the debug ip packet command can produce; the first line of output describes an IP packet that the router forwards, and the third line of output describes a packet that is destined for the router. In the third line of output, rcvd 2 indicates that the router decided to receive the packet.
Table 154 describes the significant fields shown in the display.
The following is sample output from the debug ip packet command enabled with the detail keyword:
Router# debug ip packet detailIP packet debugging is on (detailed)001556: 19:59:30: CEF: Try to CEF switch 10.4.9.151 from FastEthernet0/0001557: 19:59:30: IP: s=10.4.9.6 (FastEthernet0/0), d=10.4.9.151 (FastEthernet03001558: 19:59:30: TCP src=179, dst=11001, seq=3736598846, ack=2885081910, wH001559: 20:00:09: CEF: Try to CEF switch 10.4.9.151 from FastEthernet0/0001560: 20:00:09: IP: s=10.4.9.4 (FastEthernet0/0), d=10.4.9.151 (FastEthernet03001561: 20:00:09: TCP src=179, dst=11000, seq=163035693, ack=2948141027, wiH001562: 20:00:14: CEF: Try to CEF switch 10.4.9.151 from FastEthernet0/0001563: 20:00:14: IP: s=10.4.9.6 (FastEthernet0/0), d=10.4.9.151 (FastEthernet03001564: 20:00:14: ICMP type=8, code=0001565: 20:00:14: IP: s=10.4.9.151 (local), d=10.4.9.6 (FastEthernet0/0), len 1g001566: 20:00:14: ICMP type=0, code=0The format of the output with detail keyword provides additional information, such as the packet type, code, some field values, and source and destination port numbers.
Table 155 describes the significant fields shown in the display.
The following is sample output from the debug ip packet command enabled with the dump keyword:
Router# debug ip packet dumpIP packet debugging is on (detailed) (dump)21:02:42: IP: s=10.4.9.6 (FastEthernet0/0), d=10.4.9.4 (FastEthernet0/0), len 1307003A00: 0005 00509C08 ...P..07003A10: 0007855B 4DC00800 45000064 001E0000 ...[M@..E..d....07003A20: FE019669 0A040906 0A040904 0800CF7C ~..i..........O|07003A30: 0D052678 00000000 0A0B7145 ABCDABCD ..&x......qE+M+M07003A40: ABCDABCD ABCDABCD ABCDABCD ABCDABCD +M+M+M+M+M+M+M+M07003A50: ABCDABCD ABCDABCD ABCDABCD ABCDABCD +M+M+M+M+M+M+M+M07003A60: ABCDABCD ABCDABCD ABCDABCD ABCDABCD +M+M+M+M+M+M+M+M07003A70: ABCDABCD ABCDABCD ABCDABCD +M+M+M+M+M+M21:02:42: IP: s=10.4.9.4 (local), d=10.4.9.6 (FastEthernet0/0), len 100, sending07003A00: 0005 00509C08 ...P..07003A10: 0007855B 4DC00800 45000064 001E0000 ...[M@..E..d....07003A20: FF019569 0A040904 0A040906 0000D77C ...i..........W|07003A30: 0D052678 00000000 0A0B7145 ABCDABCD ..&x......qE+M+M07003A40: ABCDABCD ABCDABCD ABCDABCD ABCDABCD +M+M+M+M+M+M+M+M07003A50: ABCDABCD ABCDABCD ABCDABCD ABCDABCD +M+M+M+M+M+M+M+M07003A60: ABCDABCD ABCDABCD ABCDABCD ABCDABCD +M+M+M+M+M+M+M+M07003A70: ABCDABCD ABCDABCD ABCDABCD +M+M+M+M+M+M21:02:42: CEF: Try to CEF switch 10.4.9.4 from FastEthernet0/021:02:42: IP: s=10.4.9.6 (FastEthernet0/0), d=10.4.9.4 (FastEthernet0/0), len 1307003380: 0005 00509C08 ...P..07003390: 0007855B 4DC00800 45000064 001F0000 ...[M@..E..d....070033A0: FE019668 0A040906 0A040904 0800CF77 ~..h..........Ow070033B0: 0D062678 00000000 0A0B7149 ABCDABCD ..&x......qI+M+M070033C0: ABCDABCD ABCDABCD ABCDABCD ABCDABCD +M+M+M+M+M+M+M+M070033D0: ABCDABCD ABCDABCD ABCDABCD ABCDABCD +M+M+M+M+M+M+M+M070033E0: ABCDABCD ABCDABCD ABCDABCD ABCDABCD +M+M+M+M+M+M+M+M070033F0: ABCDABCD ABCDABCD ABCDABCD +M+M+M+M+M+M
Note
The output from the debug ip packet command, when the dump keyword is enabled, provides raw packet data in hexadecimal and ASCII forms. This addtional output is displayed in addition to the standard output. The dump keyword can be used with all of the available configuration options of this command.
Table 156 describes the significant fields shown in the display.
The calculation on whether to send a security error message can be somewhat confusing. It depends upon both the security label in the datagram and the label of the incoming interface. First, the label contained in the datagram is examined for anything obviously wrong. If nothing is wrong, assume the datagram to be correct. If something is wrong, the datagram is treated as unclassified genser. Then the label is compared with the interface range, and the appropriate action is taken, as Table 157 describes.
The security code can only generate a few types of Internet Control Message Protocol (ICMP) error messages. The only possible error messages and their meanings follow:
•
•
•
•
Note
When an IP packet is rejected due to an IP security failure, an audit message is sent via Department of Defense Intelligence Information System Network Security for Information Exchange (DNSIX) Network Address Translation (NAT). Also, any debug ip packet output is appended to include a description of the reason for rejection. This description can be any of the following:
•
•
•
•
•
•
•
•
•
•
•
•
•
•
•
•
•
•
•
•
debug ip pgm host
To display debug messages for the Pragmatic General Multicast (PGM) Host feature, use the debug ip pgm host command in privileged EXEC mode. To disable debugging output, use the no form of this command.
debug ip pgm host [data | nak | spm]
no debug ip pgm host [data | nak | spm]
Syntax Description
Defaults
Debugging for PGM Host is not enabled. If the debug ip pgm host command is used with no additional keywords, debugging is enabled for all PGM Host message types.
Command Modes
Privileged EXEC
Command History
Examples
The following is sample output from the debug ip pgm host command:
Router# debug ip pgm hostHost SPM debugging is onHost NAK/NCF debugging is onHost ODATA/RDATA debugging is onThe following is sample output from the debug ip pgm host command when the data keyword is used:
Router# debug ip pgm host data02:50:23:PGM Host:Received ODATA from 10.0.30.2 to 224.3.3.3 (74 bytes)02:50:23: ODATA TSI 00000A001E02-0401 data-dport BBBB csum 9317 tlen 7402:50:23: tsqn 31 dsqn 39The following example shows output of the debug ip pgm host command when the nak keyword is used. In the following example, the host sends a NAK to the source for a missing packet and the source returns an NCF to the host followed by an RDATA data packet.
Router# debug ip pgm host nak02:50:24:PGM Host:Sending NAK from 10.0.32.2 to 10.0.32.1 (36 bytes)02:50:24: NAK TSI 00000A001E02-0401 data-dport BBBB csum 04EC tlen 3602:50:24: dsqn 38 data source 10.0.30.2 group 224.3.3.302:50:24:PGM Host:Received NCF from 10.0.30.2 to 224.3.3.3 (36 bytes)02:50:24: NCF TSI 00000A001E02-0401 data-dport BBBB csum 02EC tlen 3602:50:24: dsqn 38 data source 10.0.30.2 group 224.3.3.302:50:24:PGM Host:Received RDATA from 10.0.30.2 to 224.3.3.3 (74 bytes)02:50:24: RDATA TSI 00000A001E02-0401 data-dport BBBB csum 9218 tlen 7402:50:24: tsqn 31 dsqn 38The following is sample output from the debug ip pgm host command with the spm keyword is used:
Router# debug ip pgm host spm02:49:39:PGM Host:Received SPM from 10.0.30.2 to 224.3.3.3 (36 bytes)02:49:39: SPM TSI 00000A001E02-0401 data-dport BBBB csum EA08 tlen 3602:49:39: dsqn 980 tsqn 31 lsqn 31 NLA 10.0.32.1Related Commands
debug ip pgm router
To display debug messages for Pragmatic General Multicast (PGM), use the debug ip pgm router command in privileged EXEC mode. To disable debugging output, use the no form of this command.
debug ip pgm router [spm | nak | data]
no debug ip pgm router [spm | nak | data]
Syntax Description
Defaults
Debugging for PGM is not enabled. If the debug ip pgm router command is used with no additional keywords, debugging is enabled for all PGM message types.
Command Modes
Privileged EXEC
Command History
Examples
The following shows sample output from the debug ip pgm router command:
Router# debug ip pgm routerSPM debugging is onNAK/NNAK/NCF debugging is onRDATA debugging is onThe following shows sample output from the debug ip pgm router command when the spm keyword is used:
Router# debug ip pgm router spmPGM: Received SPM on Ethernet1/0/5 from 10.7.0.200 to 227.7.7.7 (52 bytes)SPM TSI 0A0700C85555-1000 data-dport 1001 csum CCCC tlen 52dsqn 3758096779 tsqn 1954 isqn 1979 lsqn 1990NLA 10.7.0.200SPM from source/RPF-neighbour 10.7.0.200 for 10.7.0.200 (SPT)Forwarded SPM from 10.7.0.200 to 227.7.7.7The following is a debugging message for a selective SPM:
Router# debug ip pgm router spmPGM: Received SPM on Ethernet1/0/5 from 10.7.0.200 to 234.4.3.2 (52 bytes)SPM TSI 0A0700C85555-2000 data-dport 2001 csum CCCC tlen 52 Options P N Odsqn 3758096768 tsqn 1986 isqn 1994 lsqn 2006NLA 10.7.0.200SPM from source/RPF-neighbour 10.7.0.200 for 10.7.0.200 (SPT)Forwarded SPM from 10.7.0.200 to 227.7.7.7The "P N O" flags indicate which options are present in this packet:
•
•
•
The following shows sample output from the debug ip pgm router command when the nak keyword is used:
Router# debug ip pgm router nakPGM: Received NAK on Ethernet1/0/0 from 10.1.0.4 to 10.1.0.2 (36 bytes)NAK TSI 0A0700C85555-1000 data-dport 1001 csum CCCC tlen 36dsqn 1990 data source 10.7.0.200 group 227.7.7.7NAK unicast routed to RPF neighbour 10.4.0.1Forwarding NAK from 10.1.0.4 to 10.4.0.1 for 10.7.0.200PGM: Received NCF on Ethernet1/0/5 from 10.7.0.200 to 227.7.7.7 (36 bytes)NCF TSI 0A0700C85555-1000 data-dport 1001 csum CACC tlen 36dsqn 1990 data source 10.7.0.200 group 227.7.7.7NAK retx canceled for TSI 0A0700C85555-1000 dsqn 1990NAK elimination started for TSI 0A0700C85555-1000 dsqn 1990PGM: Received NCF on Ethernet1/0/5 from 10.7.0.200 to 227.7.7.7 (36 bytes)NCF TSI 0A0700C85555-1000 data-dport 1001 csum CACC tlen 36dsqn 1991 data source 10.7.0.200 group 227.7.7.7No NAK retx outstanding for TSI 0A0700C85555-1000 dsqn 1991NAK anticipated for TSI 0A0700C85555-1000 dsqn 1991The following example shows output of the debug ip pgm router command with the data keyword. The debugging message is for an RDATA packet for which the router has only anticipated state, sqn 1991. Because it did not actually get a NAK, this RDATA is not forwarded by the PGM router.
Router# debug ip pgm router dataPGM: Received RDATA on Ethernet1/0/5 from 10.7.0.200 to 227.7.7.7 (70 bytes)RDATA TSI 0A0700C85555-1000 data-dport 1001 csum CCCC tlen 32tsqn 1954 dsqn 1990Marking Ethernet1/0/0 for forwardingMarking Serial5/0 for skippingForwarded RDATA from 10.7.0.200 to 227.7.7.7Debug message for RDATA packet corresponding to a NAK for sqn1990. Since the NAK was received on Ethernet1/0/0, RDATA is forwardedout only that interface and another interface in the multicast olistSerial5/0 is skipped.PGM: Received RDATA on Ethernet1/0/5 from 10.7.0.200 to 227.7.7.7 (70 bytes)RDATA TSI 0A0700C85555-1000 data-dport 1001 csum CCCC tlen 32tsqn 1954 dsqn 1991Eliminated RDATA (null oif) from 10.7.0.200 to 227.7.7.7Related Commands
ip pgm router
Enables the PGM Router Assist feature for the interface.
show ip pgm router
Displays PGM traffic statistics and TSI state.
debug ip pim
To display Protocol Independent Multicast (PIM) packets received and sent, and to display PIM-related events, use the debug ip pim command in privileged EXEC mode. To disable debugging output, use the no form of this command.
debug ip pim [vrf vrf-name] [group-address | atm | auto-rp | bsr | df [rp-address] | hello | tag]
no debug ip pim [vrf vrf-name] [group-address | atm | auto-rp | bsr | df [rp-address] | hello | tag]
Syntax Description
Defaults
All PIM packets are displayed.
Command Modes
Privileged EXEC
Command History
Usage Guidelines
PIM uses Internet Group Management Protocol (IGMP) packets to communicate with routers and advertise reachability information.
Use this command with the debug ip igmp and debug ip mrouting commands to display additional multicast routing information.
Examples
The following is sample output from the debug ip pim command:
Router# debug ip pim 224.2.0.1PIM: Received Join/Prune on Ethernet1 from 172.16.37.33PIM: Received Join/Prune on Ethernet1 from 172.16.37.33PIM: Received Join/Prune on Tunnel0 from 10.3.84.1PIM: Received Join/Prune on Ethernet1 from 172.16.37.33PIM: Received Join/Prune on Ethernet1 from 172.16.37.33PIM: Received RP-Reachable on Ethernet1 from 172.16.20.31PIM: Update RP expiration timer for 224.2.0.1PIM: Forward RP-reachability packet for 224.2.0.1 on Tunnel0PIM: Received Join/Prune on Ethernet1 from 172.16.37.33PIM: Prune-list (10.221.196.51/32, 224.2.0.1)PIM: Set join delay timer to 2 seconds for (10.221.0.0/16, 224.2.0.1) on Ethernet1PIM: Received Join/Prune on Ethernet1 from 172.16.37.6PIM: Received Join/Prune on Ethernet1 from 172.16.37.33PIM: Received Join/Prune on Tunnel0 from 10.3.84.1PIM: Join-list: (*, 224.2.0.1) RP 172.16.20.31PIM: Add Tunnel0 to (*, 224.2.0.1), Forward statePIM: Join-list: (10.0.0.0/8, 224.2.0.1)PIM: Add Tunnel0 to (10.0.0.0/8, 224.2.0.1), Forward statePIM: Join-list: (10.4.0.0/16, 224.2.0.1)PIM: Prune-list (172.16.84.16/28, 224.2.0.1) RP-bit set RP 172.16.84.16PIM: Send Prune on Ethernet1 to 172.16.37.6 for (172.16.84.16/28, 224.2.0.1), RPPIM: For RP, Prune-list: 10.9.0.0/16PIM: For RP, Prune-list: 10.16.0.0/16PIM: For RP, Prune-list: 10.49.0.0/16PIM: For RP, Prune-list: 10.84.0.0/16PIM: For RP, Prune-list: 10.146.0.0/16PIM: For 10.3.84.1, Join-list: 172.16.84.16/28PIM: Send periodic Join/Prune to RP via 172.16.37.6 (Ethernet1)The following lines appear periodically when PIM is running in sparse mode and indicate to this router the multicast groups and multicast sources in which other routers are interested:
PIM: Received Join/Prune on Ethernet1 from 172.16.37.33PIM: Received Join/Prune on Ethernet1 from 172.16.37.33The following lines appear when a rendezvous point (RP) message is received and the RP timer is reset. The expiration timer sets a checkpoint to make sure the RP still exists. Otherwise, a new RP must be discovered.
PIM: Received RP-Reachable on Ethernet1 from 172.16.20.31PIM: Update RP expiration timer for 224.2.0.1PIM: Forward RP-reachability packet for 224.2.0.1 on Tunnel0The prune message in the following line states that this router is not interested in the Source-Active (SA) information. This message tells an upstream router to stop forwarding multicast packets from this source. The address 10.221.196.51/32 indicates a host route with 32 bits of mask.
PIM: Prune-list (10.221.196.51/32, 224.2.0.1)In the following line, a second router on the network wants to override the prune message that the upstream router just received. The timer is set at a random value so that if additional routers on the network still want to receive multicast packets for the group, only one will actually send the message. The other routers will receive the join message and then suppress sending their own message.
PIM: Set join delay timer to 2 seconds for (10.221.0.0/16, 224.2.0.1) on Ethernet1In the following line, a join message is sent toward the RP for all sources:
PIM: Join-list: (*, 224.2.0.1) RP 172.16.20.31In the following lines, the interface is being added to the outgoing interface (OIF) of the (*, G) and
(S, G) multicast route (mroute) table entry so that packets from the source will be forwarded out that particular interface:PIM: Add Tunnel0 to (*, 224.2.0.1), Forward statePIM: Add Tunnel0 to (10.0.0.0/8, 224.2.0.1), Forward stateThe following line appears in sparse mode only. There are two trees on which data may be received: the RP tree and the source tree. In dense mode there is no RP. After the source and the receiver have discovered one another at the RP, the first-hop router for the receiver will usually join to the source tree rather than the RP tree.
PIM: Prune-list (172.16.84.16/28, 224.2.0.1) RP-bit set RP 172.16.84.16The send prune message in the next line shows that a router is sending a message to a second router saying that the first router should no longer receive multicast packets for the (S, G). The RP at the end of the message indicates that the router is pruning the RP tree and is most likely joining the source tree, although the router may not have downstream members for the group or downstream routers with members of the group. The output shows the specific sources from which this router no longer wants to receive multicast messages.
PIM: Send Prune on Ethernet1 to 172.16.37.6 for (172.16.84.16/28, 224.2.0.1), RPThe following lines indicate that a prune message is sent toward the RP so that the router can join the source tree rather than the RP tree:
PIM: For RP, Prune-list: 10.9.0.0/16PIM: For RP, Prune-list: 10.16.0.0/16PIM: For RP, Prune-list: 10.49.0.0/16In the following line, a periodic message is sent toward the RP. The default period is once per minute. Prune and join messages are sent toward the RP or source rather than directly to the RP or source. It is the responsibility of the next hop router to take proper action with this message, such as continuing to forward it to the next router in the tree.
PIM: Send periodic Join/Prune to RP via 172.16.37.6 (Ethernet1)Related Commands
debug ip pim atm
To log Protocol Independent Multicast (PIM) ATM signalling activity, use the debug ip pim atm command in privileged EXEC mode. To disable debugging output, use the no form of this command.
debug ip pim atm
no debug ip pim atm
Syntax Description
This command has no arguments or keywords.
Command Modes
Privileged EXEC
Examples
The following sample output shows a new group being created and the router toward the rendezvous point (RP) opening a new virtual circuit (VC). Because there are now two groups on this router, there are two VCs open, as reflected by the "current count."
The following is sample output from the debug ip pim atm command:
Router# debug ip pim atmJan 28 19:05:51: PIM-ATM: Max VCs 200, current count 1Jan 28 19:05:51: PIM-ATM: Send SETUP on ATM2/0 for 239.254.254.253/172.31.214.43Jan 28 19:05:51: PIM-ATM: Received CONNECT on ATM2/0 for 239.254.254.253, vcd 19Jan 28 19:06:35: PIM-ATM: Max VCs 200, current count 2Table 158 describes the significant fields shown in the display.
The resulting show ip mroute output follows:
Router# show ip mroute 239.254.254.253IP Multicast Routing TableFlags: D - Dense, S - Sparse, C - Connected, L - Local, P - PrunedR - RP-bit set, F - Register flag, T - SPT-bit set, J - Join SPTTimers: Uptime/ExpiresInterface state: Interface, Next-Hop or VCD, State/Mode(*, 239.254.254.253), 00:00:04/00:02:53, RP 172.31.214.50, flags: SIncoming interface: Ethernet1/1, RPF nbr 172.31.214.50Outgoing interface list:ATM2/0, VCD 19, Forward/Sparse-Dense, 00:00:04/00:02:52debug ip pim auto-rp
To display the contents of each Protocol Independent Multicast (PIM) packet used in the automatic discovery of group-to-rendezvous point (RP) mapping and the actions taken on the address-to-RP mapping database, use the debug ip pim auto-rp command in privileged EXEC mode. To disable debugging output, use the no form of this command.
debug ip pim auto-rp [vrf vrf-name]
no debug ip pim auto-rp [vrf vrf-name]
Syntax Description
vrf
(Optional) Supports the Multicast Virtual Private Network (VPN) routing and forwarding (VRF) instance.
vrf-name
(Optional) Name assigned to the VRF.
Defaults
No default behavior or values
Command Modes
Privileged EXEC
Command History
Examples
The following is sample output from the debug ip pim auto-rp command:
Router# debug ip pim auto-rpAuto-RP: Received RP-announce, from 172.16.214.66, RP_cnt 1, holdtime 180 secsAuto-RP: update (192.168.248.0/24, RP:172.16.214.66)Auto-RP: Build RP-Discovery packetAuto-RP: Build mapping (192.168.248.0/24, RP:172.16.214.66),Auto-RP: Build mapping (192.168.250.0/24, RP:172.16.214.26).Auto-RP: Build mapping (192.168.254.0/24, RP:172.16.214.2).Auto-RP: Send RP-discovery packet (3 RP entries)Auto-RP: Build RP-Announce packet for 172.16.214.2Auto-RP: Build announce entry for (192.168.254.0/24)Auto-RP: Send RP-Announce packet, IP source 172.16.214.2, ttl 8The first two lines show a packet received from 172.16.214.66 announcing that it is the RP for the groups in 192.168.248.0/24. This announcement contains one RP address and is valid for 180 seconds. The RP-mapping agent then updates its mapping database to include the new information.
Auto-RP: Received RP-announce, from 172.16.214.66, RP_cnt 1, holdtime 180 secsAuto-RP: update (192.168.248.0/24, RP:172.16.214.66)In the next five lines, the router creates an RP-discovery packet containing three RP mapping entries. The packet is sent to the well-known CISCO-RP-DISCOVERY group address (224.0.1.40).
Auto-RP: Build RP-Discovery packetAuto-RP: Build mapping (192.168.248.0/24, RP:172.16.214.66),Auto-RP: Build mapping (192.168.250.0/24, RP:172.16.214.26).Auto-RP: Build mapping (192.168.254.0/24, RP:172.16.214.2).Auto-RP: Send RP-discovery packet (3 RP entries)The final three lines show the router announcing that it intends to be an RP for the groups in 192.168.254.0/24. Only routers inside the scope "ttl 8" receive the advertisement and use the RP for these groups.
Auto-RP: Build RP-Announce packet for 172.16.214.2Auto-RP: Build announce entry for (192.168.254.0/24)Auto-RP: Send RP-Announce packet, IP source 172.16.214.2, ttl 8The following is sample output from the debug ip pim auto-rp command when a router receives an update. In this example, the packet contains three group-to-RP mappings, which are valid for 180 seconds. The RP-mapping agent then updates its mapping database to include the new information.
Router# debug ip pim auto-rpAuto-RP: Received RP-discovery, from 172.16.214.17, RP_cnt 3, holdtime 180 secsAuto-RP: update (192.168.248.0/24, RP:172.16.214.66)Auto-RP: update (192.168.250.0/24, RP:172.16.214.26)Auto-RP: update (192.168.254.0/24, RP:172.16.214.2)debug ip policy
To display IP policy routing packet activity, use the debug ip policy command in privileged EXEC mode. To disable debugging output, use the no form of this command.
debug ip policy [access-list-name]
no debug ip policy [access-list-name]
Syntax Description
Command Modes
Privileged EXEC
Command History
Usage Guidelines
After you configure IP policy routing with the ip policy and route-map commands, use the debug ip policy command to ensure that the IP policy is configured correctly.
Policy routing looks at various parts of the packet and then routes the packet based on certain user-defined attributes in the packet.
The debug ip policy command helps you determine what policy routing is following. It displays information about whether a packet matches the criteria, and if so, the resulting routing information for the packet.
Caution
Examples
The following is sample output from the debug ip policy command:
Router# debug ip policy 3IP: s=10.0.0.1 (Ethernet0/0/1), d=10.0.0.7, len 100,FIB flow policy matchIP: s=10.0.0.1 (Ethernet0/0/1), d=10.0.0.7, len 100,FIB PR flow accelerated!IP: s=10.0.0.1 (Ethernet0/0/1), d=10.0.0.7, g=10.0.0.8, len 100, FIB policy routedTable 159 describes the significant fields shown in the display.
debug ip rbscp ack-split
To display information about TCP ACK splitting done in conjunction with Rate-Based Satellite Control Protocol (RBSCP), use the debug ip rbscp ack-split command in privileged EXEC mode. To disable debug output, use the no form of this command.
debug ip rbscp ack-split
no debug ip rbscp ack-split
Syntax Description
This command has no arguments or keywords.
Defaults
RBSCP debugging for TCP ACKs is disabled by default.
Command Modes
Privileged EXEC
Command History
Usage Guidelines
Caution
Examples
The following is sample output from the debug ip rbscp ack-split command when the packets match the access list applied to RBSCP. The output includes the source and destination IP addresses and port numbers, the hexadecimal sequence number, and the cumulative ACK that acknowledges bytes up to that number.
Router# debug ip rbscp ack-split*May 11 02:17:01.407: RBSCP ACK split: 0x662852D0, input FastEthernet1/0 -> output FastEthernet1/1*May 11 02:17:01.407: RBSCP ACK split: rcvd src 1.1.1.1:38481 -> dst 3.3.3.1:21, cumack 2336109115*May 11 02:17:01.407: RBSCP ACK split: generated 0x65FC0874 cumack 2336109112*May 11 02:17:01.407: RBSCP ACK split: generated 0x66762A78 cumack 2336109113*May 11 02:17:01.407: RBSCP ACK split: generated 0x6676442C cumack 2336109114*May 11 02:17:01.407: RBSCP ACK split: releasing original ACK 2336109115*May 11 02:17:01.415: RBSCP process: 0x662852D0 passed access list*May 11 02:17:01.415: RBSCP ACK split: 0x662852D0, input FastEthernet1/0 -> output FastEthernet1/1*May 11 02:17:01.415: RBSCP ACK split: rcvd src 1.1.1.1:36022 -> dst 3.3.3.1:20240, cumack 4024420742*May 11 02:17:01.415: RBSCP ACK split: generated 0x65FC1E7C cumack 4024420739*May 11 02:17:01.415: RBSCP ACK split: generated 0x65FC2980 cumack 4024420740*May 11 02:17:01.415: RBSCP ACK split: generated 0x65FC3484 cumack 4024420741*May 11 02:17:01.415: RBSCP ACK split: releasing original ACK 4024420742*May 11 02:17:01.419: RBSCP process: 0x662852D0 passed access list*May 11 02:17:01.419: RBSCP ACK split: 0x662852D0, input FastEthernet1/0 -> output FastEthernet1/1Related Commands
debug ip rbscp
To display general error messages about access list-based Rate-Based Satellite Control Protocol (RBSCP), use the debug ip rbscp command in privileged EXEC mode. To disable debug output, use the no form of this command.
debug ip rbscp
no debug ip rbscp
Syntax Description
This command has no arguments or keywords.
Defaults
RBSCP debugging is disabled by default.
Command Modes
Privileged EXEC
Command History
Usage Guidelines
Caution
Examples
The following is sample output from the debug ip rbscp command. The hexadecminal number is the sequence number to keep track of the flow.
Router# debug ip rbscp*May 11 02:17:01.407: RBSCP process: 0x662852D0 passed access listRelated Commands
debug ip rgmp
To log debugging messages sent by a Router-Port Group Management Protocol (RGMP)-enabled router, use the debug ip rgmp command in privileged EXEC mode. To disable debugging outut, use the no form of this command.
debug ip rgmp [group-name | group-address]
no debug ip rgmp
Syntax Description
group-name
(Optional) The name of a specific IP multicast group.
group-address
(Optional) The IP address of a specific IP multicast group.
Defaults
Debugging for RGMP is not enabled. If the debug ip rgmp command is used without arguments, debugging is enabled for all RGMP message types.
Command Modes
Privileged EXEC
Command History
12.0(10)S
This command was introduced.
12.1(1)E
The command was integrated into Cisco IOS Release 12.1(1)E.
12.1(5)T
The command was integrated into Cisco IOS Release 12.1(5)T.
Examples
The following shows sample output from the debug ip rgmp command:
Router# debug ip rgmpRGMP: Sending a Hello packet on Ethernet1/0RGMP: Sending a Join packet on Ethernet1/0 for group 10.1.2.3RGMP: Sending a Leave packet on Ethernet1/0 for group 10.1.2.3RGMP: Sending a Bye packet on Ethernet1/0Related Commands
ip rgmp
Enables the RGMP on IEEE 802.3 Ethernet interfaces.
show ip igmp interface
Displays multicast-related information about an interface.
debug ip rip
To display information on Routing Information Protocol (RIP) routing transactions, use the debug ip rip command in privileged EXEC mode. To disable debugging output, use the no form of this command.
debug ip rip
no debug ip rip
Syntax Description
This command has no arguments or keywords.
Command Modes
Privileged EXEC
Examples
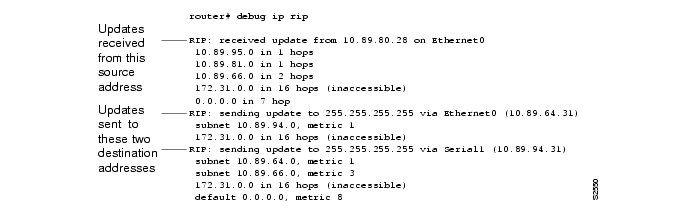
The following is sample output from the debug ip rip command:
The output shows that the router being debugged has received updates from one router at source address 160.89.80.28. That router sent information about five destinations in the routing table update. Notice that the fourth destination address in the update—131.108.0.0—is inaccessible because it is more than 15 hops away from the router sending the update. The router being debugged also sent updates, in both cases to broadcast address 255.255.255.255 as the destination.
The second line is an example of a routing table update. It shows how many hops a given Internet address is from the router.
The entries show that the router is sending updates that are similar, except that the number in parentheses is the source address encapsulated into the IP header.
Examples of additional output that the debug ip rip command can generate follow.
Entries such as the following appear at startup or when an event occurs such as an interface making a transition or a user manually clearing the routing table:
RIP: broadcasting general request on Ethernet0RIP: broadcasting general request on Ethernet1An entry such as the following is most likely caused by a malformed packet from the sender:
RIP: bad version 128 from 172.31.80.43debug ip routing
To display information on Routing Information Protocol (RIP) routing table updates and route cache updates, use the debug ip routing command in privileged EXEC mode. To disable debugging output, use the no form of this command.
debug ip routing
no debug ip routing
Syntax Description
This command has no arguments or keywords.
Defaults
No default behavior or values
Command Modes
Privileged EXEC
Command History
Examples
The following is sample output from the debug ip routing command:
Router# debug ip routingRT: add 172.25.168.0 255.255.255.0 via 172.24.76.30, igrp metric [100/3020]RT: metric change to 172.25.168.0 via 172.24.76.30, igrp metric [100/3020]new metric [100/2930]IP: cache invalidation from 0x115248 0x1378A, new version 5736RT: add 172.26.219.0 255.255.255.0 via 172.24.76.30, igrp metric [100/16200]RT: metric change to 172.26.219.0 via 172.24.76.30, igrp metric [100/16200]new metric [100/10816]RT: delete route to 172.26.219.0 via 172.24.76.30, igrp metric [100/10816]RT: no routes to 172.26.219.0, entering holddownIP: cache invalidation from 0x115248 0x1378A, new version 5737RT: 172.26.219.0 came out of holddownRT: garbage collecting entry for 172.26.219.0IP: cache invalidation from 0x115248 0x1378A, new version 5738RT: add 172.26.219.0 255.255.255.0 via 172.24.76.30, igrp metric [100/10816]RT: delete route to 172.26.219.0 via 172.24.76.30, igrp metric [100/10816]RT: no routes to 172.26.219.0, entering holddownIP: cache invalidation from 0x115248 0x1378A, new version 5739RT: 172.26.219.0 came out of holddownRT: garbage collecting entry for 172.26.219.0IP: cache invalidation from 0x115248 0x1378A, new version 5740RT: add 172.26.219.0 255.255.255.0 via 172.24.76.30, igrp metric [100/16200]RT: metric change to 172.26.219.0 via 172.24.76.30, igrp metric [100/16200]new metric [100/10816]RT: delete route to 172.26.219.0 via 172.24.76.30, igrp metric [100/10816]RT: no routes to 172.26.219.0, entering holddownIP: cache invalidation from 0x115248 0x1378A, new version 5741In the following lines, a newly created entry has been added to the IP routing table. The "metric change" indicates that this entry existed previously, but its metric changed and the change was reported by means of IGRP. The metric could also be reported via RIP, OSPF, or another IP routing protocol. The numbers inside the brackets report the administrative distance and the actual metric.
RT: add 172.25.168.0 255.255.255.0 via 172.24.76.30, igrp metric [100/3020]RT: metric change to 172.25.168.0 via 172.24.76.30, igrp metric [100/3020]new metric [100/2930]IP: cache invalidation from 0x115248 0x1378A, new version 5736"Cache invalidation" means that the fast-switching cache was invalidated due to a routing table change. "New version" is the version number of the routing table. When the routing table changes, this number is incriminated. The hexadecimal numbers are internal numbers that vary from version to version and software load to software load.
In the following output, the "holddown" and "cache invalidation" lines are displayed. Most of the distance vector routing protocols use "holddown" to avoid typical problems like counting to infinity and routing loops. If you look at the output of the show ip protocols command you will see the timer values for "holddown" and "cache invalidation." "Cache invalidation" corresponds to "came out of holddown." "Delete route" is triggered when a better path appears. It removes the old inferior path.
RT: delete route to 172.26.219.0 via 172.24.76.30, igrp metric [100/10816]RT: no routes to 172.26.219.0, entering holddownIP: cache invalidation from 0x115248 0x1378A, new version 5737RT: 172.26.219.0 came out of holddowndebug ip rsvp
Caution
To display debug messages for RSVP categories, use the debug ip rsvp command in privileged EXEC mode. To disable debugging output, use the no form of this command.
debug ip rsvp [all | api | authentication | data-pkts | database | detail | dump-messages | errors | events | fast-reroute | filter | function | handles | hello | messages | msg-mgr | path | policy | proxy | rate-limit | reliable-msg | resv | routing | sbm | signalling | snmp | summary-refresh | svc | timeouts | timer | traffic-control | wfq]
no debug ip rsvp
Syntax Description
Defaults
Disabled
Command Modes
Privileged EXEC
Command History
Examples
The following commands show how to enable debugging for RSVP categories, signalling and messages:
Router# debug ip rsvp signallingRSVP signalling messages (Summary) debugging is onRouter# debug ip rsvp messagesRSVP messages (sent/received via IP) debugging is onIn the following display, RSVP signalling-related events that include sending and receiving Path and Resv messages, admitting new reservations, establishing sessions, sending and receiving acknowledgments (ACKS), and sending and receiving summary refresh messages appear:
01:14:56:RSVP 140.20.1.1_19->140.75.1.1_100[140.20.1.1]:Received Path message from
140.20.1.1 (on sender host)
01:14:56:RSVP:new path message passed parsing, continue...01:14:56:RSVP 140.20.1.1_19->140.75.1.1_100[140.20.1.1]:Refresh Path psb = 61646BB0 refresh interval = 0mSec01:14:56:RSVP 140.20.1.1_19->140.75.1.1_100[140.20.1.1]:Sending Path message to 140.4.4.201:14:56:RSVP session 140.75.1.1_100[140.20.1.1]:Path sent by IP to 140.4.4.2 length=216 checksum=B1E4 TOS=0xC0 prerouted=YESrouter_alert=YES udp=NO (Ethernet1)01:14:56:RSVP:Resv received from IP layer (IP HDR 140.4.4.2->140.4.4.1)01:14:56:RSVP session 140.75.1.1_100[140.20.1.1]:Received RESV for 140.75.1.1 (Ethernet1) from 140.4.4.201:14:56:RSVP 140.20.1.1_19->140.75.1.1_100[140.20.1.1]:reservation not found--new one01:14:56:RSVP-RESV:Admitting new reservation:6165D0E401:14:56:RSVP 140.20.1.1_19->140.75.1.1_100[140.20.1.1]:RSVP bandwidth is available01:14:56:RSVP-RESV:reservation was installed:6165D0E401:14:57:RSVP:Sending Unknown message to 140.4.4.201:14:57:RSVP:Ack sent by IP to 140.4.4.2 length=20 checksum=34A7 TOS=0x00 prerouted=NO router_alert=NO udp=NO (Ethernet1)01:14:57:RSVP 140.20.1.1_19->140.75.1.1_100[140.20.1.1]:Refresh Path psb = 61646BB0 refresh interval = 937mSec01:14:58:%LINK-3-UPDOWN:Interface Tunnel100, changed state to up01:14:59:%LINEPROTO-5-UPDOWN:Line protocol on Interface Tunnel100, changed state to up01:15:26:RSVP 140.20.1.1_19->140.75.1.1_100[140.20.1.1]:Refresh Path psb = 61646BB0 refresh interval = 30000mSec01:15:26:RSVP 140.20.1.1_19->140.75.1.1_100[140.20.1.1]:Sending Path message to 140.4.4.201:15:26:RSVP session 140.75.1.1_100[140.20.1.1]:Path sent by IP to 140.4.4.2 length=216 checksum=B1E4 TOS=0xC0 prerouted=YESrouter_alert=YES udp=NO (Ethernet1)01:15:26:RSVP:Resv received from IP layer (IP HDR 140.4.4.2->140.4.4.1)01:15:26:RSVP session 140.75.1.1_100[140.20.1.1]:Received RESV for 140.75.1.1 (Ethernet1) from 140.4.4.201:15:26:RSVP 140.20.1.1_19->140.75.1.1_100[140.20.1.1]:reservation found--processing possible change:6165D0E401:15:26:RSVP 140.20.1.1_19->140.75.1.1_100[140.20.1.1]:No change in reservation01:15:27:RSVP:Sending Ack message to 140.4.4.201:15:27:RSVP:Ack sent by IP to 140.4.4.2 length=20 checksum=34A7 TOS=0x00 prerouted=NO router_alert=NO udp=NO (Ethernet1)01:15:56:RSVP:Sending Srefresh message to 140.4.4.201:15:56:RSVP:Srefresh sent by IP to 140.4.4.2 length=32 checksum=CA0D TOS=0x00 prerouted=NO router_alert=NO udp=NO (Ethernet1)01:15:56:RSVP:Ack received from IP layer (IP HDR 140.4.4.2->140.4.4.1)01:15:56:RSVP:Srefresh received from IP layer (IP HDR 140.4.4.2->140.4.4.1)01:15:56:RSVP-RESV:Resv state is being refreshed for 0x9101:15:56:RSVP:Sending Ack message to 140.4.4.201:15:56:RSVP:Ack sent by IP to 140.4.4.2 length=20 checksum=34A5 TOS=0x00 prerouted=NO router_alert=NO udp=NO (Ethernet1)01:16:26:RSVP:Sending Srefresh message to 140.4.4.201:16:26:RSVP:Srefresh sent by IP to 140.4.4.2 length=32 checksum=CA0C TOS=0x00 prerouted=NO router_alert=NO udp=NO (Ethernet1)01:16:26:RSVP:Ack received from IP layer (IP HDR 140.4.4.2->140.4.4.1)01:16:26:RSVP:Srefresh received from IP layer (IP HDR 140.4.4.2->140.4.4.1)01:16:26:RSVP-RESV:Resv state is being refreshed for 0x9101:16:26:RSVP:Sending Ack message to 140.4.4.201:16:26:RSVP:Ack sent by IP to 140.4.4.2 length=20 checksum=34A3 TOS=0x00 prerouted=NO router_alert=NO udp=NO (Ethernet1)Related Commands
ip rsvp signalling refresh reduction
Enables refresh reduction.
show debug
Displays active debug output.
debug ip rsvp authentication
To display debugging output related to Resource Reservation Protocol (RSVP) authentication, use the debug ip rsvp authentication command in privileged EXEC mode. To disable debugging output, use the no form of this command.
debug ip rsvp authentication
no debug ip rsvp authentication
Syntax Description
This command has no arguments or keywords.
Defaults
This command is disabled.
Command Modes
Privileged EXEC
Command History
Usage Guidelines
After you enable RSVP authentication, RSVP logs system error events whenever an authentication check fails. These events are logged instead of just being displayed when debugging is enabled because they may indicate potential security attacks. The events are generated when:
•
•
•
•
Examples
The following example shows output from the debug ip rsvp authentication command in which the authentication type (digest) and the sequence number have been validated:
Router# debug ip rsvp authenticationRSVP authentication debugging is onRouter# show debugging*Jan 30 08:10:46.335:RSVP_AUTH:Resv integrity digest from 192.168.101.2 valid*Jan 30 08:10:46.335:RSVP_AUTH:Resv integrity sequence number 13971113505298841601 from 192.168.101.2 valid*Jan 30 08:10:46.335:RSVP_AUTH:Resv from 192.168.101.2 passed all authentication checks
Note
Related Commands
ip rsvp authentication
Activates RSVP cryptographic authentication.
show debugging
Displays active debug output.
debug ip rsvp detail
To display detailed information about Resource Reservation Protocol (RSVP)-enabled and Subnetwork Bandwidth Manager (SBM) message processing, use the debug ip rsvp detail command in privileged EXEC mode. To disable debugging output, use the no form of this command.
debug ip rsvp detail
no debug ip rsvp detail
Syntax Description
This command has no arguments or keywords.
Defaults
Disabled
Command Modes
Privileged EXEC
Command History
12.0(5)T
This command was introduced.
12.0(23)S
This command was integrated into Cisco IOS Release 12.0(23)S.
Examples
The following example shows the detailed debug information about RSVP and SBM that is available when you enable debug mode through the debug ip rsvp detail command:
Router# debug ip rsvp detailRSVP debugging is onrouter2#u*Dec 31 16:44:29.651: RSVP: send I_AM_DSBM message from 10.2.2.150*Dec 31 16:44:29.651: RSVP: IP to 224.0.0.17 length=88 checksum=43AF (Ethernet2)*Dec 31 16:44:29.651: RSVP: version:1 flags:0000 type:I_AM_DSBM cksum:43AF ttl:254 reserved:0 length:88*Dec 31 16:44:29.651: DSBM_IP_ADDR type 1 length 8 : 91020296*Dec 31 16:44:29.651: HOP_L2 type 1 length 12: 00E01ECE*Dec 31 16:44:29.651: : 0F760000*Dec 31 16:44:29.651: SBM_PRIORITY type 1 length 8 : 00000064*Dec 31 16:44:29.651: DSBM_TIMERS type 1 length 8 : 00000F05*Dec 31 16:44:29.651: SBM_INFO type 1 length 44: 00000000*Dec 31 16:44:29.651: : 00240C02 00000007*Dec 31 16:44:29.651: : 01000006 7F000005*Dec 31 16:44:29.651: : 00000000 00000000*Dec 31 16:44:29.655: : 00000000 00000000*Dec 31 16:44:29.655: : 00000000Related Commands
debug ip rsvp dump-messages
Caution
To display debugging messages for all RSVP events, use the debug ip rsvp dump-messages command in privileged EXEC mode. To disable debugging output, use the no form of this command.
debug ip rsvp dump-messages [hex | path | resv | sbm | signalling]
no debug ip rsvp dump-messages
Syntax Description
Defaults
No default behavior or values
Command Modes
Privileged EXEC
Command History
12.2(13)T
This command was introduced.
12.0(24)S
This command was integrated into Cisco IOS Release 12.0(24)S.
Examples
The following command shows how to enable debugging for RSVP events:
Router# debug ip rsvp dump-messagesRSVP message dump debugging is onIn the following display, notice that a Path message is transmitted and an ACK_DESIRED flag is set for ID: 0x26 Epoch: 0x76798A. In response, a Resv message is sent and an acknowledgment (ACK) is issued for ID: 0x26 Epoch: 0x76798A indicating the RSVP state is established on the neighboring router:
00:37:15:RSVP:version:1 flags:0000 type:PROXY_PATH cksum:0000 ttl:255 reserved:0
length:212
00:37:15: SESSION type 7 length 16:00:37:15: Destination 140.75.1.1, TunnelId 100, Source 140.20.1.1, Protocol 0, Flags 000000:37:15: HOP type 1 length 12:00:37:15: Neighbor 140.20.1.1, LIH 0x0000000000:37:15: TIME_VALUES type 1 length 8 :00:37:15: Refresh period is 30000 msecs00:37:15: SENDER_TEMPLATE type 7 length 12:00:37:15: Source 140.20.1.1, tunnel_id 900:37:15: SENDER_TSPEC type 2 length 36:00:37:15: version=0, length in words=700:37:15: Token bucket fragment (service_id=1, length=6 words00:37:15: parameter id=127, flags=0, parameter length=500:37:15: average rate=1250 bytes/sec, burst depth=1000 bytes00:37:15: peak rate =1250 bytes/sec00:37:15: min unit=0 bytes, max pkt size=4294967295 bytes00:37:15: ADSPEC type 2 length 48:00:37:15: version=0 length in words=1000:37:15: General Parameters break bit=0 service length=800:37:15: IS Hops:000:37:15: Minimum Path Bandwidth (bytes/sec):214748364700:37:15: Path Latency (microseconds):000:37:15: Path MTU:-100:37:15: Controlled Load Service break bit=0 service length=000:37:15: LABEL_REQUEST type 1 length 8 :00:37:15: Layer 3 protocol ID:204800:37:15: EXPLICIT_ROUTE type 1 length 36:00:37:15: (#1) Strict IPv4 Prefix, 8 bytes, 140.20.1.1/3200:37:15: (#2) Strict IPv4 Prefix, 8 bytes, 140.4.4.2/3200:37:15: (#3) Strict IPv4 Prefix, 8 bytes, 140.70.1.1/3200:37:15: (#4) Strict IPv4 Prefix, 8 bytes, 140.70.1.2/3200:37:15: SESSION_ATTRIBUTE type 7 length 28:00:37:15: Session name:tagsw4500-21_t10000:37:15: Setup priority:7, reservation priority:700:37:15: Status:May-Reroute00:37:15:00:37:15:RSVP:version:1 flags:0001 type:Path cksum:D61E ttl:255 reserved:0 length:21600:37:15: MESSAGE_ID type 1 length 12:00:37:15: ID:0x26 Epoch:0x76798A00:37:15: Flags:ACK_DESIRED00:37:15: SESSION type 7 length 16:00:37:15: Destination 140.75.1.1, TunnelId 100, Source 140.20.1.1, Protocol 0, Flags 000000:37:15: HOP type 1 length 12:00:37:15: Neighbor 140.4.4.1, LIH 0x1000040100:37:15: TIME_VALUES type 1 length 8 :00:37:15: Refresh period is 30000 msecs00:37:15: EXPLICIT_ROUTE type 1 length 28:00:37:15: (#1) Strict IPv4 Prefix, 8 bytes, 140.4.4.2/3200:37:15: (#2) Strict IPv4 Prefix, 8 bytes, 140.70.1.1/3200:37:15: (#3) Strict IPv4 Prefix, 8 bytes, 140.70.1.2/3200:37:15: LABEL_REQUEST type 1 length 8 :00:37:15: Layer 3 protocol ID:204800:37:15: SESSION_ATTRIBUTE type 7 length 28:00:37:15: Session name:tagsw4500-21_t10000:37:15: Setup priority:7, reservation priority:700:37:15: Status:May-Reroute00:37:15: SENDER_TEMPLATE type 7 length 12:00:37:15: Source 140.20.1.1, tunnel_id 900:37:15: SENDER_TSPEC type 2 length 36:00:37:15: version=0, length in words=700:37:15: Token bucket fragment (service_id=1, length=6 words00:37:15: parameter id=127, flags=0, parameter length=500:37:15: average rate=1250 bytes/sec, burst depth=1000 bytes00:37:15: peak rate =1250 bytes/sec00:37:15: min unit=0 bytes, max pkt size=4294967295 bytes00:37:15: ADSPEC type 2 length 48:00:37:15: version=0 length in words=1000:37:15: General Parameters break bit=0 service length=800:37:15: IS Hops:100:37:15: Minimum Path Bandwidth (bytes/sec):125000000:37:15: Path Latency (microseconds):000:37:15: Path MTU:150000:37:15: Controlled Load Service break bit=0 service length=000:37:15:00:37:15:RSVP:version:1 flags:0001 type:Resv cksum:DADF ttl:255 reserved:0 length:13200:37:15: MESSAGE_ID_ACK type 1 length 12:00:37:15: Type:ACK00:37:15: ID:0x26 Epoch:0x76798A00:37:15: Flags:None00:37:15: MESSAGE_ID type 1 length 12:00:37:15: ID:0x43 Epoch:0xE1A1B700:37:15: Flags:ACK_DESIRED00:37:15: SESSION type 7 length 16:00:37:15: Destination 140.75.1.1, TunnelId 100, Source 140.20.1.1, Protocol 0, Flags 000000:37:15: HOP type 1 length 12:00:37:15: Neighbor 140.4.4.2, LIH 0x1000040100:37:15: TIME_VALUES type 1 length 8 :00:37:15: Refresh period is 30000 msecs00:37:15: STYLE type 1 length 8 :00:37:15: Shared-Explicit (SE)00:37:15: FLOWSPEC type 2 length 36:00:37:15: version = 0 length in words = 700:37:15: service id = 5, service length = 600:37:15: tspec parameter id = 127, flags = 0, length = 500:37:15: average rate = 1250 bytes/sec, burst depth = 1000 bytes00:37:15: peak rate = 1250 bytes/sec00:37:15: min unit = 0 bytes, max pkt size = 0 bytes00:37:15: FILTER_SPEC type 7 length 12:00:37:15: Source 140.20.1.1, tunnel_id 900:37:15: LABEL type 1 length 8 :00:37:15: Labels:1600:37:15:00:37:15:RSVP:version:1 flags:0001 type:Ack cksum:34F5 ttl:255 reserved:0 length:2000:37:15: MESSAGE_ID_ACK type 1 length 12:00:37:15: Type:ACK00:37:15: ID:0x43 Epoch:0xE1A1B700:37:15: Flags:None00:37:15:00:37:17:%LINK-3-UPDOWN:Interface Tunnel100, changed state to up00:37:18:%LINEPROTO-5-UPDOWN:Line protocol on Interface Tunnel100, changed state to upRelated Commands
ip rsvp signalling refresh reduction
Enables refresh reduction.
show debug
Displays active debug output.
debug ip rsvp errors
To display informational debugging messages and messages about irregular events, use the debug ip rsvp errors command in privileged EXEC mode. To disable debugging output, use the no form of this command.
debug ip rsvp errors
no debug ip rsvp errors
Syntax Description
This command has no arguments or keywords.
Defaults
No default behavior or values
Command Modes
Privileged EXEC
Command History
12.2(13)T
This command was introduced.
12.0(29)S
This command was integrated into Cisco IOS Release 12.0(29)S.
Usage Guidelines
Use the debug ip rsvp errors command to display informational messages and messages about irregular events such as an incomplete setup or breakdown of an RSVP session. Informational messages do not necessarily indicate problems. It is useful to use this command if something has gone wrong, but you do not know what.
If you enter a different debug command, such as debug ip rsvp signalling, all the signalling errors and the normal signalling events are displayed. You do not have to also enter the debug ip rsvp errors command.
If there are many active RSVP sessions, enter the following configuration command to activate ACL filtering so that you will view only relevant debugging messages.
Router(config)# access-list number permit udp src_ip src_port dst_ip dst_portWhere
•
•
•
•
•
Then enter the following command to turn on ACL filtering:
Router# debug ip rsvp filterIn the following example, debugging is allowed only when the session is initiated from 192.168.1.4 toward 192.168.1.8, for Tunnel8 on the headend.
Note
Router(config)# access-list 101 permit udp host 192.168.1.4 host 192.168.1.8 eq 8Router# debug ip rsvp filterExamples
The following is sample output from the debug ip rsvp errors command:
Router# debug ip rsvp errors*May 21 08:54:31.918: RSVP: 5.1.1.1_68->7.1.1.1_3[5.1.1.1]: Problem parsing PATH message: MISFORMATTED object (13) C-Type (2)debug ip rsvp policy
To display debugging messages for Resource Reservation Protocol (RSVP) policy processing, use the debug ip rsvp policy command in privileged EXEC mode. To disable debugging output, use the no form of this command.
debug ip rsvp policy
no debug ip rsvp policy
Syntax Description
This command has no arguments or keywords.
Defaults
Debugging for RSVP policy processing is not enabled.
Command Modes
Privileged EXEC
Command History
12.1(1)T
This command was introduced.
12.0(23)S
This command was integrated into Cisco IOS Release 12.0(23)S.
Usage Guidelines
You might find it useful to enable the debug cops command when you are using the debug ip rsvp policy command. Together, these commands generate a complete record of the policy process.
Examples
The following example uses only the debug ip rsvp policy command:
Router-1# debug ip rsvp policyRSVP_POLICY debugging is on02:02:14:RSVP-POLICY:Creating outbound policy IDB entry for Ethernet2/0 (61E6AB38)02:02:14:RSVP-COPS:COPS query for Path message, 10.31.0.1_44->10.33.0.1_4402:02:14:RSVP-POLICY:Building incoming Path context02:02:14:RSVP-POLICY:Building outgoing Path context on Ethernet2/002:02:14:RSVP-POLICY:Build REQ message of 216 bytes02:02:14:RSVP-POLICY:Message sent to PDP02:02:14:RSVP-COPS:COPS engine called us with reason2, handle 6202A65802:02:14:RSVP-COPS:Received decision message02:02:14:RSVP-POLICY:Received decision for Path message02:02:14:RSVP-POLICY:Accept incoming message02:02:14:RSVP-POLICY:Send outgoing message to Ethernet2/002:02:14:RSVP-POLICY:Replacement policy object for path-in context02:02:14:RSVP-POLICY:Replacement TSPEC object for path-in context02:02:14:RSVP-COPS:COPS report for Path message, 10.31.0.1_44->10.33.0.1_4402:02:14:RSVP-POLICY:Report sent to PDP02:02:14:RSVP-COPS:COPS report for Path message, 10.31.0.1_44->10.33.0.1_44The following example uses both the debug ip rsvp policy and the debug cops commands:
Router-1# debug ip rsvp policyRSVP_POLICY debugging is onRouter-1# debug copsCOPS debugging is on02:15:14:RSVP-POLICY:Creating outbound policy IDB entry for Ethernet2/0 (61E6AB38)02:15:14:RSVP-COPS:COPS query for Path message, 10.31.0.1_44->10.33.0.1_4402:15:14:RSVP-POLICY:Building incoming Path context02:15:14:RSVP-POLICY:Building outgoing Path context on Ethernet2/002:15:14:RSVP-POLICY:Build REQ message of 216 bytes02:15:14:COPS:** SENDING MESSAGE **COPS HEADER:Version 1, Flags 0, Opcode 1 (REQ), Client-type:1, Length:216HANDLE (1/1) object. Length:8. 00 00 22 01CONTEXT (2/1) object. Length:8. R-type:5. M-type:1IN_IF (3/1) object. Length:12. Address:10.1.2.1. If_index:4OUT_IF (4/1) object. Length:12. Address:10.33.0.1. If_index:3CLIENT SI (9/1) object. Length:168. CSI data:02:15:14: SESSION type 1 length 12:02:15:14: Destination 10.33.0.1, Protocol_Id 17, Don't Police , DstPort 4402:15:14: HOP type 1 length 12:0A01020102:15:14: :0000000002:15:14: TIME_VALUES type 1 length 8 :0000753002:15:14: SENDER_TEMPLATE type 1 length 12:02:15:14: Source 10.31.0.1, udp_source_port 4402:15:14: SENDER_TSPEC type 2 length 36:02:15:14: version=0, length in words=702:15:14: Token bucket fragment (service_id=1, length=6 words02:15:14: parameter id=127, flags=0, parameter length=502:15:14: average rate=1250 bytes/sec, burst depth=10000 bytes02:15:14: peak rate =1250000 bytes/sec02:15:14: min unit=0 bytes, max unit=1514 bytes02:15:14: ADSPEC type 2 length 84:02:15:14: version=0 length in words=1902:15:14: General Parameters break bit=0 service length=802:15:14: IS Hops:102:15:14: Minimum Path Bandwidth (bytes/sec):125000002:15:14: Path Latency (microseconds):002:15:14: Path MTU:150002:15:14: Guaranteed Service break bit=0 service length=802:15:14: Path Delay (microseconds):19200002:15:14: Path Jitter (microseconds):120002:15:14: Path delay since shaping (microseconds):19200002:15:14: Path Jitter since shaping (microseconds):120002:15:14: Controlled Load Service break bit=0 service length=002:15:14:COPS:Sent 216 bytes on socket,02:15:14:RSVP-POLICY:Message sent to PDP02:15:14:COPS:Message event!02:15:14:COPS:State of TCP is 402:15:14:In read function02:15:14:COPS:Read block of 96 bytes, num=104 (len=104)02:15:14:COPS:** RECEIVED MESSAGE **COPS HEADER:Version 1, Flags 1, Opcode 2 (DEC), Client-type:1, Length:104HANDLE (1/1) object. Length:8. 00 00 22 01CONTEXT (2/1) object. Length:8. R-type:1. M-type:1DECISION (6/1) object. Length:8. COMMAND cmd:1, flags:0DECISION (6/3) object. Length:56. REPLACEMENT 00 10 0E 01 61 62 63 64 65 66 6768 69 6A 6B 6C 00 24 0C 02 0000 00 07 01 00 00 06 7F 00 00 05 44 9C 40 00 46 1C 40 00 49 9896 80 00 00 00 C8 00 00 01 C8CONTEXT (2/1) object. Length:8. R-type:4. M-type:1DECISION (6/1) object. Length:8. COMMAND cmd:1, flags:002:15:14:Notifying client (callback code 2)02:15:14:RSVP-COPS:COPS engine called us with reason2, handle 6202A10402:15:14:RSVP-COPS:Received decision message02:15:14:RSVP-POLICY:Received decision for Path message02:15:14:RSVP-POLICY:Accept incoming message02:15:14:RSVP-POLICY:Send outgoing message to Ethernet2/002:15:14:RSVP-POLICY:Replacement policy object for path-in context02:15:14:RSVP-POLICY:Replacement TSPEC object for path-in context02:15:14:RSVP-COPS:COPS report for Path message, 10.31.0.1_44->10.33.0.1_4402:15:14:COPS:** SENDING MESSAGE **COPS HEADER:Version 1, Flags 1, Opcode 3 (RPT), Client-type:1, Length:24HANDLE (1/1) object. Length:8. 00 00 22 01REPORT (12/1) object. Length:8. REPORT type COMMIT (1)02:15:14:COPS:Sent 24 bytes on socket,02:15:14:RSVP-POLICY:Report sent to PDP02:15:14:Timer for connection entry is zero02:15:14:RSVP-COPS:COPS report for Path message, 10.31.0.1_44->10.33.0.1_44Related Commands
debug ip rsvp rate-limit
To display debugging messages for Resource Reservation Protocol (RSVP) rate-limiting events, use the debug ip rsvp rate-limit command in privileged EXEC mode. To disable debugging output, use the no form of this command.
debug ip rsvp rate-limit
no debug ip rsvp rate-limit
Syntax Description
This command has no arguments or keywords.
Defaults
No default behavior or values
Command Modes
Privileged EXEC
Command History
12.2(13)T
This command was introduced.
12.0(24)S
This command was integrated into Cisco IOS Release 12.0(24)S.
Examples
The following command shows how to enable debugging for RSVP rate-limiting and message manager events:
Router# debug ip rsvp rate-limitRSVP rate-limit debugging is onRouter# debug ip rsvp msg-mgrRSVP msg-mgr debugging is onIn the following display, RSVP process information including messages, timers, neighbors IP addresses, and message IDs, appear:
01:00:19:RSVP-RATE-LIMIT:rsvp_msg_pacing_send_message01:00:19:RSVP-MSG-MGR (140.4.4.2):Starting timer msg-pacing interval 2001:00:19:RSVP-MSG-MGR (140.4.4.2):Enqueue element 27000405 of type 3 on msg-pacing TAIL01:00:19:RSVP-RATE-LIMIT:rsvp_msg_pacing_timer - timer expired01:00:19:RSVP-MSG-MGR (140.4.4.2):Dequeueing element 27000405 of type 3 from msg-pacing01:00:19:RSVP-RATE-LIMIT:rsvp_msg_pacing_send_qe:sending psb (qe 27000405)01:00:21:%LINK-3-UPDOWN:Interface Tunnel100, changed state to up01:00:22:%LINEPROTO-5-UPDOWN:Line protocol on Interface Tunnel100, changed state to up01:01:03:RSVP-RATE-LIMIT:rsvp_msg_pacing_send_message01:01:03:RSVP-MSG-MGR (140.4.4.2):Starting timer msg-pacing interval 2001:01:03:RSVP-MSG-MGR (140.4.4.2):Enqueue element 27000405 of type 3 on msg-pacing TAIL01:01:03:RSVP-RATE-LIMIT:rsvp_msg_pacing_timer - timer expired01:01:03:RSVP-MSG-MGR (140.4.4.2):Dequeueing element 27000405 of type 3 from msg-pacing01:01:03:RSVP-RATE-LIMIT:rsvp_msg_pacing_send_qe:sending psb (qe 27000405)01:01:42:RSVP-RATE-LIMIT:rsvp_msg_pacing_send_message01:01:42:RSVP-MSG-MGR (140.4.4.2):Starting timer msg-pacing interval 2001:01:42:RSVP-MSG-MGR (140.4.4.2):Enqueue element 27000405 of type 3 on msg-pacing TAIL01:01:42:RSVP-RATE-LIMIT:rsvp_msg_pacing_timer - timer expired01:01:42:RSVP-MSG-MGR (140.4.4.2):Dequeueing element 27000405 of type 3 from msg-pacing01:01:42:RSVP-RATE-LIMIT:rsvp_msg_pacing_send_qe:sending psb (qe 27000405)01:02:09:RSVP-RATE-LIMIT:rsvp_msg_pacing_send_message01:02:09:RSVP-MSG-MGR (140.4.4.2):Starting timer msg-pacing interval 2001:02:09:RSVP-MSG-MGR (140.4.4.2):Enqueue element 27000405 of type 3 on msg-pacing TAIL01:02:09:RSVP-RATE-LIMIT:rsvp_msg_pacing_timer - timer expired01:02:09:RSVP-MSG-MGR (140.4.4.2):Dequeueing element 27000405 of type 3 from msg-pacing01:02:09:RSVP-RATE-LIMIT:rsvp_msg_pacing_send_qe:sending psb (qe 27000405)Related Commands
ip rsvp signalling rate-limit
Controls the transmission rate for RSVP messages sent to a neighboring router during a specified interval.
show debug
Displays active debug output.
debug ip rsvp reliable-msg
To display debugging messages for Resource Reservation Protocol (RSVP) reliable messages events, use the debug ip rsvp reliable-msg command in privileged EXEC mode. To disable debugging output, use the no form of this command.
debug ip rsvp reliable-msg
no debug ip rsvp reliable-msg
Syntax Description
This command has no arguments or keywords.
Defaults
No default behavior or values
Command Modes
Privileged EXEC
Command History
12.2(13)T
This command was introduced.
12.0(24)S
This command was integrated into Cisco IOS Release 12.0(24)S.
Examples
The following command shows how to enable debugging for RSVP reliable messages events:
Router# debug ip rsvp reliable-msgRSVP reliable-msg debugging is onIn the following display, message IDs, acknowledgments (ACKs), and message processes including retransmissions, appear:
01:07:37:RSVP-RMSG:Inserted msg id(0x46, 0x48000403) on local msgid db01:07:37:RSVP-RMSG:rsvp_rmsg_process_acks, Handle:000C1701 neighbor:172.16.4.201:07:37:RSVP-RMSG:max_ids:1 q_sz:1 msg_sz:1500 ids_len:1432 num_objs:0 obj_len:0 nbr:172.16.4.201:07:39:%LINK-3-UPDOWN:Interface Tunnel100, changed state to up01:07:40:%LINEPROTO-5-UPDOWN:Line protocol on Interface Tunnel100, changed state to up01:08:07:RSVP-RMSG:rsvp_rmsg_process_acks, Handle:000C1701 neighbor:172.16.4.201:08:07:RSVP-RMSG:max_ids:1 q_sz:1 msg_sz:1500 ids_len:1432 num_objs:0 obj_len:0 nbr:172.16.4.201:08:37:RSVP-RMSG:max_ids:1 q_sz:1 msg_sz:1500 ids_len:1424 num_objs:1 obj_len:8 nbr:172.16.4.201:08:37:RSVP-RMSG:rsvp_rmsg_process_immediate_tmb, Handle:2D000404 neighbor:172.16.4.201:08:37:RSVP-RMSG:Inserted msg id(0x47, 0x2D000404) on local msgid db01:08:37:RSVP-RMSG:current queue:immed next_queue:rxmt-1 (qe 2D000404s)01:08:37:RSVP-RMSG:rsvp_rmsg_process_acks, Handle:000C1701 neighbor:172.16.4.201:08:37:RSVP-RMSG:max_ids:1 q_sz:1 msg_sz:1500 ids_len:1432 num_objs:0 obj_len:0 nbr:172.16.4.201:08:38:RSVP-RMSG:rsvp_rmsg_process_rxmt_tmb, Handle:2D000404 neighbor:172.16.4.201:08:38:RSVP-RMSG:An ack was received for tmb 2D000404 on neighbor 172.16.4.201:09:07:RSVP-RMSG:max_ids:1 q_sz:1 msg_sz:1500 ids_len:1424 num_objs:1 obj_len:8 nbr:172.16.4.201:09:07:RSVP-RMSG:rsvp_rmsg_process_immediate_tmb, Handle:2E000404 neighbor:172.16.4.201:09:07:RSVP-RMSG:Inserted msg id(0x48, 0x2E000404) on local msgid db01:09:07:RSVP-RMSG:current queue:immed next_queue:rxmt-1 (qe 2E000404s)01:09:07:RSVP-RMSG:rsvp_rmsg_process_acks, Handle:000C1701 neighbor:172.16.4.201:09:07:RSVP-RMSG:max_ids:1 q_sz:1 msg_sz:1500 ids_len:1432 num_objs:0 obj_len:0 nbr:172.16.4.201:09:08:RSVP-RMSG:rsvp_rmsg_process_rxmt_tmb, Handle:2E000404 neighbor:172.16.4.201:09:08:RSVP-RMSG:An ack was received for tmb 2E000404 on neighbor 172.16.4.201:09:37:RSVP-RMSG:max_ids:1 q_sz:1 msg_sz:1500 ids_len:1424 num_objs:1 obj_len:8 nbr:172.16.4.201:09:37:RSVP-RMSG:rsvp_rmsg_process_immediate_tmb, Handle:2F000404 neighbor:172.16.4.201:09:37:RSVP-RMSG:Inserted msg id(0x49, 0x2F000404) on local msgid db01:09:37:RSVP-RMSG:current queue:immed next_queue:rxmt-1 (qe 2F000404s)01:09:37:RSVP-RMSG:rsvp_rmsg_process_acks, Handle:000C1701 neighbor:172.16.4.201:09:37:RSVP-RMSG:max_ids:1 q_sz:1 msg_sz:1500 ids_len:1432 num_objs:0 obj_len:0 nbr:172.16.4.201:09:38:RSVP-RMSG:rsvp_rmsg_process_rxmt_tmb, Handle:2F000404 neighbor:172.16.4.201:09:38:RSVP-RMSG:An ack was received for tmb 2F000404 on neighbor 172.16.4.2Related Commands
ip rsvp signalling refresh reduction
Enables refresh reduction.
show debug
Displays active debug output.
debug ip rsvp sbm
To display detailed information about Subnetwork Bandwidth Manager (SBM) messages only, and SBM and Designated Subnetwork Bandwidth Manager (DSBM) state transitions, use the debug ip rsvp sbm command in privileged EXEC mode. To disable debugging output, use the no form of this command.
debug ip rsvp sbm
no debug ip rsvp sbm
Syntax Description
This command has no arguments or keywords.
Defaults
Disabled
Command Modes
Privileged EXEC
Command History
Usage Guidelines
The debug ip rsvp sbm command provides information about messages received, minimal detail about the content of these messages, and information about state transitions.
Examples
The following example shows the detailed debug information about SBM and the SBM and DSBM state transitions that is available when you enable debug mode through the debug ip rsvp sbm command:
Router# debug ip rsvp sbmRSVP debugging is onrouter2#*Dec 31 16:45:34.659: RSVP: send I_AM_DSBM message from 145.2.2.150*Dec 31 16:45:34.659: RSVP: IP to 224.0.0.17 length=88 checksum=9385 (Ethernet2)*Dec 31 16:45:34.659: RSVP: version:1 flags:0000 type:I_AM_DSBM cksum:9385 ttl:254 reserved:0 length:88*Dec 31 16:45:34.659: DSBM_IP_ADDR type 1 length 8 : 91020296*Dec 31 16:45:34.659: HOP_L2 type 1 length 12: 00E01ECE*Dec 31 16:45:34.659: : 0F760000*Dec 31 16:45:34.659: SBM_PRIORITY type 1 length 8 : 0029B064*Dec 31 16:45:34.659: DSBM_TIMERS type 1 length 8 : 00000F05*Dec 31 16:45:34.659: SBM_INFO type 1 length 44: 00000000*Dec 31 16:45:34.659: : 00240C02 00000007*Dec 31 16:45:34.659: : 01000006 7F000005*Dec 31 16:45:34.659: : 00000000 00000000*Dec 31 16:45:34.663: : 00000000 00000000*Dec 31 16:45:34.663: : 00000000*Dec 31 16:45:34.663:Related Commands
debug ip rsvp summary-refresh
To display debugging messages for Resource Reservation Protocol (RSVP) summary-refresh messages events, use the debug ip rsvp summary-refresh command in privileged EXEC mode. To disable debugging output, use the no form of this command.
debug ip rsvp summary-refresh
no debug ip rsvp summary-refresh
Syntax Description
This command has no arguments or keywords.
Defaults
No default behavior or values
Command Modes
Privileged EXEC
Command History
12.2(13)T
This command was introduced.
12.0(24)S
This command was integrated into Cisco IOS Release 12.0(24)S.
Examples
The following command shows how to enable debugging for RSVP summary-refresh messages events:
Router# debug ip rsvp summary-refreshRSVP summary-refresh debugging is onIn the following output, the IP addresses, the interfaces, the types of RSVP messages (Path and Resv), message IDs, and epoch identifiers (for routers) for which RSVP summary-refresh events occur are shown:
01:11:00:RSVP-SREFRESH:Incoming message from nbr 172.16.4.2 with epoch:0xE1A1B7 msgid:0x84
on Ethernet1
01:11:00:RSVP-SREFRESH 172.16.1.1_18->172.18.1.1_100[172.16.1.1]:Created msgid 0x84 for nbr 140.4.4.201:11:02:%LINK-3-UPDOWN:Interface Tunnel100, changed state to up01:11:03:%LINEPROTO-5-UPDOWN:Line protocol on Interface Tunnel100, changed state to up01:11:30:RSVP-SREFRESH:172.16.1.1_18->172.18.1.1_100[172.16.1.1]:Path, ID:0x4C :Start using Srefresh to 172.16.4.201:11:31:RSVP-SREFRESH:Incoming message from nbr 140.4.4.2 with epoch:0xE1A1B7 msgid:0x84 on Ethernet101:11:31:RSVP-SREFRESH:State exists for nbr:172.16.4.2 epoch:0xE1A1B7 msgid:0x8401:12:00:RSVP-SREFRESH:Preparing to Send Srefresh(es) to 172.16.4.2, 1 IDs Total01:12:00:RSVP-SREFRESH:Sending 1 IDs in this Srefresh01:12:00:RSVP-SREFRESH:172.16.1.1_18->172.18.1.1_100[172.16.1.1]:Path, ID:0x4C01:12:01:RSVP-SREFRESH:Incoming message from nbr 172.16.4.2 with epoch:0xE1A1B7 msgid:0x86 on Ethernet101:12:01:RSVP-SREFRESH:Rec'd 1 IDs in Srefresh from 172.16.4.2 (on Ethernet1), epoch:0xE1A1B7 msgid:0x8601:12:01:RSVP-SREFRESH:172.16.1.1_18->172.18.1.1_100[172.16.1.1]:Resv, ID:0x8401:12:30:RSVP-SREFRESH:Preparing to Send Srefresh(es) to 172.16.4.2, 1 IDs Total01:12:30:RSVP-SREFRESH:Sending 1 IDs in this Srefresh01:12:30:RSVP-SREFRESH:172.16.1.1_18->172.18.1.1_100[172.16.1.1]:Path, ID:0x4C01:12:31:RSVP-SREFRESH:Incoming message from nbr 172.16.4.2 with epoch:0xE1A1B7 msgid:0x88 on Ethernet101:12:31:RSVP-SREFRESH:Rec'd 1 IDs in Srefresh from 172.16.4.2 (on Ethernet1), epoch:0xE1A1B7 msgid:0x8801:12:31:RSVP-SREFRESH:172.16.1.1_18->172.18.1.1_100[172.16.1.1]:Resv, ID:0x8401:13:00:RSVP-SREFRESH:Preparing to Send Srefresh(es) to 172.16.4.2, 1 IDs Total01:13:00:RSVP-SREFRESH:Sending 1 IDs in this Srefresh01:13:00:RSVP-SREFRESH:172.16.1.1_18->172.18.1.1_100[172.16.1.1]:Path, ID:0x4C01:13:01:RSVP-SREFRESH:Incoming message from nbr 172.16.4.2 with epoch:0xE1A1B7 msgid:0x8A on Ethernet101:13:01:RSVP-SREFRESH:Rec'd 1 IDs in Srefresh from 172.16.4.2 (on Ethernet1), epoch:0xE1A1B7 msgid:0x8A01:13:01:RSVP-SREFRESH:172.16.1.1_18->172.18.1.1_100[172.16.1.1]:Resv, ID:0x84
Note
Related Commands
ip rsvp signalling refresh reduction
Enables refresh reduction.
show debug
Displays active debug output.
debug ip rsvp traffic-control
To display debugging messages for compression-related events, use the debug ip rsvp traffic-control command in privileged EXEC mode. To disable debugging output, use the no form of this command.
debug ip rsvp traffic-control
no debug ip rsvp traffic-control
Syntax Description
This command has no arguments or keywords.
Defaults
This command is disabled.
Command Modes
Privileged EXEC
Command History
Usage Guidelines
Use the debug ip rsvp traffic-control command to troubleshoot compression-related problems.
Examples
The following example from the debug ip rsvp traffic-control command shows that compression was successfully predicted:
Router# debug ip rsvp traffic-controlRSVP debugging is onRouter# show debugging00:44:49: RSVP-TC: Attempting to install QoS for rsb 62CC66F000:44:49: RSVP-TC: Adding new tcsb 02000406 for rsb 62CC66F000:44:49: RSVP-TC: Assigning WFQ QoS (on FR VC 101) to tcsb 0200040600:44:49: RSVP-TC: Predicted compression for TCSB 2000406:00:44:49: RSVP-TC: method = rtp00:44:49: RSVP-TC: context ID = 200:44:49: RSVP-TC: factor = 82 percent00:44:49: RSVP-TC: bytes-saved = 36 bytes00:44:49: RSVP-TC: Bandwidth check: requested bw=65600 old bw=000:44:49: RSVP-TC: RSVP bandwidth is available00:44:49: RSVP-TC: Consulting policy for tcsb 0200040600:44:49: RSVP-TC: Policy granted QoS for tcsb 0200040600:44:49: RSVP-TC: Requesting QoS for tcsb 0200040600:44:49: RSVP-TC: ( r = 8200 bytes/s M = 164 bytes00:44:49: RSVP-TC: b = 328 bytes m = 164 bytes )00:44:49: RSVP-TC: p = 10000 bytes/s Service Level = priority00:44:49: RSVP-WFQ: Update for tcsb 02000406 on FR PVC dlci 101 on Se3/000:44:49: RSVP-WFQ: Admitted 66 kbps of bandwidth00:44:49: RSVP-WFQ: Allocated PRIORITY queue 2400:44:49: RSVP-TC: Allocation succeeded for tcsb 02000406The following example from the debug ip rsvp traffic-control command shows that compression was unsuccessfully predicted because no compression context IDs were available:
Router# debug ip rsvp traffic-controlRSVP debugging is onRouter# show debugging00:10:16:RSVP-TC:Attempting to install QoS for rsb 62CED62C00:10:16:RSVP-TC:Adding new tcsb 01000421 for rsb 62CED62C00:10:16:RSVP-TC:Assigning WFQ QoS (on FR VC 101) to tcsb 0100042100:10:16:RSVP-TC:sender's flow is not rtp compressible for TCSB 100042100:10:16: reason: no contexts available00:10:16:RSVP-TC:sender's flow is not udp compressible for TCSB 100042100:10:16: reason: no contexts available00:10:16:RSVP-TC:Bandwidth check:requested bw=80000 old bw=000:10:16:RSVP-TC:RSVP bandwidth is available00:10:16:RSVP-TC:Consulting policy for tcsb 0100042100:10:16:RSVP-TC:Policy granted QoS for tcsb 0100042100:10:16:RSVP-TC:Requesting QoS for tcsb 0100042100:10:16:RSVP-TC: ( r = 10000 bytes/s M = 200 bytes00:10:16:RSVP-TC: b = 400 bytes m = 200 bytes )00:10:16:RSVP-TC: p = 10000 bytes/s Service Level = priority00:10:16:RSVP-WFQ:Update for tcsb 01000421 on FR PVC dlci 101 on Se3/000:10:16:RSVP-WFQ:Admitted 80 kbps of bandwidth00:10:16:RSVP-WFQ:Allocated PRIORITY queue 2400:10:16:RSVP-TC:Allocation succeeded for tcsb 01000421Related Commands
debug ip rsvp wfq
To display debugging messages for the weighted fair queue (WFQ), use the debug ip rsvp wfq command in privileged EXEC mode. To disable debugging output, use the no form of this command.
debug ip rsvp wfq
no debug ip rsvp wfq
Syntax Description
This command has no arguments or keywords.
Defaults
No default behavior or values
Command Modes
Privileged EXEC
Command History
12.1(3)T
This command was introduced.
12.0(24)S
This command was integrated into Cisco IOS Release 12.0(24)S.
Examples
The following is sample output from the debug ip rsvp wfq command:
Router# debug ip rsvp wfqRSVP debugging is onRouter# show debuggingIP RSVP debugging is onIP RSVP debugging (Traffic Control events) is onIP RSVP debugging (WFQ events) is onRouter#03:03:23:RSVP-TC:Attempting to install QoS for rsb 6268A53803:03:23:RSVP-TC:Adding new tcsb 00001A01 for rsb 6268A53803:03:23:RSVP-TC:Assigning WFQ QoS to tcsb 00001A0103:03:23:RSVP-TC:Consulting policy for tcsb 00001A0103:03:23:RSVP-TC:Policy granted QoS for tcsb 00001A0103:03:23:RSVP-TC:Requesting QoS for tcsb 00001A0103:03:23:RSVP-TC: ( r = 12500 bytes/s M = 1514 bytes03:03:23:RSVP-TC: b = 1000 bytes m = 0 bytes )03:03:23:RSVP-TC: p = 12500 bytes/s Service Level = non-priority03:03:23:RSVP-WFQ:Requesting a RESERVED queue on Et0/1 for tcsb 00001A0103:03:23:RSVP-WFQ:Queue 265 allocated for tcsb 00001A0103:03:23:RSVP-TC:Allocation succeeded for tcsb 00001A01Router#Router# no debug ip rsvpRSVP debugging is offRelated Commands
debug ip rtp header-compression
To display events specific to Real-Time Transport Protocol (RTP) header compression, use the debug ip rtp header-compression command in privileged EXEC mode. To disable debugging output, use the no form of this command.
debug ip rtp header-compression
no debug ip rtp header-compression
Syntax Description
This command has no arguments or keywords.
Command Modes
Privileged EXEC
Examples
The following is sample output from the debug ip rtp header-compression command:
Router# debug ip rtp header-compressionRHC BRI0: rcv compressed rtp packetRHC BRI0: context0: expected sequence 0, received sequence 0RHC BRI0: rcv compressed rtp packetRHC BRI0: context0: expected sequence 1, received sequence 1RHC BRI0: rcv compressed rtp packetRHC BRI0: context0: expected sequence 2, received sequence 2RHC BRI0: rcv compressed rtp packetRHC BRI0: context0: expected sequence 3, received sequence 3Table 160 describes the significant fields shown in the display.
Related Commands
debug ip rtp packets
Displays a detailed dump of packets specific to RTP header compression.
debug ip rtp packets
To display a detailed dump of packets specific to Real-Time Transport Protocol (RTP) header compression, use the debug ip rtp packets command in privileged EXEC mode. To disable debugging output, use the no form of this command.
debug ip rtp packets
no debug ip rtp packets
Syntax Description
This command has no arguments or keywords.
Command Modes
Privileged EXEC
Examples
The following is sample output from the debug ip rtp packets command:
Router# debug ip rtp packetsRTP packet dump:IP: source: 171.68.8.10, destination: 224.2.197.169, id: 0x249B, ttl: 9,TOS: 0 prot: 17,UDP: source port: 1034, destination port: 27404, checksum: 0xB429,len: 152RTP: version: 2, padding: 0, extension: 0, marker: 0,payload: 3, ssrc 2369713968,sequence: 2468, timestamp: 85187180, csrc count: 0Table 161 describes the significant fields shown in the display.
Table 161 debug ip rtp packets Field Descriptions
id
IP identification.
ttl
IP time to live (TTL).
len
Total UDP length.
Related Commands
debug ip rtp header-compression
Displays events specific to RTP header compression.
debug ip scp
To troubleshoot secure copy (SCP) authentication problems, use the debug ip scp command in privileged EXEC mode. To disable debugging output, use the no form of this command.
debug ip scp
no debug ip scp
Syntax Description
This command has no arguments or keywords.
Command Modes
Privileged EXEC
Command History
Examples
The following example is output from the debug ip scp command. In this example, a copy of the file scptest.cfg from a UNIX host running configuration of the router was successful.
Router# debug ip scp4d06h:SCP:[22 -> 10.11.29.252:1018] send <OK>4d06h:SCP:[22 <- 10.11.29.252:1018] recv C0644 20 scptest.cfg4d06h:SCP:[22 -> 10.11.29.252:1018] send <OK>4d06h:SCP:[22 <- 10.11.29.252:1018] recv 20 bytes4d06h:SCP:[22 <- 10.11.29.252:1018] recv <OK>4d06h:SCP:[22 -> 10.11.29.252:1018] send <OK>4d06h:SCP:[22 <- 10.11.29.252:1018] recv <EOF>The following example is also output from the debug ip scp command, but in this example, the user has privilege 0 and is therefore denied:
Router# debug ip scp4d06h:SCP:[22 -> 10.11.29.252:1018] send Privilege denied.Related Commands
![]()
![]()
![]()
![]()
![]()
![]()
![]()
![]()
Posted: Thu Aug 2 02:10:50 PDT 2007
All contents are Copyright © 1992--2007 Cisco Systems, Inc. All rights reserved.
Important Notices and Privacy Statement.