|
|

Table Of Contents
debug frame-relay informationelements
debug frame-relay ip tcp header-compression
debug frame-relay networklayerinterface
debug gprs gtp ppp-regeneration
debug fax dmsp
To troubleshoot the fax Document Media Service Provider (DMSP), use the debug fax dmsp command in privileged EXEC mode. To disable debugging output, use the no form of this command.
debug fax dmsp [all | default | detail | error [call [informational] | software [informational]] | event | function | inout]
no debug fax dmsp
Syntax Description
Defaults
Debugging is not enabled.
Command Modes
Privileged EXEC
Command History
12.3(8)T
This command replaces the debug dmsp doc-to-fax and debug dmsp fax-to-doc commands.
Examples
The following is sample output from the debug fax dmsp all command:
Router# debug fax dmsp all2d07h: //70/67D6061D8012/DMSP/docmsp_call_setup_request:ramp data dir=ONRAMP, conf dir=DEST2d07h: //70/67D6061D8012/DMSP/docmsp_caps_ind:cid(0x46), srcCallID(0x44)2d07h: //70/67D6061D8012/DMSP/docmsp_bridge:conf id(0x33), srcCallID(0x46), dstCallID(0x44),ramp data dir=ONRAMP, conf dir=DEST, encode out=12d07h: //70/67D6061D8012/DMSP/docmsp_bridge:Bridge done2d07h: //70/67D6061D8012/DMSP/docmsp_bridge:conf id(0x34), srcCallID(0x46), dstCallID(0x45),ramp data dir=ONRAMP, conf dir=SRC, encode out=12d07h: //70/67D6061D8012/DMSP/docmsp_bridge:Bridge done2d07h: //70/67D6061D8012/DMSP/docmsp_xmit:srcCallID(0x44), dstCallID(0x46), direction=02d07h: //68/67D6061D8012/DMSP/docmsp_process_rcv_data:evID=0, proto_flag=3, srcCallID(0x44), dstCallID(0x46)2d07h: //70/67D6061D8012/DMSP_ON/docmsp_tiff_writer_data_process:START_OF_CONNECTION2d07h: //70/67D6061D8012/DMSP_ON/docmsp_tiff_writer_data_process:START_OF_FAX_PAGE2d07h: //70/67D6061D8012/DMSP_ON/docmsp_tiff_writer_get_buffer_callback:tiff_segment=0x63A88ECC2d07h: //70/67D6061D8012/DMSP_ON/docmsp_tiff_writer_get_buffer_callback:tiff_segment=0x63D589442d07h: //70/67D6061D8012/DMSP/docmsp_process_rcv_data:DoneTable 89 describes the significant fields shown in the display.
debug fax fmsp
To troubleshoot the Fax Media Service Provider (FMSP), use the debug fax fmsp command in privileged EXEC mode. To disable debugging output, use the no form of this command.
debug fax fmsp [all | default | detail | error [call [informational] | software [informational]] | event | function | inout | receive | send]
no debug fax fmsp
Syntax Description
Defaults
Debugging is not enabled.
Command Modes
Privileged EXEC
Command History
12.3(8)T
This command replaces the debug fmsp receive and debug fmsp send commands.
Examples
The following is sample output from the debug fax fmsp all command:
Router# debug fax fmsp all2d08h: //76/90A52CB88014/FMSP/faxmsp_call_setup_request:session(0x63A8A474), vdbPtr(0x62CA45A8),data dir=ONRAMP, conf dir=DEST2d08h: //76/90A52CB88014/FMSP/faxmsp_bridge:confID(0x38), srcCID(0x4C), dstCID(0x4B)2d08h: //76/90A52CB88014/FMSP/faxmsp_bridge:ramp data dir=ONRAMP, conf dir=DEST2d08h: //76/90A52CB88014/FMSP/faxmsp_bridge:Explicit caps ind. done; Wait for registry cap ind2d08h: //76/90A52CB88014/FMSP/faxmsp_caps_ind:per_bridge_info(0x63D52FD8), cap_ind_state(0x6)2d08h: //76/90A52CB88014/FMSP/faxmsp_caps_ind[1617]:2d08h: //76/90A52CB88014/FMSP/faxmsp_caps_ack:direction=0, srcCID(0x4B), dstCID(0x0)2d08h: //76/90A52CB88014/FMSP/faxmsp_codec_download_done:per_bridge_info(0x63D52FD8), application_data(0x63C54698), state(0x2), direction=22d08h: //76/90A52CB88014/FMSP/faxMsp_get_tx_buffer:event(0x402897C0), bufferBegin(0x63A86B5C), dataBegin(0x402897EC)2d08h: //76/90A52CB88014/FMSP/faxMsp_get_tx_buffer:event(0x40289B50), bufferBegin(0x63C55794), dataBegin(0x40289B7C)2d08h: //76/90A52CB88014/FMSP/faxMsp_get_tx_buffer:event(0x40851E58), bufferBegin(0x63D4EAE4), dataBegin(0x40851E84)2d08h: //76/90A52CB88014/FMSP/faxmsp_xmit:srcCallID(0x4B), dstCallID(0x4C)2d08h: //76/90A52CB88014/FMSP/faxmsp_xmit[1813]:2d08h: //76/90A52CB88014/FMSP/faxmsp_process_rcv_data:state(0x1), evID=918065, evProtoFlag=22d08h: //76/90A52CB88014/FMSP/t38_rx_buffer:t38 rx msg dump (size=6):00 00 01 00 00 002d08h: //76/90A52CB88014/FMSP/faxmsp_process_rcv_data[1994]:2d08h: //76/90A52CB88014/FMSP/fax2_phaseB_receive:CSI_PACKET(8881111)DIS_PACKET(speed=5, resolution=1, encoding=1)2d08h: //76/90A52CB88014/FMSP/faxMsp_get_tx_buffer:event(0x40289690), bufferBegin(0x63A7E798), dataBegin(0x402896BC)2d08h: //76/90A52CB88014/FMSP/faxMsp_get_tx_buffer:event(0x4028858C), bufferBegin(0x63B89AC0), dataBegin(0x402885B8)2d08h: //76/90A52CB88014/FMSP/t38_tx_command:t38 tx msg dump (size=47):00 04 2A C0 04 80 00 16 FF C0 02 8C 8C 8C 8C 1C 1C 1C 04 0404 04 04 04 04 04 04 04 04 04 04 28 00 09 FF C8 01 00 77 1F01 01 19 80 40 00 002d08h: //76/90A52CB88014/FMSP/fax2_phaseB_receive:fax2_response_receive, PROCESSINGTable 90 describes the significant fields shown in the display.
debug fax foip
To troubleshoot fax mail, use the debug fax foip command in privileged EXEC mode. To disable debugging output, use the no form of this command.
debug fax foip [all | default | detail | error [call [informational] | software [informational]] | event | function | inout]
no debug fax foip
Syntax Description
Defaults
Debugging is not enabled.
Command Modes
Privileged EXEC
Command History
12.3(8)T
This command replaces the debug foip off-ramp and debug foip on-ramp commands.
Examples
The following is sample output from the debug fax foip all command:
Router# debug fax foip all2d07h: //35/67E715B7800A/FOIP_ON/lapp_on_call_handoff:Authentication:Id: 0Method: IVR or unknownStatus: SUCCESSEnabled: FALSETemplate:List: faxMailtoAddress: Calling Oct3A=0x02d07h: //35/67E715B7800A/FOIP_ON/lapp_on_conference_vtsp_fmsp:Begin Conferencing VTSP and FMSP2d07h: //35/67E715B7800A/FOIP_ON/lapp_on_conference_vtsp_fmsp[887]:2d07h: //35/67E715B7800A/FOIP_ON/lapp_on_change_state:Old State=0, New State=12d07h: //35/67E715B7800A/FOIP_ON/lapp_on_call_handoff[2953]:2d07h: //35/67E715B7800A/FOIP_ON/lapp_on_validate_context[930]:2d07h: //35/67E715B7800A/FOIP_ON/lapp_on_conference_created:VTSP and FMSP Are Conferenced;Waiting for FMSP Call Detail Event2d07h: //35/67E715B7800A/FOIP_ON/lapp_on_change_state:Old State=1, New State=22d07h: %ISDN-6-CONNECT: Interface Serial2:30 is now connected to unknown2d07h: //35/67E715B7800A/FOIP_ON/lapp_on_validate_context[930]:2d07h: //35/67E715B7800A/FOIP_ON/lapp_on_msp_event:2d07h: //35/67E715B7800A/FOIP_ON/lapp_on_setup_mspi:Prepare MSPI Call Setup Request2d07h: //35/67E715B7800A/FOIP_ON/lapp_on_setup_mspi:Envelope From=FAX=7771111@cisco.com2d07h: //35/67E715B7800A/FOIP_ON/lapp_on_setup_mspi:Envelope To=jdoe@server.cisco.com2d07h: //35/67E715B7800A/FOIP_ON/lapp_on_setup_mspi:RFC822 To Comment=dileung2d07h: //35/67E715B7800A/FOIP_ON/lapp_on_setup_mspi:Faxmail Subject=hagar-c5300-bw12 subject line here2d07h: //35/67E715B7800A/FOIP_ON/lapp_on_setup_mspi:Disposition Notification=2d07h: //35/67E715B7800A/FOIP_ON/lapp_on_setup_mspi:Originator TSI=RFC822 From Comment=2d07h: //35/67E715B7800A/FOIP_ON/lapp_on_setup_mspi:Auth/Account ID: `0'2d07h: //35/67E715B7800A/FOIP_ON/lapp_on_setup_mspi:Call Setup Request To MSPI2d07h: //37/67E715B7800A/FOIP_ON/lapp_on_setup_mspi[748]:2d07h: //35/67E715B7800A/FOIP_ON/lapp_on_conference_fmsp_dmsp:Starting Conference with FMSP and DMSP2d07h: //35/67E715B7800A/FOIP_ON/lapp_on_conference_fmsp_dmsp:Tiff File Created; Time=2003:06:05 22:46:48Table 91 describes the significant fields shown in the display.
debug fax mmoip aaa
To display output relating to authentication, authorization, and accounting (AAA) services using multimedia mail over IP (MMoIP) for the Store and Forward Fax feature, use the debug fax mmoip aaa command in privileged EXEC mode. To disable debugging output, use the no form of this command.
debug fax mmoip aaa [all | default | error [call [informational] | software [informational]] | inout]
no debug fax mmoip aaa
Syntax Description
Defaults
Debugging is not enabled.
Command Modes
Privileged EXEC
Command History
Examples
The following example shows output from the debug fax mmoip aaa all command for an onramp fax connection:
Router# debug fax mmoip aaa all16:22:04: //3/D9242FD08002/MMOIP_AAA_ON/mmoip_aaa_accounting_onramp:UID=316:22:04: //3/D9242FD08002/MMOIP_AAA_ON/mmoip_aaa_accounting_onramp:fax_account_id_origin=NONE_ID16:22:04: //3/D9242FD08002/MMOIP_AAA_ON/mmoip_aaa_accounting_onramp:fax_msg_id=00012003151904623@Router.cisco.com, Length=3916:22:04: //3/D9242FD08002/MMOIP_AAA_ON/mmoip_aaa_accounting_onramp:fax_pages=016:22:04: //3/D9242FD08002/MMOIP_AAA_ON/mmoip_aaa_accounting_onramp:fax_connect_speed=disable bps16:22:04: //3/D9242FD08002/MMOIP_AAA_ON/mmoip_aaa_accounting_onramp:fax_mdn_flag=FALSE16:22:04: //3/D9242FD08002/MMOIP_AAA_ON/mmoip_aaa_accounting_onramp:fax_auth_status=USER NOT AUTHENTICATED16:22:04: //3/D9242FD08002/MMOIP_AAA_ON/mmoip_aaa_accounting_onramp:email_server_address=172.19.140.11216:22:04: //3/D9242FD08002/MMOIP_AAA_ON/mmoip_aaa_accounting_onramp:email_server_ack_flag=TRUE16:22:04: //3/D9242FD08002/MMOIP_AAA_ON/mmoip_aaa_accounting_onramp:gateway_id=Router.cisco.com16:22:04: //3/D9242FD08002/MMOIP_AAA_ON/mmoip_aaa_accounting_onramp:call_type=Fax Receive16:22:04: //3/D9242FD08002/MMOIP_AAA_ON/mmoip_aaa_accounting_onramp:abort_cause=10Table 92 describes the significant fields shown in the display.
debug fax mspi
To troubleshoot the fax Mail Service Provider Interface (MSPI), use the debug fax mspi command in privileged EXEC mode. To disable debugging output, use the no form of this command.
debug fax mspi [all | default | detail | error [call [informational] | software [informational]] | event | function | inout]
no debug fax mspi
Syntax Description
Defaults
Debugging is not enabled.
Command Modes
Privileged EXEC
Command History
12.3(8)T
This command replaces the debug mspi receive and debug mspi send commands.
Examples
The following is sample output from the debug fax mspi all command:
Router# debug fax mspi allRouter#2d07h: %ISDN-6-CONNECT: Interface Serial2:30 is now connected to unknown2d07h: //41/ACF704FA800B/MSPI_ON/mspi_call_setup_request:Outgoing Peer Tag=22Envelope From=FAX=5550121@cisco.comEnvelope To=jdoe@server.cisco.comMime Outer Type=22d07h: //41/ACF704FA800B/MSPI_ON/mspi_check_connect:MMccb(Count=0)2d07h: //41/ACF704FA800B/MSPI_ON/mspi_check_connect:SMTP Connected To The Server !2d07h: //41/ACF704FA800B/MSPI/mspi_bridge:MMccb(State=CONNECTED, Type=Onramp), Destination Call Id=0x2A2d07h: //41/ACF704FA800B/MSPI_ON/mspi_xmit:MMccb(State=CONFERENCED, Type=Onramp, Buffer Count=0), Source Call Id=0x2A2d07h: //41/ACF704FA800B/MSPI_ON/mspi_xmit:MMccb(State=CONFERENCED, Type=Onramp, Buffer Count=1), Source Call Id=0x2A2d07h: //41/ACF704FA800B/MSPI_ON/mspi_xmit:MMccb(State=CONFERENCED, Type=Onramp, Buffer Count=2), Source Call Id=0x2A2d07h: //41/ACF704FA800B/MSPI_ON/mspi_xmit:MMccb(State=CONFERENCED, Type=Onramp, Buffer Count=3), Source Call Id=0x2A2d07h: //41/ACF704FA800B/MSPI_ON/mspi_onramp_buff_finished_callback:MMccb(Call State=CONFERENCED, Buffer Count=9)2d07h: //41/ACF704FA800B/MSPI_ON/mspi_onramp_buff_finished_callback:MMccb(Call State=CONFERENCED, Buffer Count=8)2d07h: //41/ACF704FA800B/MSPI_ON/mspi_onramp_buff_finished_callback:MMccb(Call State=CONFERENCED, Buffer Count=7)2d07h: //41/ACF704FA800B/MSPI_ON/mspi_onramp_buff_finished_callback:2d07h: //41/ACF704FA800B/MSPI_ON/mspi_xmit:MMccb(State=CONFERENCED, Type=Onramp, Buffer Count=0), Source Call Id=0x2A2d07h: //41/ACF704FA800B/MSPI_ON/mspi_xmit:MMccb(State=CONFERENCED, Type=Onramp, Buffer Count=1), Source Call Id=0x2A2d07h: //41/ACF704FA800B/MSPI_ON/mspi_xmit:MMccb(State=CONFERENCED, Type=Onramp, Buffer Count=2), Source Call Id=0x2A2d07h: //41/ACF704FA800B/MSPI_ON/mspi_xmit:MMccb(State=CONFERENCED, Type=Onramp, Buffer Count=3), Source Call Id=0x2A2d07h: //41/ACF704FA800B/MSPI_ON/mspi_xmit:MMccb(State=CONFERENCED, Type=Onramp, Buffer Count=4), Source Call Id=0x2A2d07h: //41/ACF704FA800B/MSPI_ON/mspi_xmit:MMccb(State=CONFERENCED, Type=Onramp, Buffer Count=5), Source Call Id=0x2ARouter#Table 93 describes the significant fields shown in the display.
debug fax mta
To troubleshoot the fax Mail Transfer Agent (MTA), use the debug fax mta command in privileged EXEC mode. To disable debugging output, use the no form of this command.
debug fax mta [all | default | detail | error [call [informational] | software [informational]] | event | function | inout]
no debug fax mta
Syntax Description
Defaults
Debugging is not enabled.
Command Modes
Privileged EXEC
Command History
12.3(8)T
This command replaces the debug mta receive all, debug mta send all, and debug mta send rcpt-to commands.
Examples
The following is sample output from the debug fax mta all command:
Router# debug fax mta all2d07h: %ISDN-6-CONNECT: Interface Serial2:30 is now connected to unknown2d07h: //-1/CEB9FA0B800E/SMTPC/esmtp_client_engine_new_context_guid[2177]:2d07h: //-1/CEB9FA0B800E/SMTPC/esmtp_client_engine_open:from=FAX=7771111@cisco.com, to=jdoe@server.cisco.com2d07h: //-1/CEB9FA0B800E/SMTPC/esmtp_client_engine_open[1868]:2d07h: //-1/CEB9FA0B800E/SMTPC/esmtp_client_engine_add_headers:from_comment=2d07h: //-1/CEB9FA0B800E/SMTPC/esmtp_client_engine_work_routine:socket 0 readable for first time2d07h: //-1/CEB9FA0B800E/SMTPC/esmtp_client_engine_getln:(C)R: 220 vip2-das.cisco.com ESMTP Sendmail 8.9.3/8.9.3; Thu, 5 Jun 2003 23:24:54 -07002d07h: //-1/CEB9FA0B800E/SMTPC/esmtp_client_engine_writeln:(C)S: EHLO Router.cisco.com2d07h: //-1/CEB9FA0B800E/SMTPC/esmtp_client_engine_write:return code=02d07h: //-1/CEB9FA0B800E/SMTPC/esmtp_client_engine_getln:(C)R: 250-vip2-das.cisco.com Hello [172.19.140.108], pleased to meet you2d07h: //-1/CEB9FA0B800E/SMTPC/esmtp_client_engine_getln:(C)R: 250-EXPN2d07h: //-1/CEB9FA0B800E/SMTPC/esmtp_client_engine_getln:(C)R: 250-VERB2d07h: //-1/CEB9FA0B800E/SMTPC/esmtp_client_engine_getln:(C)R: 250-8BITMIME2d07h: //-1/CEB9FA0B800E/SMTPC/esmtp_client_engine_getln:(C)R: 250-SIZE2d07h: //-1/CEB9FA0B800E/SMTPC/esmtp_client_engine_getln:(C)R: 250-DSN2d07h: //-1/CEB9FA0B800E/SMTPC/esmtp_client_engine_getln:(C)R: 250-ONEX2d07h: //-1/CEB9FA0B800E/SMTPC/esmtp_client_engine_getln:(C)R: 250-ETRN2d07h: //-1/CEB9FA0B800E/SMTPC/esmtp_client_engine_getln:(C)R: 250-XUSR2d07h: //-1/CEB9FA0B800E/SMTPC/esmtp_client_engine_getln:(C)R: 250 HELP2d07h: //-1/CEB9FA0B800E/SMTPC/esmtp_client_engine_writeln:(C)S: MAIL FROM:<FAX=7771111@cisco.com>2d07h: //-1/CEB9FA0B800E/SMTPC/esmtp_client_engine_write:return code=02d07h: //-1/CEB9FA0B800E/SMTPC/esmtp_client_engine_getln:(C)R: 250 <FAX=7771111@cisco.com>... Sender ok2d07h: //-1/CEB9FA0B800E/SMTPC/esmtp_client_engine_writeln:(C)S: RCPT TO:<jdoe@server.cisco.com>2d07h: //-1/CEB9FA0B800E/SMTPC/esmtp_client_engine_write:return code=02d07h: //-1/CEB9FA0B800E/SMTPC/esmtp_client_engine_getln:(C)R: 250 <jdoe@server.cisco.com>... Recipient ok2d07h: //-1/CEB9FA0B800E/SMTPC/esmtp_client_engine_write:return code=02d07h: //-1/CEB9FA0B800E/SMTPC/esmtp_client_engine_getln:(C)R: 354 Enter mail, end with "." on a line by itself2d07h: //-1/CEB9FA0B800E/SMTPC/esmtp_client_engine_writeln:(C)S: Received: by Router.cisco.com for <jdoe@server.cisco.com> (with Cisco NetWorks); Thu, 05 Jun 2003 23:11:09 +00002d07h: //-1/CEB9FA0B800E/SMTPC/esmtp_client_engine_write:return code=02d07h: //-1/CEB9FA0B800E/SMTPC/esmtp_client_engine_writeln:(C)S: To: "jdoe" <jdoe@server.cisco.com>2d07h: //-1/CEB9FA0B800E/SMTPC/esmtp_client_engine_write:return code=02d07h: //-1/CEB9FA0B800E/SMTPC/esmtp_client_engine_writeln:(C)S: Message-ID: <00222003231109198@Router.cisco.com>2d07h: //-1/CEB9FA0B800E/SMTPC/esmtp_client_engine_write:return code=02d07h: //-1/CEB9FA0B800E/SMTPC/esmtp_client_engine_writeln:(C)S: Date: Thu, 05 Jun 2003 23:11:09 +00002d07h: //-1/CEB9FA0B800E/SMTPC/esmtp_client_engine_write:return code=0Table 94 describes the significant fields shown in the display.
debug fax relay t30
To display debugging messages for T.30 real-time fax, use the debug fax relay t30 command in privileged EXEC mode. To disable debugging output, use the no form of this command.
debug fax relay t30 {all | calling-number string | called-number string}
no debug fax relay t30
Syntax Description
Defaults
No default behavior or values
Command Modes
Privileged EXEC
Command History
Usage Guidelines
The incoming or outgoing numbers must be a valid E.164 destination. The period symbol (.) as a wildcard should not be used. Instead of a wildcard, leave the space blank to indicate that any numbers can be valid.
There are no limits to the number of debug entries. The number entered generates a match if the calling or called number matches up to the final number of the debug entry. For example, the 408555 entry would match 408555, 4085551, 4085551212, or any other number starting with 408555.
Examples
The following command enables debugging for any incoming calls that start with 408555:
Router# debug fax relay t30 calling-number 408555Debugging fax relay t30 from 408555The following command enables debugging for any calls received to a number starting with 555-1212:
Router# debug fax relay t30 called-number 4155551212Debugging fax relay t30 to 4155551212The following command displays all debug entries:
Router# debug fax relay t30 allDebugging fax relay t30 from 408555Debugging fax relay t30 to 4155551212debug fddi smt-packets
To display information about Station Management (SMT) frames received by the router, use the debug fddi smt-packets command in privileged EXEC mode. To disable debugging output, use the no form of this command.
debug fddi smt-packets
no debug fddi smt-packets
Syntax Description
This command has no arguments or keywords.
Command Modes
Privileged EXEC
Examples
The following is sample output from the debug fddi smt-packets command. In this example, an SMT frame has been output by FDDI 1/0. The SMT frame is a next station addressing (NSA) neighbor information frame (NIF) request frame with the parameters as shown.
Router# debug fddi smt-packetsSMT O: Fddi1/0, FC=NSA, DA=ffff.ffff.ffff, SA=00c0.eeee.be04,class=NIF, type=Request, vers=1, station_id=00c0.eeee.be04, len=40- code 1, len 8 -- 000000016850043F- code 2, len 4 -- 00010200- code 3, len 4 -- 00003100- code 200B, len 8 -- 0000000100000000Table 95 describes the significant fields shown in the display.
debug filesystem
To enable ATA ROM monitor library (monlib) debugging messages, use the debug filesystem command in privileged EXEC mode. To disable ATA monlib debugging messages, use the no form of this command.
debug filesystem {disk0 | disk1}
no debug filesystem {disk0 | disk1}
Syntax Description
disk0
Selects disk 0 as the disk on which to enable or disable debugging.
disk1
Selects disk 1 as the disk on which to enable or disable debugging.
Command Modes
Privileged EXEC
Command History
12.3(7)T
This command was introduced.
12.2(25)S
This command was integrated into Cisco IOS Release 12.2(25)S.
Usage Guidelines
The debug filesystem command enables the display of ATA monlib debugging messages during boot operations.
To display the debugging messages when ROMMON accesses the PCMCIA disk, the ROMMON must have disk support. In other words, if a dev command is entered in ROMMON mode, the output should display the supported disks as shown in the following example:
rommon 1> devDevices in device table:id namebootflash: boot flashslot0: PCMCIA slot 0slot1: PCMCIA slot 1disk0: PCMCIA slot 0disk1: PCMCIA slot 1eprom: epromExamples
The following example shows how to enable ATA monlib debugging messages on disk 0, reboot the router to view ATA monlib debugging messages, and then disable ATA monlib debugging messages:
Router# debug filesystem disk0rommon 1> boot disk0:c7200-is-mz.123-5.7.PI3aInitializing ATA monitor library.......ATA_read_sector:dev = 0ATA_data_xfer:1:dev = 0, command = 32, nsecs = 8, sector = 3, cyl_low = 0,cyl_high = 0, head = 171ATA_read_sector:dev = 0, retval = 0dfs_openfile:Using monlib version 2dfs_openfile:Using version info 1dfs_openfile:finding file.. /c7200-is-mz.123-5.7.PI3aATA_read_sector:dev = 0ATA_data_xfer:1:dev = 0, command = 32, nsecs = 1, sector = 15, cyl_low = 0,cyl_high = 0, head = 163ATA_read_sector:dev = 0, retval = 0ATA_read_sector:dev = 0ATA_data_xfer:1:dev = 0, command = 32, nsecs = 128, sector = 35, cyl_low = 0,cyl_high = 0, head = 171ATA_read_sector:dev = 0, retval = 0dfs_openfile:opened file.. /c7200-is-mz.123-5.7.PI3a with fd = 0DFSLIB_read:reading file.. fd = 0, byte_count = 4DFSLIB_read:read from.. fd = 0, byte_count = 4, retval = 4DFSLIB_read:reading file.. fd = 0, byte_count = 52DFSLIB_read:read from.. fd = 0, byte_count = 52, retval = 52DFSLIB_read:reading file.. fd = 0, byte_count = 40DFSLIB_read:read from.. fd = 0, byte_count = 40, retval = 40...DFSLIB_read:reading file.. fd = 0, byte_count = 40DFSLIB_read:read from.. fd = 0, byte_count = 40, retval = 40DFSLIB_read:reading file.. fd = 0, byte_count = 19539160ATA_read_sector:dev = 0ATA_data_xfer:1:dev = 0, command = 32, nsecs = 1, sector = 15, cyl_low = 0,cyl_high = 0, head = 163ATA_read_sector:dev = 0, retval = 0ATA_read_sector:dev = 0...ATA_read_sector:dev = 0ATA_data_xfer:1:dev = 0, command = 32, nsecs = 19, sector = 1, cyl_low = 38,cyl_high = 0, head = 169ATA_read_sector:dev = 0, retval = 0DFSLIB_read:read from.. fd = 0, byte_count = 19539160, retval = 19539160Self decompressing the image :############################################################################################################################################################### ######################################################################### [OK]Router# no debug filesystem disk0Table 96 describes the significant fields shown in the display.
debug flow exporter
To enable debugging output for Flexible NetFlow flow exporters, use the debug flow exporter command in privileged EXEC mode. To disable debugging output, use the no form of this command.
debug flow exporter [[name] exporter-name] [error] [event] [packets number]
no debug flow exporter [[name] exporter-name] [error] [event] [packets number]
Syntax Description
Command Default
Debugging output for Flexible NetFlow flow exporters is disabled.
Command Modes
Privileged EXEC
Command History
Examples
The following example indicates that a flow exporter packet has been queued for process send:
Router# debug flow exporterMay 21 21:29:12.603: FLOW EXP: Packet queued for process sendRelated Commands
debug flow monitor
To enable debugging output for Flexible NetFlow flow monitors, use the debug flow monitor command in privileged EXEC mode. To disable debugging output, use the no form of this command.
debug flow monitor [error] [{[name] monitor-name [cache] [error] [packets packets]}]
no debug flow monitor [error] [{[name] monitor-name [cache] [error] [packets packets]}]
Syntax Description
Command Default
Debugging output for Flexible NetFlow flow monitors is disabled.
Command Modes
Privileged EXEC
Command History
Examples
The following example shows that the cache for FLOW-MONITOR-1 was deleted:
Router# debug flow monitor FLOW-MONITOR-1 cacheMay 21 21:53:02.839: FLOW MON: 'FLOW-MONITOR-1' deleted cacheRelated Commands
debug flow record
To enable debugging output for Flexible NetFlow flow records, use the debug flow record command in privileged EXEC mode. To disable debugging output, use the no form of this command.
debug flow record [[name] record-name | netflow-original] | netflow ipv4 record [peer] | options {{exporter-statistics | interface-table | sampler-table} [detailed | error]}]
no debug flow record [[name] record-name | netflow-original] | netflow ipv4 record [peer] | options {{exporter-statistics | interface-table | sampler-table} [detailed | error]}]
Syntax Description
name record-name
(Optional) The name of a flow record that you previously configured.
netflow-original
(Optional) Traditional IPv4 input NetFlow with origin autonomous systems.
netflow ipv4 record
(Optional) The name of the NetFlow predefined record that you want to run debugging on. See Table 97.
peer
(Optional) Includes peer information for the NetFlow predefined records that support the peer keyword.
Note
The peer keyword is not supported for every type of NetFlow predefined record. See Table 97.
options
(Optional) Includes information on other flow record options.
exporter-statistics
(Optional) Information on the flow exporter statistics.
interface-table
(Optional) Information on the interface tables.
sampler-table
(Optional) Information on the sampler tables.
detailed
(Optional) Show detailed information.
error
(Optional) Only show errors.
Command Default
Debugging output for Flexible NetFlow flow records is disabled
Command Modes
Privileged EXEC
Command History
Usage Guidelines
Table 97 describes the keywords and descriptions for the record argument.
Examples
There are no examples available for this command.
Related Commands
debug flow-sampler
To enable debugging output for NetFlow sampler activity, use the debug flow-sampler command in privileged EXEC mode. To disable debugging output for NetFlow sampler activity, use the no form of this command.
debug flow-sampler {class-based | events | ipc | match}
no debug flow-sampler {class-based | events | ipc | match}
Syntax Description
Defaults
Debugging output for NetFlow sampler activity is disabled.
Command Modes
Privileged EXEC
Command History
Usage Guidelines
Because debugging output is assigned high priority in the CPU process, you should use debug commands only to troubleshoot specific problems or during troubleshooting sessions with Cisco technical support staff. Moreover, you should use debug commands during periods of lower network traffic and fewer users. Debugging during these periods decreases the likelihood that increased debug command processing overhead will affect system use.
Examples
The following is sample output from the debug flow-sampler events command:
Router# debug flow-sampler eventsFlow sampler events debugging is onRouter# configure terminalRouter(config# no flow-sampler mysampler2Router(config)#5d00h: Flow: Sampler mysampler2 detached from FastEthernet0/15d00h: Flow: Sampler mysampler2 deletedThe following is sample output from the debug flow-sampler match command:
Router# debug flow-sampler matchFlow sampler match debugging is onRouter#4d23h: Flow: Packet matched sampler mysampler1 on interface FastEthernet0/0Router#4d23h: Flow: Packet matched sampler mysampler1 on interface FastEthernet0/0Router#4d23h: Flow: Packet matched sampler mysampler1 on interface FastEthernet0/0Router#4d23h: Flow: Packet matched sampler mysampler1 on interface FastEthernet0/0Table 98 describes the significant fields shown in the display.
Related Commands
debug fmsp receive
Note
To display debugging messages for Fax Media Services Provider (FMSP) receive, use the debug fmsp receive command in privileged EXEC mode. To disable debugging output, use the no form of this command.
debug fmsp receive [t30 | t38]
no debug fmsp receive [t30 | t38]
Syntax Description
Defaults
No default behavior or values
Command Modes
Privileged EXEC
Command History
Examples
The following is sample output from the debug fmsp receive command:
Router# debug fmsp receive*Oct 16 08:31:33.243: faxmsp_call_setup_request: call id=28*Oct 16 08:31:33.243: faxmsp_call_setup_request: ramp data dir=ONRAMP, conf dir=DEST*Oct 16 08:31:33.243: faxmsp_bridge(): cfid=19, srccid=28, dstcid=27*Oct 16 08:31:33.243: faxmsp_bridge(): ramp data dir=ONRAMP, conf dir=DEST*Oct 16 08:31:33.243: faxmsp_bridge(): Explicit caps ind. done; will wait for registry caps ind*Oct 16 08:31:33.243: faxmsp_caps_ind: call id=28, src=27*Oct 16 08:31:33.243: faxmsp_caps_ack: call id src=27*Oct 16 08:31:33.279: faxmsp_call_setup_request: call id=29*Oct 16 08:31:33.279: faxmsp_call_setup_request: ramp data dir=OFFRAMP, conf dir=SRC*Oct 16 08:31:33.283: faxmsp_bridge(): cfid=20, srccid=29, dstcid=26*Oct 16 08:31:33.283: faxmsp_bridge(): ramp data dir=OFFRAMP, conf dir=SRC*Oct 16 08:31:33.283: faxmsp_bridge(): Explicit caps ind. done; will wait for registry caps ind*Oct 16 08:31:33.283: faxmsp_caps_ind: call id=29, src=26*Oct 16 08:31:33.283: faxmsp_caps_ack: call id src=26*Oct 16 08:31:33.635: faxmsp_codec_download_done: call id=29*Oct 16 08:31:33.635: faxmsp_codec_download_done: call id=28*Oct 16 08:31:33.643: faxmsp_xmit: callid src=26, dst=29*Oct 16 08:31:33.643: faxmsp_xmit: callid src=27, dst=28*Oct 16 08:31:33.643: faxmsp_process_rcv_data: call id src=26, dst=29Related Commands
debug fmsp send
Note
To display debugging messages for Fax Media Services Provider (FMSP) send, use the debug fmsp send command in privileged EXEC mode. To disable debugging output, use the no form of this command.
debug fmsp send [t30 | t38]
no debug fmsp send [t30 | t38]
Syntax Description
Defaults
No default behavior or values
Command Modes
Privileged EXEC
Command History
Examples
The following is sample output from the debug fmsp send command:
Router# debug fmsp sendJan 1 05:02:56.782: faxmsp_call_setup_request: call id=21Jan 1 05:02:56.782: faxmsp_call_setup_request: ramp data dir=OFFRAMP, conf dir=SRCJan 1 05:02:56.782: faxmsp_bridge(): cfid=7, srccid=21, dstcid=20Jan 1 05:02:56.782: faxmsp_bridge(): ramp data dir=OFFRAMP, conf dir=SRCJan 1 05:02:56.782: faxmsp_bridge(): Explicit caps ind. done; will wait for registry caps indJan 1 05:02:56.782: faxmsp_caps_ind: call id=21, src=20Jan 1 05:02:56.782: faxmsp_caps_ack: call id src=20Jan 1 05:02:57.174: faxmsp_codec_download_done: call id=21Jan 1 05:02:57.174: faxMsp_tx_buffer callID=21Jan 1 05:02:57.178: faxMsp_tx_buffer callID=21Jan 1 05:02:57.178: faxMsp_tx_buffer callID=21Jan 1 05:02:57.178: faxMsp_tx_buffer callID=21Jan 1 05:02:57.182: faxmsp_xmit: callid src=20, dst=21Jan 1 05:02:57.182: faxmsp_process_rcv_data: call id src=20, dst=21Jan 1 05:03:01.814: faxmsp_xmit: callid src=20, dst=21Jan 1 05:03:01.814: faxmsp_process_rcv_data: call id src=20, dst=21Jan 1 05:03:01.814: faxMsp_tx_buffer callID=21Jan 1 05:03:02.802: faxmsp_xmit: callid src=20, dst=21Jan 1 05:03:02.802: faxmsp_process_rcv_data: call id src=20, dst=21Jan 1 05:03:02.822: faxmsp_xmit: callid src=20, dst=21Jan 1 05:03:02.822: faxmsp_process_rcv_data: call id src=20, dst=21Jan 1 05:03:02.854: faxmsp_xmit: callid src=20, dst=21Jan 1 05:03:02.854: faxmsp_process_rcv_data: call id src=20, dst=21Related Commands
debug foip off-ramp
Note
To display debugging messages for off-ramp fax mail, use the debug foip off-ramp command in privileged EXEC mode. To disable debugging output, use the no form of this command.
debug foip off-ramp
no debug foip off-ramp
Syntax Description
This command has no arguments or keywords.
Defaults
No default behavior or values
Command Modes
Privileged EXEC
Command History
Examples
The following is sample output from the debug foip off-ramp command:
Router# debug foip off-rampJan 1 02:31:17.539: lapp off: CC_EV_CALL_HANDOFF, cid(0xB)Jan 1 02:31:17.539: loffHandoff: called number=5271714, callid=0xBJan 1 02:31:17.543: loffSetupPeer: cid1(0xB)Jan 1 02:31:17.543: destPat(5271714),matched(1),pref(5),tag(20),encap(1)Jan 1 02:31:22.867: lapp off: CC_EV_CALL_CONNECTED, cid(0xC)Jan 1 02:31:22.867: st=CALL_SETTING cid(0xB,0x0,0x0,0xC),cfid(0x0,0x0,0x0)Jan 1 02:31:22.867: loffConnectedJan 1 02:31:22.867: loffFlushPeerTagQueue cid(11) peer list: (empty)Jan 1 02:31:22.867: lapp off: CC_EV_CONF_CREATE_DONE, cid(0xC), cid2(0xD), cfid(0x1)Jan 1 02:31:22.867: st=CONFERENCING3 cid(0xB,0x0,0xD,0xC),cfid(0x0,0x0,0x1)Jan 1 02:31:22.867: loffConfDone3Jan 1 02:31:30.931: lapp off: CC_EV_FROM_FMSP_ON_CALL_DETAIL, cid(0xD)Jan 1 02:31:30.931: st=WAIT_SESS_INFO cid(0xB,0x0,0xD,0xC),cfid(0x0,0x0,0x1)Jan 1 02:31:30.931: loffSessionInfoJan 1 02:31:30.931: encd=2, resl=2, spd=26, min_scan_len=0, csid= 4085271714Jan 1 02:31:30.931: lapp off: CC_EV_CONF_CREATE_DONE, cid(0xD), cid2(0xE), cfid(0x2)Jan 1 02:31:30.931: st=CONFERENCING2 cid(0xB,0xE,0xD,0xC),cfid(0x0,0x2,0x1)Jan 1 02:31:30.931: loffConfDone2Related Commands
debug foip on-ramp
Note
To display debugging messages for on-ramp fax mail, use the debug foip on-ramp command in privileged EXEC mode. To disable debugging output, use the no form of this command.
debug foip on-ramp
no debug foip on-ramp
Syntax Description
This command has no arguments or keywords.
Defaults
No default behavior or values
Command Modes
Privileged EXEC
Command History
Examples
The following is sample output from the debug foip on-ramp command:
Router# debug foip on-ramp*Oct 16 08:07:01.947: lapp_on_application: Incoming Event: (15 = CC_EV_CALL_HANDOFF), CID(11), DISP(0)*Oct 16 08:07:01.947: lapp_on_call_handoff: Authentication enabled = FALSE*Oct 16 08:07:01.947: lapp_on_call_handoff: Authentication ID = 0*Oct 16 08:07:01.947: lapp_on_call_handoff: Authentication ID source = IVR or unknown*Oct 16 08:07:01.947: lapp_on_call_handoff: Authentication status = SUCCESS*Oct 16 08:07:01.947: lapp_on_call_handoff: Accounting enabled = FALSE*Oct 16 08:07:01.947: lapp_on_call_handoff: Accounting method list = fax*Oct 16 08:07:01.947: lapp_on_conference_vtsp_fmsp: Begin conferencing VTSP and FMSP...*Oct 16 08:07:01.951: lapp_on_change_state: old state(0) new state(1)*Oct 16 08:07:01.951: lapp_on_application: Incoming Event: (29 = CC_EV_CONF_CREATE_DONE), CID(11), DISP(0)*Oct 16 08:07:01.951: lapp_on_application: Current call state = 1*Oct 16 08:07:01.951: lapp_on_conference_created: The VTSP and the FMSP are conferenced*Oct 16 08:07:01.951: lapp_on_conference_created: Wait for FMSP call detail eventRelated Commands
debug fpm event
To display protocol information from the designated protocol header description field (PHDF), use the debug fpm event command in privileged EXEC mode. To disable debugging messages, use the no form of this command.
debug fpm event
no debug fpm event
Syntax Description
This command has no arguments or keywords.
Command Modes
Privileged EXEC
Command History
Examples
The following sample output is from the debug fpm event command:
Router# debug fpm event*Jun 21 09:22:21.607: policy_classification_inline(): matches class: class-default *Jun 21 09:22:21.607: packet_access_control(): policy-map: fpm_policy, dir: input, match. retval: 0x0, ip_flags: 0x80000000debug frame-relay
To display debugging information about the packets received on a Frame Relay interface, use the debug frame-relay command in privileged EXEC mode. To disable debugging output, use the no form of this command.
debug frame-relay
no debug frame-relay
Syntax Description
This command has no arguments or keywords.
Defaults
This command is disabled by default.
Command Modes
Privileged EXEC
Command History
9.00
This command was introduced.
12.2(13)T
Support for Banyan VINES was removed.
Usage Guidelines
This command helps you analyze the packets that have been received. However, because the debug frame-relay command generates a substantial amount of output, use it only when the rate of traffic on the Frame Relay network is less than 25 packets per second.
To analyze the packets that have been sent on a Frame Relay interface, use the debug frame-relay packet command.
Examples
The following is sample output from the debug frame-relay command:
Router# debug frame-relaySerial0(i): dlci 500(0x7C41), pkt type 0x809B, datagramsize 24Serial1(i): dlci 1023(0xFCF1), pkt type 0x309, datagramsize 13Serial0(i): dlci 500(0x7C41), pkt type 0x809B, datagramsize 24Serial1(i): dlci 1023(0xFCF1), pkt type 0x309, datagramsize 13Serial0(i): dlci 500(0x7C41), pkt type 0x809B, datagramsize 24Table 99 describes the significant fields shown in the display.
debug frame-relay adjacency
To display information pertaining to an adjacent node that has one or more Frame Relay permanent virtual circuit (PVC) bundles, use the debug frame-relay adjacency command in privileged EXEC mode. To stop displaying the adjacent node information, use the no form of this command.
debug frame-relay adjacency {pvc [dlci] | vc-bundle [vc-bundle-name]}
no debug frame-relay adjacency {pvc [dlci] | vc-bundle [vc-bundle-name]}
Syntax Description
Defaults
No default behaviors or values
Command Modes
Privileged EXEC
Command History
Usage Guidelines
Use this command to monitor adjacency activity and status for an adjacent node.
Note
Examples
The following sample output from the debug frame-relay adjacency vc-bundle command shows PVC bundle "MP-4-dynamic" going down. Each bundle member PVC is marked for removal from the CEF adjacency table, and then the adjacency for the PVC bundle itself is marked for removal. The adjacencies are actually removed from the table later when a background clean-up process runs.
Router# debug frame-relay adjacency vc-bundle MP-4-dynamic00:46:35: FR-ADJ: vcb MP-4-dynamic: ip 14.2.2.2: member 400: removing adj00:46:35: FR-ADJ: vcb MP-4-dynamic: ip 14.2.2.2: member 401: removing adj00:46:35: FR-ADJ: vcb MP-4-dynamic: ip 14.2.2.2: member 402: removing adj00:46:35: FR-ADJ: vcb MP-4-dynamic: ip 14.2.2.2: member 403: removing adj00:46:35: FR-ADJ: vcb MP-4-dynamic: ip 14.2.2.2: member 404: removing adj00:46:35: FR-ADJ: vcb MP-4-dynamic: ip 14.2.2.2: member 405: removing adj00:46:35: FR-ADJ: vcb MP-4-dynamic: ip 14.2.2.2: member 406: removing adj00:46:35: FR-ADJ: vcb MP-4-dynamic: ip 14.2.2.2: member 407: removing adj00:46:35: FR-ADJ: vcb MP-4-dynamic: ip 14.2.2.2: removing primary adjRelated Commands
debug frame-relay vc-bundle
Displays information pertaining to all the PVC bundles configured on the router.
debug frame-relay callcontrol
To display Frame Relay Layer 3 (network layer) call control information, use the debug frame-relay callcontrol command in privileged EXEC mode. To disable debugging output, use the no form of this command.
debug frame-relay callcontrol
no debug frame-relay callcontrol
Syntax Description
This command has no arguments or keywords.
Command Modes
Privileged EXEC
Usage Guidelines
The debug frame-relay callcontrol command is used specifically for observing FRF.4/Q.933 signalling messages and related state changes. The FRF.4/Q.933 specification describes a state machine for call control. The signalling code implements the state machine. The debug statements display the actual event and state combinations.
The Frame Relay switched virtual circuit (SVC) signalling subsystem is an independent software module. When used with the debug frame-relay networklayerinterface command, the debug frame-relay callcontrol command provides a better understanding of the call setup and teardown sequence. The debug frame-relay networklayerinterface command provides the details of the interactions between the signalling subsystem on the router and the Frame Relay subsystem.
Examples
State changes can be observed during a call setup on the calling party side. The debug frame-relay networklayerinterface command shows the following state changes or transitions:
STATE_NULL -> STATE_CALL_INITIATED -> STATE_CALL_PROCEEDING->STATE_ACTIVEThe following messages are samples of output generated during a call setup on the calling side:
6d20h: U0_SetupRequest: Serial06d20h: L3SDL: Ref: 1, Init: STATE_NULL, Rcvd: SETUP_REQUEST, Next: STATE_CALL_INITIATED 6d20h: U1_CallProceeding: Serial06d20h: L3SDL: Ref: 1, Init: STATE_CALL_INITIATED, Rcvd: MSG_CALL_PROCEEDING, Next:STATE_CALL_PROCEEDING6d20h: U3_Connect: Serial06d20h: L3SDL: Ref: 1, Init: STATE_CALL_PROCEEDING, Rcvd: MSG_CONNECT, Next: STATE_ACTIVE 6d20h:The following messages are samples of output generated during a call setup on the called party side. Note the state transitions as the call goes to the active state:
STATE_NULL -> STATE_CALL_PRESENT-> STATE_INCOMING_CALL_PROCEEDING->STATE_ACTIVE1w4d: U0_Setup: Serial2/31w4d: L3SDL: Ref: 32769, Init: STATE_NULL, Rcvd: MSG_SETUP, Next: STATE_CALL_PRESENT 1w4d: L3SDL: Ref: 32769, Init: STATE_CALL_PRESENT, Rcvd: MSG_SETUP, Next:STATE_INCOMING_CALL_PROC 1w4d: L3SDL: Ref: 32769, Init: STATE_INCOMING_CALL_PROC,Rcvd: MSG_SETUP, Next: STATE_ACTIVETable 100 explains the possible call states.
Related Commands
debug frame-relay events
To display debugging information about Frame Relay Address Resolution Protocol (ARP) replies on networks that support a multicast channel and use dynamic addressing, use the debug frame-relay events command in privileged EXEC mode. To disable debugging output, use the no form of this command.
debug frame-relay events
no debug frame-relay events
Syntax Description
This command has no arguments or keywords.
Command Modes
Privileged EXEC
Command History
Usage Guidelines
This command is useful for identifying the cause of end-to-end connection problems during the installation of a Frame Relay network or node.
Note
Examples
The following is sample output from the debug frame-relay events command:
Router# debug frame-relay eventsSerial2(i): reply rcvd 172.16.170.26 126Serial2(i): reply rcvd 172.16.170.28 128Serial2(i): reply rcvd 172.16.170.34 134Serial2(i): reply rcvd 172.16.170.38 144Serial2(i): reply rcvd 172.16.170.41 228Serial2(i): reply rcvd 172.16.170.65 325As the output shows, the debug frame-relay events command returns one specific message type. The first line, for example, indicates that IP address 172.16.170.26 sent a Frame Relay ARP reply; this packet was received as input on serial interface 2. The last field (126) is the data-link connection identifier (DLCI) to use when communicating with the responding router.
For Frame Relay over MPLS, the following is sample output for the debug frame-relay events command. The command output shows the status of the VCs.
Router# debug frame-relay eventsFrame Relay events debugging is onThis example shows the messages that are displayed when you shut the core-facing interface on a provider edge (PE) router:
04:40:38:%SYS-5-CONFIG_I: Configured from console by consolenf tEnter configuration commands, one per line. End with CNTL/Z.Router(config)# interface hssi2/0Router(config-if)# shut04:40:43:%OSPF-5-ADJCHG: Process 10, Nbr 12.12.12.12 on Hssi2/0 from FULL to DOWN, Neighbor Down: Interface down or detached04:40:43: FRoMPLS [12.12.12.12, 100]: PW pvc_status set INACTIVE04:40:43: FRoMPLS [12.12.12.12, 100]: Setting pw segment DOWN04:40:43: FRoMPLS [12.12.12.12, 100]: Setting connection DOWN04:40:43: FRoMPLS [12.12.12.12, 101]: PW pvc_status set INACTIVE04:40:43: FRoMPLS [12.12.12.12, 101]: Setting pw segment DOWN04:40:43: FRoMPLS [12.12.12.12, 101]: Setting connection DOWN04:40:45:%LINK-5-CHANGED: Interface Hssi2/0, changed state to administratively down04:40:46:%LINEPROTO-5-UPDOWN: Line protocol on Interface Hssi2/0, changed state to downThis example shows the messages that are displayed when you enable the core-facing interface on a PE router:
Router(config-if)# no shut04:40:56:%LINK-3-UPDOWN: Interface Hssi2/0, changed state to up04:40:57:%LINEPROTO-5-UPDOWN: Line protocol on Interface Hssi2/0, changed state to up04:41:06:%OSPF-5-ADJCHG: Process 10, Nbr 12.12.12.12 on Hssi2/0 from LOADING to FULL, Loading Done04:41:19: FRoMPLS [12.12.12.12, 100]: PW pvc_status set ACTIVE04:41:19: FRoMPLS [12.12.12.12, 100]: Setting pw segment UP04:41:19: FRoMPLS [12.12.12.12, 101]: PW pvc_status set ACTIVE04:41:19: FRoMPLS [12.12.12.12, 101]: Setting pw segment UPThis example shows the messages that are displayed when you shut the edge-facing interface on a PE router:
Router(config)# interface pos4/0Router(config-if)# shut04:42:50: FRoMPLS [12.12.12.12, 100]: acmgr_circuit_down04:42:50: FRoMPLS [12.12.12.12, 100]: Setting connection DOWN04:42:50: FRoMPLS [12.12.12.12, 100]: PW pvc_status set INACTIVE04:42:52:%LINK-5-CHANGED: Interface POS4/0, changed state to administratively down04:42:53:%LINEPROTO-5-UPDOWN: Line protocol on Interface POS4/0, changed state to downThis example shows the messages that are displayed when you enable the edge-facing interface on a PE router:
Router(config)# interface pos4/0Router(config-if)# no shut04:43:20:%LINK-3-UPDOWN: Interface POS4/0, changed state to upc72-33-2(config-if)#04:43:20: FRoMPLS [12.12.12.12, 100]: Local up, sending acmgr_circuit_up04:43:20: FRoMPLS [12.12.12.12, 100]: PW nni_pvc_status set ACTIVE04:43:20: FRoMPLS [12.12.12.12, 100]: PW pvc_status set ACTIVE04:43:20: FRoMPLS [12.12.12.12, 100]: Setting pw segment UPdebug frame-relay foresight
To observe Frame Relay traces relating to traffic shaping with router ForeSight enabled, use the debug frame-relay foresight command in privileged EXEC mode. To disable debugging output, use the no form of this command.
debug frame-relay foresight
no debug frame-relay foresight
Syntax Description
This command has no arguments or keywords.
Command Modes
Privileged EXEC
Examples
The following is sample output that shows the display message returned in response to the debug frame-relay foresight command:
Router# debug frame-relay foresightFR rate control for DLCI 17 due to ForeSight msgThis message indicates the router learned from the ForeSight message that data-link connection identifier (DLCI) 17 is now experiencing congestion. The output rate for this circuit should be slowed down, and in the router this DLCI is configured to adapt traffic shaping in response to foresight messages.
Related Commands
debug frame-relay fragment
To display information related to Frame Relay fragmentation on a permanent virtual circuit (PVC), use the debug frame-relay fragment command in privileged EXEC mode. To disable debugging output, use the no form of this command.
debug frame-relay fragment [event | interface type number dlci]
no debug frame-relay fragment [event | interface type number dlci]
Syntax Description
Command Modes
Privileged EXEC
Command History
Usage Guidelines
This command will display event or error messages related to Frame Relay fragmentation; it is only enabled at the PVC level on the selected interface.
This command is not supported on the Cisco MC3810 networking device for fragments received by a PVC configured via the voice-encap command.
Examples
The following is sample output from the debug frame-relay fragment command:
Router# debug frame-relay fragment interface serial 0/0 109This may severely impact network performance.You are advised to enable 'no logging console debug'. Continue?[confirm]Frame Relay fragment/packet debugging is onDisplaying fragments/packets on interface Serial0/0 dlci 109 onlySerial0/0(i): dlci 109, rx-seq-num 126, exp_seq-num 126, BE bits set, frag_hdr 04 C0 7ESerial0/0(o): dlci 109, tx-seq-num 82, BE bits set, frag_hdr 04 C0 52The following is sample output from the debug frame-relay fragment event command:
Router# debug frame-relay fragment eventThis may severely impact network performance.You are advised to enable 'no logging console debug'. Continue?[confirm]Frame Relay fragment event/errors debugging is onFrame-relay reassembled packet is greater than MTU size, packet dropped on serial 0/0dlci 109Unexpected B bit frame rx on serial0/0 dlci 109, dropping pending segmentsRx an out-of-sequence packet on serial 0/0 dlci 109, seq_num_received 17seq_num_expected 19Related Commands
debug frame-relay informationelements
To display information about Frame Relay Layer 3 (network layer) information element parsing and construction, use the debug frame-relay informationelements command in privileged EXEC mode. To disable debugging output, use the no form of this command.
debug frame-relay informationelements
no debug frame-relay informationelements
Syntax Description
This command has no arguments or keywords.
Command Modes
Privileged EXEC
Usage Guidelines
Within the FRF.4/Q.933 signalling specification, messages are divided into subunits called information elements. Each information element defines parameters specific to the call. These parameters can be values configured on the router, or values requested from the network.
The debug frame-relay informationelements command shows the signalling message in hexadecimal format. Use this command to determine parameters being requested and granted for a call.
Note
Caution
Examples
The following is sample output from the debug frame-relay informationelements command. In this example, each information element has a length associated with it. For those with odd-numbered lengths, only the specified bytes are valid, and the extra byte is invalid. For example, in the message "Call Ref, length: 3, 0x0200 0x0100," only "02 00 01" is valid; the last "00" is invalid.
lw0d# debug frame-relay informationelementsRouter: Outgoing MSG_SETUPRouter: Dir: U --> N, Type: Prot Disc, length: 1, 0x0800Router: Dir: U --> N, Type: Call Ref, length: 3, 0x0200 0x0100Router: Dir: U --> N, Type: Message type, length: 1, 0x0500Router: Dir: U --> N, Type: Bearer Capability, length: 5, 0x0403 0x88A0 0xCF00Router: Dir: U --> N, Type: DLCI, length: 4, 0x1902 0x46A0Router: Dir: U --> N, Type: Link Lyr Core, length: 27, 0x4819 0x090B 0x5C0B 0xDC0ARouter: 0x3140 0x31C0 0x0B21 0x4021Router: 0xC00D 0x7518 0x7598 0x0E09Router: 0x307D 0x8000Router: Dir: U --> N, Type: Calling Party, length: 12, 0x6C0A 0x1380 0x3837 0x3635Router: 0x3433 0x3231Router: Dir: U --> N, Type: Calling Party Subaddr, length: 4, 0x6D02 0xA000Router: Dir: U --> N, Type: Called Party, length: 11, 0x7009 0x9331 0x3233 0x3435Router: 0x3637 0x386ERouter: Dir: U --> N, Type: Called Party Subaddr, length: 4, 0x7102 0xA000Router: Dir: U --> N, Type: Low Lyr Comp, length: 5, 0x7C03 0x88A0 0xCE65Router: Dir: U --> N, Type: User to User, length: 4, 0x7E02 0x0000Table 101 explains the information elements shown in the example.
Related Commands
debug frame-relay callcontrol
Displays Frame Relay Layer 3 (network layer) call control information.
debug frame-relay ip tcp header-compression
To display debugging information about TCP/IP header compression on Frame Relay interfaces, use the debug frame-relay ip tcp header-compression command in privileged EXEC mode. To disable debugging output, use the no form of this command.
debug frame-relay ip tcp header-compression
no debug frame-relay ip tcp header-compression
Syntax Description
This command has no arguments or keywords.
Defaults
Disabled
Command Modes
Privileged EXEC
Command History
Usage Guidelines
The debug frame-relay ip tcp header-compression command shows the control packets that are passed to initialize IP header compression (IPHC) on a permanent virtual circuit (PVC). For Cisco IPHC, typically two packets are passed: one sent and one received per PVC. (Inverse Address Resolution Protocol (InARP) packets are sent on PVCs that do not have a mapping defined between a destination protocol address and the data-link connection identifier (DLCI) or Frame Relay PVC bundle that connects to the destination address.) For FRF .20 IPHC, typically four packets are passed per PVC.
Debug messages are displayed only if the IPHC control protocol is renegotiated (for an interface or PVC state change or for a configuration change).
Examples
The following is sample output from the debug frame-relay ip tcp header-compression command when Cisco IPHC (not FRF .20 IPHC) is configured in the IPHC profile:
Router# debug frame-relay ip tcp header-compression*Nov 14 09:22:07.991: InARP REQ: Tx compr_flags 43 *Nov 14 09:22:08.103: InARP RSP: Rx compr_flags: 43The following is sample output from the debug frame-relay ip tcp header-compression command when FRF .20 IPHC (without either Real-time Transport Protocol (RTP) or ECRTP) is configured in the IPHC profile:
Router# debug frame-relay ip tcp header-compressionFRF20(DLCI 16): Rxed Request, state 0: ident 0, tot len 19, conf_opts FE, len 15negotiation codes 1, version 1Par: IPV4, len 12, TCP_SPACE 16, NON_TCP_SPACE 0,F_MAX_PERIOD 256, F_MAX_TIME 5, MAX_HEADER 168 FRF20(DLCI 16): Txed Ack, state 0: ident 0, tot len 19, conf_opts FE, len 15negotiation codes 1, version 1Par: IPV4, len 12, TCP_SPACE 16, NON_TCP_SPACE 0,F_MAX_PERIOD 256, F_MAX_TIME 5, MAX_HEADER 168 FRF20(DLCI 16): Txed Request, state 0: ident 3, tot len 19, conf_opts FE, len 15negotiation codes 0, version 1Par: IPV4, len 12, TCP_SPACE 16, NON_TCP_SPACE 0,F_MAX_PERIOD 256, F_MAX_TIME 5, MAX_HEADER 168 FRF20(DLCI 16): Rxed Ack, state 2: ident 3, tot len 19, conf_opts FE, len 15negotiation codes 0, version 1Par: IPV4, len 12, TCP_SPACE 16, NON_TCP_SPACE 0,F_MAX_PERIOD 256, F_MAX_TIME 5, MAX_HEADER 168 *Nov 14 09:18:37.019:FRF20(DLCI 16): STARTING IPHCThe following is sample output from the debug frame-relay ip tcp header-compression command when FRF .20 IPHC and RTP are configured in the IPHC profile:
Router# debug frame-relay ip tcp header-compressionFRF20(DLCI 16): Txed Request, state 1: ident 0, tot len 21, conf_opts FE, len 17negotiation codes 1, version 1Par: IPV4, len 14, TCP_SPACE 16, NON_TCP_SPACE 16,F_MAX_PERIOD 256, F_MAX_TIME 5, MAX_HEADER 16801:33:06: Subopt: rtp enabledThe following is sample output from the debug frame-relay ip tcp header-compression command when FRF .20 IPHC and ECRTP are configured in the IPHC profile:
Router# debug frame-relay ip tcp header-compressionFRF20(DLCI 16): Txed Request, state 1: ident 0, tot len 21, conf_opts FE, len 17negotiation codes 1, version 1Par: IPV4, len 14, TCP_SPACE 16, NON_TCP_SPACE 16,F_MAX_PERIOD 256, F_MAX_TIME 5, MAX_HEADER 16801:33:06: Subopt: ecrtp enabledTable 102 describes the significant fields shown in the displays.
debug frame-relay lapf
To display Frame Relay switched virtual circuit (SVC) Layer 2 information, use the debug frame-relay lapf command in privileged EXEC mode. To disable debugging output, use the no form of this command.
debug frame-relay lapf
no debug frame-relay lapf
Syntax Description
This command has no arguments or keywords.
Command Modes
Privileged EXEC
Usage Guidelines
Use the debug frame-relay lapf command to troubleshoot the data-link control portion of Layer 2 that runs over data-link connection identifier (DLCI) 0. Use this command only if you have a problem bringing up Layer 2. You can use the show interface serial command to determine the status of Layer 2. If it shows a Link Access Procedure, Frame Relay (LAPF) state of down, Layer 2 has a problem.
Examples
The following is sample output from the debug frame-relay lapf command. In this example, a line being brought up indicates an exchange of set asynchronous balanced mode extended (SABME) and unnumbered acknowledgment (UA) commands. A SABME is initiated by both sides, and a UA is the response. Until the SABME gets a UA response, the line is not declared to be up. The p/f value indicates the poll/final bit setting. TX means send, and RX means receive.
Router# debug frame-relay lapfRouter: *LAPF Serial0 TX -> SABME Cmd p/f=1Router: *LAPF Serial0 Enter state 5Router: *LAPF Serial0 RX <- UA Rsp p/f=1Router: *LAPF Serial0 lapf_ua_5Router: *LAPF Serial0 Link up!Router: *LAPF Serial0 RX <- SABME Cmd p/f=1Router: *LAPF Serial0 lapf_sabme_78Router: *LAPF Serial0 TX -> UA Rsp p/f=1In the following example, a line in an up LAPF state should see a steady exchange of RR (receiver ready) messages. TX means send, RX means receive, and N(R) indicates the receive sequence number.
Router# debug frame-relay lapfRouter: *LAPF Serial0 T203 expired, state = 7Router: *LAPF Serial0 lapf_rr_7Router: *LAPF Serial0 TX -> RR Rsp p/f=1, N(R)= 3Router: *LAPF Serial0 RX <- RR Cmd p/f=1, N(R)= 3Router: *LAPF Serial0 lapf_rr_7Router: *LAPF Serial0 TX -> RR Rsp p/f=1, N(R)= 3Router: *LAPF Serial0 RX <- RR Cmd p/f=1, N(R)= 3Router: *LAPF Serial0 lapf_rr_7debug frame-relay lmi
To display information on the local management interface (LMI) packets exchanged by the router and the Frame Relay service provider, use the debug frame-relay lmi command in privileged EXEC mode. To disable debugging output, use the no form of this command.
debug frame-relay lmi [interface name]
no debug frame-relay lmi [interface name]
Syntax Description
Command Modes
Privileged EXEC
Usage Guidelines
You can use this command to determine whether the router and the Frame Relay switch are sending and receiving LMI packets properly.
Note
Examples
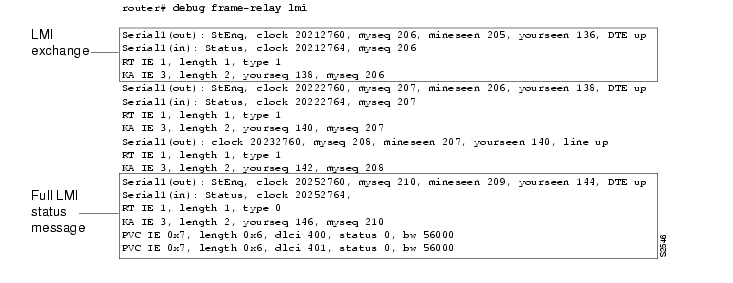
The following is sample output from the debug frame-relay lmi command:
The first four lines describe an LMI exchange. The first line describes the LMI request the router has sent to the switch. The second line describes the LMI reply the router has received from the switch. The third and fourth lines describe the response to this request from the switch. This LMI exchange is followed by two similar LMI exchanges. The last six lines consist of a full LMI status message that includes a description of the two permanent virtual circuits (PVCs) of the router.
Table 103 describes the significant fields shown in the first line of the display.
Table 104 describes the significant fields shown in the third and fourth lines of the display.
Table 105 describes the significant fields shown in the last line of the display.
debug frame-relay multilink
To display debug messages for multilink Frame Relay bundles and bundle links, use the debug frame-relay multilink command in privileged EXEC mode. To disable debugging output, use the no form of this command.
debug frame-relay multilink [control [mfr number | serial number]]
no debug frame-relay multilink
Syntax Description
Defaults
No default behavior or values
Command Modes
Privileged EXEC
Command History
Usage Guidelines
Caution
Using the debug frame-relay multilink without the mfr or serial keywords will display error conditions occurring at the bundle layer.
Examples
The following example shows output from the debug frame-relay multilink command for bundle "MFR0", which has three bundle links:
Router# debug frame-relay multilink control MFR000:42:54:Serial5/3(o):msg=Add_link, Link=Serial5/3, Bundle=MFR0, Link id=Serial5/3, BL state=IdleE1 00 01 01 07 4D 46 52 30 0000:42:54:Serial5/2(o):msg=Add_link, Link=Serial5/2, Bundle=MFR0, Link id=Serial5/2, BL state=IdleE1 00 01 01 07 4D 46 52 30 0000:42:54:Serial5/1(o):msg=Add_link, Link=Serial5/1, Bundle=MFR0, Link id=Serial5/1, BL state=IdleE1 00 01 01 07 4D 46 52 30 0000:42:54:%LINK-3-UPDOWN:Interface MFR0, changed state to down00:42:54:Serial5/3(i):msg=Add_link_ack, Link=Serial5/3, Bundle=MFR0, Link id=Serial5/3, BL state=Add_sentE1 00 02 01 07 4D 46 52 30 0000:42:54:Serial5/2(i):msg=Add_link_ack, Link=Serial5/2, Bundle=MFR0, Link id=Serial5/2, BL state=Add_sentE1 00 02 01 07 4D 46 52 30 0000:42:54:Serial5/1(i):msg=Add_link_ack, Link=Serial5/1, Bundle=MFR0, Link id=Serial5/1, BL state=Add_sentE1 00 02 01 07 4D 46 52 30 0000:42:54:%SYS-5-CONFIG_I:Configured from console by console00:43:00:Serial5/1(i):msg=Add_link, Link=Serial5/1, Bundle=MFR0, Link id=Serial5/1, BL state=Ack_rxE1 00 01 01 07 4D 46 52 30 0000:43:00:Serial5/1(o):msg=Add_link_ack, Link=Serial5/1, Bundle=MFR0, Link id=Serial5/1, BL state=Ack_rxE1 00 02 01 07 4D 46 52 30 0000:43:00:%LINK-3-UPDOWN:Interface MFR0, changed state to up00:43:00:Serial5/1(i):msg=Hello, Link=Serial5/1, Bundle=MFR0, Linkid=Serial5/1, BL state=UpE1 00 04 03 06 30 A7 E0 54 0000:43:00:Serial5/1(o):msg=Hello_ack, Link=Serial5/1, Bundle=MFR0, Link id=Serial5/1, BL state=UpE1 00 05 03 06 90 E7 0F C2 0600:43:01:Serial5/2(i):msg=Add_link, Link=Serial5/2, Bundle=MFR0, Link id=Serial5/2, BL state=Ack_rxE1 00 01 01 07 4D 46 52 30 0000:43:01:Serial5/2(o):msg=Add_link_ack, Link=Serial5/2, Bundle=MFR0, Link id=Serial5/2, BL state=Ack_rxE1 00 02 01 07 4D 46 52 30 0000:43:01:Serial5/2(i):msg=Hello, Link=Serial5/2, Bundle=MFR0, Linkid=Serial5/2, BL state=UpE1 00 04 03 06 30 A7 E0 54 0000:43:01:Serial5/2(o):msg=Hello_ack, Link=Serial5/2, Bundle=MFR0, Link id=Serial5/2, BL state=UpE1 00 05 03 06 90 E7 0F C2 0600:43:01:%LINEPROTO-5-UPDOWN:Line protocol on Interface Serial5/1, changed state to up00:43:01:Serial5/3(i):msg=Add_link, Link=Serial5/3, Bundle=MFR0, Link id=Serial5/3, BL state=Ack_rxE1 00 01 01 07 4D 46 52 30 0000:43:01:Serial5/3(o):msg=Add_link_ack, Link=Serial5/3, Bundle=MFR0, Link id=Serial5/3, BL state=Ack_rxE1 00 02 01 07 4D 46 52 30 0000:43:01:Serial5/3(i):msg=Hello, Link=Serial5/3, Bundle=MFR0, Linkid=Serial5/3, BL state=UpE1 00 04 03 06 30 A7 E0 54 0000:43:01:Serial5/3(o):msg=Hello_ack, Link=Serial5/3, Bundle=MFR0, Link id=Serial5/3, BL state=UpE1 00 05 03 06 90 E7 0F C2 0600:43:02:%LINEPROTO-5-UPDOWN:Line protocol on Interface Serial5/2 , changed state to up00:43:02:%LINEPROTO-5-UPDOWN:Line protocol on Interface Serial5/3 , changed state to upTable 106 describes the significant fields shown in the display.
Related Commands
show frame-relay multilink
Displays configuration information and statistics about multilink Frame Relay bundles and bundle links.
debug frame-relay networklayerinterface
To display Network Layer Interface (NLI) information, use the debug frame-relay networklayerinterface command in privileged EXEC mode. To disable debugging output, use the no form of this command.
debug frame-relay networklayerinterface
no debug frame-relay networklayerinterface
Syntax Description
This command has no arguments or keywords.
Command Modes
Privileged EXEC
Usage Guidelines
The Frame Relay switched virtual circuit (SVC) signaling subsystem is decoupled from the rest of the router code by means of the NLI intermediate software layer.
The debug frame-relay networklayerinterface command shows activity within the network-layer interface when a call is set up or torn down. All output that contains an NL relates to the interaction between the Q.933 signaling subsystem and the NLI.
Note
Examples
The following is sample output from the debug frame-relay networklayerinterface command. This example displays the output generated when a call is set up. The second example shows the output generated when a call is torn down.
Router# debug frame-relay networklayerinterfaceRouter: NLI STATE: L3_CALL_REQ, Call ID 1 state 0Router: NLI: Walking the event table 1Router: NLI: Walking the event table 2Router: NLI: Walking the event table 3Router: NLI: Walking the event table 4Router: NLI: Walking the event table 5Router: NLI: Walking the event table 6Router: NLI: Walking the event table 7Router: NLI: Walking the event table 8Router: NLI: Walking the event table 9Router: NLI: NL0_L3CallReqRouter: NLI: State: STATE_NL_NULL, Event: L3_CALL_REQ, Next: STATE_L3_CALL_REQRouter: NLI: Enqueued outgoing packet on holdqRouter: NLI: Map-list search: Found maplist bermudaRouter: daddr.subaddr 0, saddr.subaddr 0, saddr.subaddr 0Router: saddr.subaddr 0, daddr.subaddr 0, daddr.subaddr 0Router: nli_parameter_negotiationRouter: NLI STATE: NL_CALL_CNF, Call ID 1 state 10Router: NLI: Walking the event table 1Router: NLI: Walking the event table 2Router: NLI: Walking the event table 3Router: NLI: NLx_CallCnfRouter: NLI: State: STATE_L3_CALL_REQ, Event: NL_CALL_CNF, Next: STATE_NL_CALL_CNFRouter: Checking maplist "junk"Router: working with maplist "bermuda"Router: Checking maplist "bermuda"Router: working with maplist "bermuda"Router: NLI: Emptying holdQ, link 7, dlci 100, size 104Router# debug frame-relay networklayerinterfaceRouter: NLI: L3 Call Release Req for Call ID 1Router: NLI STATE: L3_CALL_REL_REQ, Call ID 1 state 3Router: NLI: Walking the event table 1Router: NLI: Walking the event table 2Router: NLI: Walking the event table 3Router: NLI: Walking the event table 4Router: NLI: Walking the event table 5Router: NLI: Walking the event table 6Router: NLI: Walking the event table 7Router: NLI: Walking the event table 8Router: NLI: Walking the event table 9Router: NLI: Walking the event table 10Router: NLI: NLx_L3CallRejRouter: NLI: State: STATE_NL_CALL_CNF, Event: L3_CALL_REL_REQ, Next: STATE_L3_CALL_REL_REQRouter: NLI: junk: State: STATE_NL_NULL, Event: L3_CALL_REL_REQ, Next: STATE_NL_NULLRouter: NLI: Map-list search: Found maplist junkRouter: daddr.subaddr 0, saddr.subaddr 0, saddr.subaddr 0Router: saddr.subaddr 0, daddr.subaddr 0, daddr.subaddr 0Router: nli_parameter_negotiationRouter: NLI STATE: NL_REL_CNF, Call ID 1 state 0Router: NLI: Walking the event table 1Router: NLI: Walking the event table 2Router: NLI: Walking the event table 3Router: NLI: Walking the event table 4Router: NLI: Walking the event table 5Router: NLI: Walking the event table 6Router: NLI: Walking the event table 7Router: NLI: NLx_RelCnfRouter: NLI: State: STATE_NL_NULL, Event: NL_REL_CNF, Next: STATE_NL_NULLTable 107 describes the significant states and events shown in the display.
Related Commands
debug frame-relay callcontrol
Displays Frame Relay Layer 3 (network layer) call control information.
debug frame-relay packet
To display information on packets that have been sent on a Frame Relay interface, use the debug frame-relay packet command in privileged EXEC mode. To disable debugging output, use the no form of this command.
debug frame-relay packet [interface name [dlci value]]
no debug frame-relay packet [interface name [dlci value]]
Syntax Description
interface name
(Optional) Name of interface or subinterface.
dlci value
(Optional) Data-link connection indentifier (DLCI) decimal value.
Command Modes
Privileged EXEC
Usage Guidelines
This command helps you analyze the packets that are sent on a Frame Relay interface. Because the debug frame-relay packet command generates a substantial amount of output, only use it when traffic on the Frame Relay network is fewer than 25 packets per second. Use the options to limit the debugging output to a specific DLCI or interface.
To analyze the packets received on a Frame Relay interface, use the debug frame-relay command.
Examples
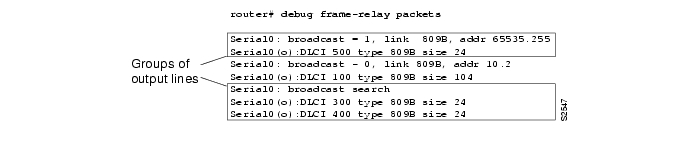
The following is sample output from the debug frame-relay packet command:
The debug frame-relay packet output consists of groups of output lines; each group describes a Frame Relay packet that has been sent. The number of lines in the group can vary, depending on the number of DLCIs on which the packet was sent. For example, the first two pairs of output lines describe two different packets, both of which were sent out on a single DLCI. The last three lines describe a single Frame Relay packet that was sent out on two DLCIs.
Table 108 describes the significant fields shown in the display.
The following lines describe a Frame Relay packet sent to a particular address; in this case AppleTalk address 10.2:
Serial0: broadcast - 0, link 809B, addr 10.2Serial0(o):DLCI 100 type 809B size 104The following lines describe a Frame Relay packet that went out on two different DLCIs, because two Frame Relay map entries were found:
Serial0: broadcast searchSerial0(o):DLCI 300 type 809B size 24Serial0(o):DLCI 400 type 809B size 24The following lines do not appear. They describe a Frame Relay packet sent to a true broadcast address.
Serial1: broadcast searchSerial1(o):DLCI 400 type 800 size 288debug frame-relay ppp
To display debugging information, use the debug frame-relay ppp command in privileged EXEC mode. To disable debugging output, use the no form of this command.
debug frame-relay ppp
no debug frame-relay ppp
Syntax Description
This command has no arguments or keywords.
Command Modes
Privileged EXEC
Usage Guidelines
This command displays error messages for link states and Local Management Interface (LMI) status changes for PPP over Frame Relay sessions.
To debug process-switched packets, use the debug frame-relay packet or debug ppp packet commands. To analyze the packets that have been sent on a Frame Relay interface, use the debug frame-relay packet command.
The debug frame-relay ppp command is generated from process-level switching only and is not CPU intensive.
Examples
The following shows output from the debug frame-relay ppp command where the encapsulation failed for VC 100.
Router# debug frame-relay pppFR-PPP: encaps failed for FR VC 100 on Serial0 downFR-PPP: input- Serial0 vc or va down, pak droppedThe following shows the output from the debug frame relay ppp and debug frame-relay packet commands. This example shows a virtual interface (virtual interface 1) establishing a PPP connection over PPP.
Router# debug frame-relay pppRouter# debug frame-relay packetVi1 LCP: O CONFREQ [Closed] id 1 len 10Vi1 LCP: MagicNumber 0xE0638565 (0x0506E0638565)Serial2/1(o): dlci 201(0x3091), NLPID 0x3CF(PPP), datagramsize 16Vi1 PPP: I pkt type 0xC021, datagramsize 14Vi1 LCP: I CONFACK [REQsent] id 1 len 10Vi1 LCP: MagicNumber 0xE0638565 (0x0506E0638565)Vi1 PPP: I pkt type 0xC021, datagramsize 14Vi1 LCP: I CONFREQ [ACKrcvd] id 6 len 10Vi1 LCP: MagicNumber 0x000EAD99 (0x0506000EAD99)Vi1 LCP: O CONFACK [ACKrcvd] id 6 len 10Vi1 LCP: MagicNumber 0x000EAD99 (0x0506000EAD99)Serial2/1(o): dlci 201(0x3091), NLPID 0x3CF(PPP), datagramsize 16Vi1 IPCP: O CONFREQ [Closed] id 1 len 10Vi1 IPCP: Address 170.100.9.10 (0x0306AA64090A)Serial2/1(o): dlci 201(0x3091), NLPID 0x3CF(PPP), datagramsize 16Vi1 PPP: I pkt type 0x8021, datagramsize 14Vi1 IPCP: I CONFREQ [REQsent] id 1 len 10Vi1 IPCP: Address 170.100.9.20 (0x0306AA640914)Vi1 IPCP: O CONFACK [REQsent] id 1 len 10Vi1 IPCP: Address 170.100.9.20 (0x0306AA640914)Serial2/1(o): dlci 201(0x3091), NLPID 0x3CF(PPP), datagramsize 16Vi1 PPP: I pkt type 0x8021, datagramsize 14Vi1 IPCP: I CONFACK [ACKsent] id 1 len 10Vi1 IPCP: Address 170.100.9.10 (0x0306AA64090A)Vi1 PPP: I pkt type 0xC021, datagramsize 16Vi1 LCP: I ECHOREQ [Open] id 1 len 12 magic 0x000EAD99Vi1 LCP: O ECHOREP [Open] id 1 len 12 magic 0xE0638565Serial2/1(o): dlci 201(0x3091), NLPID 0x3CF(PPP), datagramsize 18Vi1 LCP: O ECHOREQ [Open] id 1 len 12 magic 0xE0638565Serial2/1(o): dlci 201(0x3091), NLPID 0x3CF(PPP), datagramsize 18Vi1 LCP: echo_cnt 4, sent id 1, line upThe following shows the output for the debug frame-relay ppp and debug frame-relay packet commands that report a failed PPP over Frame Relay session. The problem is due to a challenge handshake authentication protocol (CHAP) failure.
Router# debug frame-relay pppRouter# debug frame-relay packetVi1 LCP: O CONFREQ [Listen] id 24 len 10Vi1 LCP: MagicNumber 0xE068EC78 (0x0506E068EC78)Serial2/1(o): dlci 201(0x3091), NLPID 0x3CF(PPP), datagramsize 16Vi1 PPP: I pkt type 0xC021, datagramsize 19Vi1 LCP: I CONFREQ [REQsent] id 18 len 15Vi1 LCP: AuthProto CHAP (0x0305C22305)Vi1 LCP: MagicNumber 0x0014387E (0x05060014387E)Vi1 LCP: O CONFACK [REQsent] id 18 len 15Vi1 LCP: AuthProto CHAP (0x0305C22305)Vi1 LCP: MagicNumber 0x0014387E (0x05060014387E)Serial2/1(o): dlci 201(0x3091), NLPID 0x3CF(PPP), datagramsize 21Vi1 PPP: I pkt type 0xC021, datagramsize 14Vi1 LCP: I CONFACK [ACKsent] id 24 len 10Vi1 LCP: MagicNumber 0xE068EC78 (0x0506E068EC78)Vi1 PPP: I pkt type 0xC223, datagramsize 32Vi1 CHAP: I CHALLENGE id 12 len 28 from "krishna"Vi1 LCP: O TERMREQ [Open] id 25 len 4Serial2/1(o): dlci 201(0x3091), NLPID 0x3CF(PPP), datagramsize 10Vi1 PPP: I pkt type 0xC021, datagramsize 8Vi1 LCP: I TERMACK [TERMsent] id 25 len 4Serial2/1(i): dlci 201(0x3091), pkt type 0x2000, datagramsize 303%SYS-5-CONFIG_I: Configured from console by consoleVi1 LCP: TIMEout: Time 0x199580 State Listendebug frame-relay pseudowire
To display events and errors that occur when binding a Frame Relay data-link connection identifier (DLCI) to a pseudowire, use the debug frame-relay pseudowire command in privileged EXEC mode. To disable the display of these events and errors, use the no form of this command.
debug frame-relay pseudowire
no debug frame-relay pseudowire
Syntax Description
This command contains no arguments or keywords.
Command Default
DLCI events and errors are not displayed.
Command Modes
Privileged EXEC
Command History
Usage Guidelines
The following are examples shows of Frame Relay pseudowire events:
•
•
•
Examples
The following example shows the display of Frame Relay pseudowire events. In this example, the interface has been shut down and then enabled.
Router# debug frame-relay pseudowireRouter(config)# interface hssi1/0/0Router(config-if)# shutdown09:18:33.303: FRoPW [10.15.15.15, 100]: acmgr_circuit_down09:18:33.303: FRoPW [10.15.15.15, 100]: SW AC update circuit state to down09:18:33.303: FRoPW [10.15.15.15, 100]: Setting connection DOWN09:18:35.299: %LINK-5-CHANGED: Interface Hssi1/0/0, changed state to administratively down09:18:36.299: %LINEPROTO-5-UPDOWN: Line protocol on Interface Hssi1/0/0, changed state to downRouter(config-if)# no shutdown09:18:41.919: %LINK-3-UPDOWN: Interface Hssi1/0/0, changed state to up09:18:41.919: FRoPW [10.15.15.15, 100]: Local up, sending acmgr_circuit_up09:18:41.919: FRoPW [10.15.15.15, 100]: Setting pw segment UP09:18:41.919: FRoPW [10.15.15.15, 100]: PW nni_pvc_status set ACTIVE09:18:41.919: label_oce_get_label_bundle: flags 14 label 2809:18:42.919: %LINEPROTO-5-UPDOWN: Line protocol on Interface Hssi1/0/0, changed state to upTable 109 describes the significant fields shown in the display.
debug frame-relay switching
To display debugging messages for switched Frame Relay permanent virtual circuits (PVCs), use the debug frame-relay switching command in privileged EXEC mode. To disable debugging output, use the no form of this command.
debug frame-relay switching interface interface dlci [interval interval]
no debug frame-relay switching
Syntax Description
Defaults
The default interval is 1 second.
Command Modes
Privileged EXEC
Command History
12.0(12)S
This command was introduced.
12.1(5)T
This command was integrated into Cisco IOS Release 12.1(5)T.
Usage Guidelines
The debug frame-relay switching command can be used only on switched Frame Relay PVCs, not terminated PVCs.
Debug statistics are displayed only if they have changed.
Note
Examples
The following is sample output from the debug frame-relay switching command:
Router# debug frame-relay switching interface s2/1 1000 interval 2Frame Relay switching debugging is onDisplay frame switching debug on interface Serial2/1 dlci 10001d02h: Serial2/1 dlci 1000: 32 packets switched to Serial2/0 dlci 10021d02h: Serial2/1 dlci 1000: 1800 packets output1d02h: Serial2/1 dlci 1000: 4 packets dropped - outgoing PVC inactive1d02h: Serial2/1 dlci 1000: Incoming PVC status changed to ACTIVE1d02h: Serial2/1 dlci 1000: Outgoing PVC status changed to ACTIVE1d02h: Serial2/1 dlci 1000: Incoming interface hardware module state changed to UP1d02h: Serial2/1 dlci 1000: Outgoing interface hardware module state changed to UPdebug frame-relay vc-bundle
To display information about the Frame Relay permanent virtual circuit (PVC) bundles that are configured on a router, use the debug frame-relay vc-bundle command in privileged EXEC mode. To stop the display, use the no form of this command.
debug frame-relay vc-bundle {detail | state-change} [vc-bundle-name]
no debug frame-relay vc-bundle {detail | state-change} [vc-bundle-name]
Syntax Description
Command Modes
Privileged EXEC
Command History
Usage Guidelines
Use this command to monitor state changes and Inverse ARP activity for one or all of the PVC bundles and bundle members configured on a router.
Note
Examples
The following is sample output from the debug frame-relay vc-bundle command that shows Inverse ARP information for the PVC bundle. PVC bundle member 406 is the only PVC in the bundle to handle Inverse ARP packets. The Inverse ARP packets coming in on other bundle member PVCs are dropped.
Router# debug frame-relay vc-bundle00:23:48:FR-VCB:MP-4-dynamic:inarp received on elected member 40600:23:48:FR-VCB:MP-4-dynamic:installing dynamic map00:23:48:FR-VCB:MP-4-dynamic:dropping inarp received on member 40700:23:52:FR-VCB:MP-4-dynamic:sending inarp pkt on member 406In the following example the PVC bundle goes down because the protected group goes down. All information about active transmission on each PVC is removed.
00:58:27:FR-VCB:MP-4-dynamic:member 402 state changed to DOWN00:58:27:FR-VCB:MP-4-dynamic:protected group is DOWN00:58:27:FR-VCB:MP-4-dynamic:state changed to DOWN00:58:27:FR-VCB:MP-4-dynamic:active table resetThe following is sample output from the debug frame-relay vc-bundle detail command. State change and Inverse ARP activity is displayed for all PVC bundles and bundle members on the router.
Router# debug frame-relay adjacency vc-bundle detail00:33:40: FR-VCB: MP-4-dynamic: member 404 state changed to UP00:33:40: FR-VCB: MP-4-dynamic: active table update00:33:40: FR-VCB: MP-3-static: sending inarp pkt on member 30000:33:41: FR-VCB: MP-3-static: inarp received on elected member 30000:33:48: FR-VCB: MP-3-static: inarp received on elected member 30000:33:48: FR-VCB: MAIN-1-static: dropping inarp received on member 10000:33:48: FR-VCB: MP-4-dynamic: dropping inarp received on member 40400:33:48: FR-VCB: MP-4-dynamic: dropping inarp received on member 40500:33:48: FR-VCB: P2P-5: dropping inarp received on member 50700:33:48: FR-VCB: MP-3-static: dropping inarp received on member 30300:33:48: FR-VCB: MAIN-2-dynamic: dropping inarp received on member 20200:33:48: FR-VCB: MAIN-1-static: dropping inarp received on member 10700:33:48: FR-VCB: MP-3-static: dropping inarp received on member 30500:33:48: FR-VCB: MAIN-1-static: dropping inarp received on member 10500:33:49: FR-VCB: P2P-5: dropping inarp received on member 50500:33:49: FR-VCB: P2P-5: dropping inarp received on member 50400:33:49: FR-VCB: P2P-5: dropping inarp received on member 50300:33:49: FR-VCB: P2P-5: dropping inarp received on member 50200:33:49: FR-VCB: P2P-5: dropping inarp received on member 501Related Commands
debug frame-relay adjacency
Displays information pertaining to an adjacent node that has one or more Frame Relay PVC bundles.
debug frame-relay virtual
To display debugging messages for the virtual Frame Relay interface, use the debug frame-relay virtual command in privileged EXEC mode.
debug frame-relay virtual destination interface
Syntax Description
Defaults
No default behavior or values
Command Modes
Privileged EXEC
Command History
Usage Guidelines
Use the debug frame-relay virtual command to display debugging messages for the virtual Frame Relay interface. The debug frame-relay virtual command produces output only when problems occur.
Examples
The following example shows the output if one of the routers has not been configured. This output occurs when the other end is trying to send the receiving box Frame Relay packets.
VFR: Radio1/0 has no VFR for 00:00:C068:6F:AARelated Commands
debug fras error
To display information about Frame Relay access support (FRAS) protocol errors, use the debug fras error command in privileged EXEC mode. To disable debugging output, use the no form of this command.
debug fras error
no debug fras error
Syntax Description
This command has no arguments or keywords.
Command Modes
Privileged EXEC
Usage Guidelines
For complete information on the FRAS process, use the debug fras message along with the debug fras error command.
Examples
The following is sample output from the debug fras error command. This example shows that no logical connection exists between the local station and remote station in the current setup.
Router# debug fras errorFRAS: No route, lmac 1000.5acc.7fb1 rmac 4fff.0000.0000, lSap=0x4, rSap=0x4FRAS: Can not find the SetupRelated Commands
debug fras-host activation
To display the Logical Link Control, Type 2 (LLC2) session activation and deactivation frames (such as XID, SABME, DISC, UA) that are being handled by the Frame Relay access support (FRAS) host, use the debug fras-host activation command in privileged EXEC mode. To disable debugging output, use the no form of this command.
debug fras-host activation
no debug fras-host activation
Syntax Description
This command has no arguments or keywords.
Command Modes
Privileged EXEC
Usage Guidelines
If many LLC2 sessions are being activated or deactivated at any time, this command may generate a substantial amount of output to the console.
Examples
The following is sample output from the debug fras-host activation command:
Router# debug fras-host activationFRHOST: Snd TST C to HOST, DA = 4001.3745.1088 SA = 400f.dddd.001e DSAP = 0x00 SSAP = 0x04FRHOST: Fwd BNN XID to HOST, DA = 4001.3745.1088 SA = 400f.dddd.001e DSAP = 0x04 SSAP = 0x04FRHOST: Fwd HOST XID to BNN, DA = 400f.dddd.001e SA = 4001.3745.1088 DSAP = 0x04 SSAP = 0x05FRHOST: Fwd BNN XID to HOST, DA = 4001.3745.1088 SA = 400f.dddd.001e DSAP = 0x04 SSAP = 0x04FRHOST: Fwd HOST SABME to BNN, DA = 400f.dddd.001e SA = 4001.3745.1088 DSAP = 0x04 SSAP = 0x04FRHOST: Fwd BNN UA to HOST, DA = 4001.3745.1088 SA = 400f.dddd.001e DSAP = 0x04 SSAP = 0x05The first line indicates that the FRAS Host sent a TEST Command to the host. In the second line, the FRAS Host forwards an XID frame from a BNN device to the host. In the third line, the FRAS Host forwards an XID from the host to the BNN device.
Table 110 describes the significant fields shown in the display.
debug fras-host error
To enable the Frame Relay access support (FRAS) Host to send error messages to the console, use the debug fras-host error command in privileged EXEC mode. To disable debugging output, use the no form of this command.
debug fras-host error
no debug fras-host error
Syntax Description
This command has no arguments or keywords.
Command Modes
Privileged EXEC
Examples
The following is sample output from the debug fras-host error command when the I-field in a TEST Response frame from a host does not match the I-field of the TEST Command sent by the FRAS Host:
Router# debug fras-host errorFRHOST: SRB TST R Protocol Violation - LLC I-field not maintained.debug fras-host packet
To see which Logical Link Control, type 2 (LLC2) session frames are being handled by the Frame Relay access support (FRAS) Host, use the debug fras-host packet command in privileged EXEC mode. To disable debugging output, use the no form of this command.
debug fras-host packet
no debug fras-host packet
Syntax Description
This command has no arguments or keywords.
Command Modes
Privileged EXEC
Usage Guidelines
Use this command with great care. If many LLC2 sessions are active and passing data, this command may generate a substantial amount of output to the console and impact device performance.
Examples
The following is sample output from the debug fras-host packet command:
Router# debug fras-host packetFRHOST: Snd TST C to HOST, DA = 4001.3745.1088 SA = 400f.dddd.001e DSAP = 0x00 SSAP = 0x04FRHOST: Fwd BNN XID to HOST, DA = 4001.3745.1088 SA = 400f.dddd.001e DSAP = 0x04 SSAP = 0x04FRHOST: Fwd HOST XID to BNN, DA = 400f.dddd.001e SA = 4001.3745.1088 DSAP = 0x04 SSAP = 0x05FRHOST: Fwd BNN XID to HOST, DA = 4001.3745.1088 SA = 400f.dddd.001e DSAP = 0x04 SSAP = 0x04FRHOST: Fwd HOST SABME to BNN, DA = 400f.dddd.001e SA = 4001.3745.1088 DSAP = 0x04 SSAP = 0x04FRHOST: Fwd BNN UA to HOST, DA = 4001.3745.1088 SA = 400f.dddd.001e DSAP = 0x04 SSAP = 0x05FRHOST: Fwd HOST LLC-2 to BNN, DA = 400f.dddd.001e SA = 4001.3745.1088 DSAP = 0x04 SSAP = 0x04FRHOST: Fwd BNN LLC-2 to HOST, DA = 4001.3745.1088 SA = 400f.dddd.001e DSAP = 0x04 SSAP = 0x05FRHOST: Fwd HOST LLC-2 to BNN, DA = 400f.dddd.001e SA = 4001.3745.1088 DSAP = 0x04 SSAP = 0x04FRHOST: Fwd BNN LLC-2 to HOST, DA = 4001.3745.1088 SA = 400f.dddd.001e DSAP = 0x04 SSAP = 0x04The debug fras-host packet output contains all of the output from the debug fras-host activation command and additional information. The first six lines of this sample display are the same as the output from the debug fras-host activation command. The last lines show LLC-2 frames being sent between the Frame Relay Boundary Network Node (BNN) device and the host.
Table 111 describes the significant fields shown in the display.
debug fras-host snmp
To display messages to the console describing Simple Network Management Protocol (SNMP) requests to the Frame Relay access support (FRAS) Host MIB, use the debug fras-host snmp command in privileged EXEC mode. To disable debugging output, use the no form of this command.
debug fras-host snmp
no debug fras-host snmp
Syntax Description
This command has no arguments or keywords.
Command Modes
Privileged EXEC
Usage Guidelines
Use of this command may result in a substantial amount of output to the screen. Only use this command for problem determination.
Examples
The following is sample output from the debug fras-host snmp command. In this example, the MIB variable k_frasHostConnEntry_get() is providing SNMP information for the FRAS host.
Router# debug fras-host snmpk_frasHostConnEntry_get(): serNum = -1, vRingIfIdx = 31, frIfIdx = 12Hmac = 4001.3745.1088, frLocSap = 4, Rmac = 400f.dddd.001e, frRemSap = 4Table 112 describes the significant fields shown in the display.
debug fras message
To display general information about Frame Relay access support (FRAS) messages, use the debug fras message command in privileged EXEC mode. To disable debugging output, use the no form of this command.
debug fras message
no debug fras message
Syntax Description
This command has no arguments or keywords.
Command Modes
Privileged EXEC
Usage Guidelines
For complete information on the FRAS process, use the debug fras error command along with the debug fras message command.
Examples
The following is sample output from the debug fras message command. This example shows incoming Cisco Link Services (CLS) primitives.
Router# debug fras messageFRAS: receive 4C23FRAS: receive CC09Related Commands
debug fras state
To display information about Frame Relay access support (FRAS) data-link control link-state changes, use the debug fras state command in privileged EXEC mode. To disable debugging output, use the no form of this command.
debug fras state
no debug fras state
Syntax Description
This command has no arguments or keywords.
Command Modes
Privileged EXEC
Examples
The following is sample output from the debug fras state command. This example shows the state changing from a request open station is sent state to an exchange XID state.
Possible states are the following: reset, request open station is sent, exchange xid, connection request is sent, signal station wait, connection response wait, connection response sent, connection established, disconnect wait, and number of link states.
Router# debug fras stateFRAS: TR0 (04/04) oldstate=LS_RQOPNSTNSENT, input=RQ_OPNSTN_CNFFRAS: newstate=LS_EXCHGXIDRelated Commands
debug ftpserver
To display information about the FTP server process, use the debug ftpserver command in privileged EXEC mode. To disable debugging output, use the no form of this command.
debug ftpserver
no debug ftpserver
Syntax Description
This command has no arguments or keywords.
Command Modes
Privileged EXEC
Examples
The following is sample output from the debug ftpserver command:
Router# debug ftpserverMar 3 10:21:10: %FTPSERVER-6-NEWCONN: FTP Server - new connection made.-Process= "TCP/FTP Server", ipl= 0, pid= 53Mar 3 10:21:10: FTPSRV_DEBUG:FTP Server file path: 'disk0:'Mar 3 10:21:10: FTPSRV_DEBUG:(REPLY) 220Mar 3 10:21:10: FTPSRV_DEBUG:FTProuter IOS-FTP server (version 1.00) ready.Mar 3 10:21:10: FTPSRV_DEBUG:FTP Server Command received: 'USER aa'Mar 3 10:21:20: FTPSRV_DEBUG:(REPLY) 331Mar 3 10:21:20: FTPSRV_DEBUG:Password required for 'aa'.Mar 3 10:21:20: FTPSRV_DEBUG:FTP Server Command received: 'PASS aa'Mar 3 10:21:21: FTPSRV_DEBUG:(REPLY) 230Mar 3 10:21:21: FTPSRV_DEBUG:Logged in.Mar 3 10:21:21: FTPSRV_DEBUG:FTP Server Command received: 'SYST'Mar 3 10:21:21: FTPSRV_DEBUG:(REPLY) 215Mar 3 10:21:21: FTPSRV_DEBUG:Cisco IOS Type: L8 Version: IOS/FTP 1.00Mar 3 10:21:21: FTPSRV_DEBUG:FTP Server Command received: 'PWD'Mar 3 10:21:35: FTPSRV_DEBUG:(REPLY) 257Mar 3 10:21:39: FTPSRV_DEBUG:FTP Server Command received: 'CWD disk0:/syslogd.d'r/'Mar 3 10:21:45: FTPSRV_DEBUG:FTP Server file path: 'disk0:/syslogd.dir'Mar 3 10:21:45: FTPSRV_DEBUG:(REPLY) 250Mar 3 10:21:45: FTPSRV_DEBUG:CWD command successful.Mar 3 10:21:45: FTPSRV_DEBUG:FTP Server Command received: 'PORT 171,69,30,20,22',32Mar 3 10:21:46: FTPSRV_DEBUG:(REPLY) 200Mar 3 10:21:46: FTPSRV_DEBUG:PORT command successful.Mar 3 10:21:46: FTPSRV_DEBUG:FTP Server Command received: 'LIST'Mar 3 10:21:47: FTPSRV_DEBUG:FTP Server file path: 'disk0:/syslogd.dir/.'Mar 3 10:21:47: FTPSRV_DEBUG:(REPLY) 220Mar 3 10:23:11: FTPSRV_DEBUG:Opening ASCII mode data connection for file list.Mar 3 10:23:11: FTPSRV_DEBUG:(REPLY) 226Mar 3 10:23:12: FTPSRV_DEBUG:Transfer complete.Mar 3 10:23:12: FTPSRV_DEBUG:FTP Server Command received: 'TYPE I'Mar 3 10:23:14: FTPSRV_DEBUG:(REPLY) 200Mar 3 10:23:14: FTPSRV_DEBUG:Type set to I.Mar 3 10:23:14: FTPSRV_DEBUG:FTP Server Command received: 'PORT 171,69,30,20,22',51Mar 3 10:23:20: FTPSRV_DEBUG:(REPLY) 200Mar 3 10:23:20: FTPSRV_DEBUG:PORT command successful.Mar 3 10:23:20: FTPSRV_DEBUG:FTP Server Command received: 'RETR syslogd.1'Mar 3 10:23:21: FTPSRV_DEBUG:FTP Server file path: 'disk0:/syslogd.dir/syslogd.1'Mar 3 10:23:21: FTPSRV_DEBUG:FTPSERVER: Input path passed Top-dir(disk0:/syslogd.dir/) test.Mar 3 10:23:21: FTPSRV_DEBUG:(REPLY) 150Mar 3 10:23:21: FTPSRV_DEBUG:Opening BINARY mode data connection for syslogd.1 (607317 bytes).Mar 3 10:23:21: FTPSRV_DEBUG:(REPLY) 226Mar 3 10:23:29: FTPSRV_DEBUG:Transfer complete.The sample output corresponds to the following FTP client session. In this example, the user connects to the FTP server, views the contents of the top-level directory, and gets a file.
FTPclient% ftp FTProuterConnected to FTProuter.cisco.com.220 FTProuter IOS-FTP server (version 1.00) ready.Name (FTProuter:me): aa331 Password required for 'aa'.Password:230 Logged in.Remote system type is Cisco.ftp> pwd257 "disk0:/syslogd.dir/" is current directory.ftp> dir200 PORT command successful.150 Opening ASCII mode data connection for file list.syslogd.1syslogd.2syslogd.3syslogd.4syslogd.5syslogd.6syslogd.7syslogd.8syslogd.9syslogd.cur226 Transfer complete.ftp> bin200 Type set to I.ftp> get syslogd.1200 PORT command successful.150 Opening BINARY mode data connection for syslogd.1 (607317 bytes).226 Transfer complete.607317 bytes received in 7.7 seconds (77 Kbytes/s)ftp>The following debug ftpserver command output indicates that no top-level directory is specified. Therefore, the client cannot access any location on the FTP server. Use the ftp-server topdir command to specify the top-level directory.
Mar 3 10:29:14: FTPSRV_DEBUG:(REPLY) 550Mar 3 10:29:14: FTPSRV_DEBUG:Access denied to 'disk0:'debug gatekeeper gup
To display the Gatekeeper Update Protocol (GUP) events or Abstract Syntax Notation 1 (ASN.1) details, use the debug gatekeeper gup command in privileged EXEC mode. To disable debugging output, use the no form of this command.
debug gatekeeper gup {events | asn1}
no debug gatekeeper gup {events | asn1}
Syntax Description
Defaults
Debugging is not enabled.
Command Modes
Privileged EXEC
Command History
Examples
The following example shows how to enable a packet dump of all GUP announcement messages:
Router# debug gatekeeper gup asn100:10:21:ENCODE BUFFER::= 00 0A2A8648 86F70C0A 00000120 001E800186A08001 86A00547 656E6576 614E0000 00000142 80004700 65006E00 6500760061080050 00610072 00690073 00000000 000000:10:21:00:10:21:PDU ::=value GUP_Information ::=protocolIdentifier { 1 2 840 113548 10 0 0 1 }message announcementIndication :announcementInterval 30endpointCapacity 100000callCapacity 100000hostName '47656E657661'HpercentMemory 39percentCPU 0currentCalls 0currentEndpoints 0zoneInformationgatekeeperIdentifier {"Geneva"}altGKIdentifier {"Paris"}totalBandwidth 0interzoneBandwidth 0remoteBandwidth 0RAW_BUFFER::=00 0A2A8648 86F70C0A 00000120 001E800B 858A8001 86A00144 80007400 6F007200 6E006100 64006F00 2D006700 6B120063 00790063 006C006F 006E0065 002D0067 006B0000 00000000*Mar 3 15:40:31:*Mar 3 15:40:31:Sending GUP ANNOUNCEMENT INDICATION to 172.18.195.140RAW_BUFFER::=00 0A2A8648 86F70C0A 00000120 001E800A EF8A8001 86A00144 80006300 79006300 6C006F00 6E006500 2D006700 6B120074 006F0072 006E0061 0064006F 002D0067 006B0000 00000000*Mar 3 15:40:31:PDU DATA = 60EAB248value GUP_Information ::=protocolIdentifier { 1 2 840 113548 10 0 0 1 }message announcementIndication :{announcementInterval 30endpointCapacity 716682callCapacity 100000zoneInformationgatekeeperIdentifier {"cyclone-gk"}altGKIdentifier {"tornado-gk"}totalBandwidth 0interzoneBandwidth 0remoteBandwidth 0Mar 3 15:40:31:Received GUP ANNOUNCEMENT INDICATION from 172.18.195.140u allAll possible debugging has been turned offRelated Commands
debug gatekeeper load
To display gatekeeper load-balancing debug events, use the debug gatekeeper load command in privileged EXEC mode. To disable debugging output, use the no form of this command.
debug gatekeeper load events
no debug gatekeeper load events
Syntax Description
Defaults
Debugging is not enabled.
Command Modes
Privileged EXEC
Command History
Examples
The following is sample output for the debug gatekeeper load command.
Note
Router# debug gatekeeper loadRouter#Router# show debugginggk load-balancing debug level = EventsRouter#gk_load_overloaded:Overloaded, 5-second CPU utilization too highgk_load_overloaded:Overloaded due to excessive calls/endpointsgk_load_balance_endpt_request:load balance occurred. New load_balance_count=2Related Commands
debug gatekeeper server
To trace all the message exchanges between the Cisco IOS Gatekeeper and the external applications, use the debug gatekeeper server command in privileged EXEC mode. To disable debugging output, use the no form of this command.
debug gatekeeper server
no debug gatekeeper server
Syntax Description
This command has no arguments or keywords.
Defaults
Disabled
Command Modes
Privileged EXEC
Command History
Usage Guidelines
Use this command to see information about a Gatekeeper server. This command shows any errors that occur in sending messages to the external applications or in parsing messages from the external applications.
Examples
The following example shows debugging information about a Gatekeeper server:
Router# debug gatekeeper serversRouter# show debugGatekeeper:Gatekeeper Server Messages debugging is onTo turn the Gatekeeper server debugging message off, see the following examples:
Router# no debug allRouter# no debug gatekeeper serversRelated Commands
show gatekeeper server
Displays information about the Gatekeeper servers configured on your network by ID.
debug ggsn quota-server
To display debug information related to quota server processing on the GGSN, use the debug ggsn quota-server privilege EXEC command.
debug ggsn quota-server [detail | packets [dump] | events | parsing | errors]
Syntax Description
Defaults
No default behavior or values.
Command Modes
Privilege EXEC
Command History
12.3(14)YQ
This command was introduced.
12.4(9)T
This command was integrated into Cisco IOS Release 12.4(9)T.
Usage Guidelines
This command is useful for system operators and development engineers if problems are encountered with communication between the GGSN quota server process and the CSG.
Examples
The following example enables the display of detailed quota server processing debug output—pre-allocated quota and quota push:
Router# debug ggsn quota-server detailggsn quota-server details debugging is onRouter#Jun 2 02:40:39.391: GGSN-QS:Encoding QUOTA PUSH REQUESTJun 2 02:40:39.391: GGSN-QS:Adding TLV USER_INDEXJun 2 02:40:39.391: GGSN-QS: IP Address: 3.3.3.1 User ID: 12345Jun 2 02:40:39.391: GGSN-QS:Adding TLV SERVICE_ID: 1Jun 2 02:40:39.391: GGSN-QS:Adding TLV QUADRANS_GRANTEDJun 2 02:40:39.391: GGSN-QS: Quadrans: 1250 Threshold: 1000 Units: SECONDSJun 2 02:40:39.391: GGSN-QS:Adding TLV QUADRANS_GRANTEDJun 2 02:40:39.391: GGSN-QS: Quadrans: 5000 Threshold: 5000 Units: BYTES_IPJun 2 02:40:39.391: GGSN-QS:Adding TLV TIMEOUT: 50000Jun 2 02:40:39.391: GGSN-QS:Adding TLV TARIFF_TIME: 1147698000Jun 2 02:40:39.391: GGSN-QS:Sending QUOTA_PUSH_REQ from QS (4.4.4.4:3386) to CSG (30.1.1.1:3386)Jun 2 02:40:39.395: pak=0x6523B5B0, datagramstart=0x200143D8, network_start=0x200143BC datagramsize 91Jun 2 02:40:39.395: GGSN-QS msgtype 0xF0, seq 1, len 85, from 4.4.4.4:3386 to 30.1.1.1:3386200143D0: 0FF00055 00017E01 .p.U..~.200debug ggsn quota-server detail143E0: FC005001 31000000 4A002E00 46001400 |.P.1...J...F...200143F0: 09030303 01313233 34350015 00013100 .....12345....1.20014400: 2D000E00 00000000 0004E201 03000003 -.........b.....20014410: E8002D00 0E000000 00000013 88020300 h.-.............20014420: 00138800 17000400 00C35000 4D000444 .........CP.M..D20014430: 687B50 h{PJun 2 02:40:39.395: GGSN-QS:Received Data Record Transfer Response from (30.1.1.1:3386) Sequence number 1Jun 2 02:40:39.395: GGSN-QS:Cause = 128Jun 2 02:40:39.395: GGSN-QS:Request Responded Sequence Number = 1Jun 2 02:40:39.395: GGSN-QS:Private Ext IE length 32 QM Rsp length 29Jun 2 02:40:39.395: GGSN-QS:Received message QUOTA_PUSH_RESP from CSGJun 2 02:40:39.395: GGSN-QS:UserIndex TLV: IP Address 3.3.3.1 UserName/MSISDN 12345Jun 2 02:40:39.395: GGSN-QS:Session ID TLV: 1736898353Jun 2 02:40:39.395: GGSN-QS:Service ID TLV: 1Jun 2 02:40:39.399: GGSN-QS:Detected real CSG 30.1.1.1 for virtual CSG 30.1.1.1Jun 2 02:40:39.399: GGSN-QS:real CSG newly detectedggsn quota-server details debugging is ondebug gprs category fsm event
To display debug information related to service-aware GGSN category events, and state transactions, use the debug gprs category fsm event privilege EXEC command.
debug gprs category fsm event
Syntax Description
This command has no arguments or keywords.
Defaults
No default behavior or values.
Command Modes
Privilege EXEC
Command History
12.3(14)YQ
This command was introduced.
12.4(9)T
This command was integrated into Cisco IOS Release 12.4(9)T.
Usage Guidelines
This command is useful for system operators and development engineers if problems are encountered with eGGSN processing.
Examples
Example 1—PDPs with Pre-Allocated Quota
The following example enables the display of eGGSN events and state transactions—pre-allocated quota. This is PDP context create, prepaid user data transfer, and then context teardown.
PDP Context Create:
Router# debug gprs category fsm eventeGGSN category fsm event debugging is onRouter#Jun 2 02:55:08.491: GPRS:1234050000000010:created service-aware subblockJun 2 02:55:11.383: GPRS:1234050000000010:it is the only one PDP of the user, need CCR msgJun 2 02:55:11.383: GPRS:1234050000000010:sent ccr_initJun 2 02:55:11.823: GPRS:1234050000000010:create new category 1Jun 2 02:55:11.823: GPRS:1234050000000010:shdb 0xFB00001C created for category 1 (handle 0x8C000007)Jun 2 02:55:11.823: GPRS:1234050000000010:successfully create a categoryJun 2 02:55:14.623: GPRS:1234050000000010:created sync_object for CREATE_PDPJun 2 02:55:14.623: GPRS:1234050000000010:get 1 impacted categories into sync_object for CREATE_PDPJun 2 02:55:14.623: GPRS:1234050000000010:insert category 1 from sync_object for CREATE_PDPJun 2 02:55:14.623: GPRS:1234050000000010:number of really impacted by CREATE_PDP = 1Jun 2 02:55:14.623: GPRS:1234050000000010:FSM_ggsn_rcvd_quotaJun 2 02:55:14.623: GPRS:1234050000000010:category 1 trans from INIT to PENDING QP on event CCA_QUOTAJun 2 02:55:14.627: GPRS:1234050000000010:FSM_ggsn_rcvd_qp_ack_in_qpJun 2 02:55:14.627: GPRS:1234050000000010:remove category 1 from sync_object for CREATE_PDP 0 still pending in the sync_objectJun 2 02:55:14.627: GPRS:1234050000000010:send Create PDP Context Res to SGSNJun 2 02:55:14.627: GPRS:1234050000000010:delete sync object for CREATE_PDP, it has 0 categoriesJun 2 02:55:14.627: GPRS:1234050000000010:category 1 trans from PENDING QP to AUTHORIZED on event CSG_QP_ACKPDP Context Delete:
Router#Jun 2 02:55:31.455: GPRS:1234050000000010:look up category by 1 found 65EEB128Jun 2 02:55:31.455: GPRS:1234050000000010:FSM_ggsn_rcvd_stopJun 2 02:55:31.455: GPRS:category 1 report usage queue size = 2Jun 2 02:55:31.455: GPRS:1234050000000010:usage unit has total_octets 0Jun 2 02:55:31.455: GPRS:1234050000000010:usage unit has total_octets 300Jun 2 02:55:31.455: GPRS:1234050000000010:category 1 , usage 6615E470Jun 2 02:55:31.455: GPRS:1234050000000010:no sync_object for service stopJun 2 02:55:31.455: %GPRSFLTMG-4-CHARGING: GSN: 0.0.0.0, TID: 0000000000000000, APN: NULL, Reason: 1, unexpected CSG usage report causeJun 2 02:55:31.455: GPRS:1234050000000010:send CCR_UPDATE to DCCA server return okJun 2 02:55:31.455: GPRS:releasing 2 usages in categoryJun 2 02:55:31.455: GPRS:release_usage_parameterJun 2 02:55:31.455: GPRS:1234050000000010:category 1 trans from AUTHORIZED to IDLE on event CSG_SERVICE_STOPJun 2 02:55:34.939: GPRS:1234050000000010:eggsn_get_final_usage_reportJun 2 02:55:34.939: GPRS:1234050000000010:freeing all categoriesJun 2 02:55:34.939: GPRS:1234050000000010:delete_category 1Jun 2 02:55:34.939: GPRS:1234050000000010:freeing service-aware subblockExample 2—PDPs without Pre-Allocated Quota
The following example enables the display of eGGSN events and state transactions—for PDPs without pre-allocated quota.
PDP Context Create:
Router# debug gprs category fsm eventeGGSN category fsm event debugging is onRouter#Jun 2 02:58:45.727: GPRS:1234050000000010:created service-aware subblockJun 2 02:58:48.623: GPRS:1234050000000010:it is the only one PDP of the user, need CCR msgJun 2 02:58:48.623: GPRS:1234050000000010:sent ccr_initPDP Context Delete:
Router#Jun 2 02:59:06.975: GPRS:1234050000000010:eggsn_get_final_usage_reportJun 2 02:59:06.975: GPRS:1234050000000010:freeing all categoriesJun 2 02:59:06.975: GPRS:1234050000000010:freeing service-aware subblockdebug gprs dcca
To display troubleshooting information about Diameter Credit Control Application (DCCA) processing on the gateway GPRS support node (GGSN), use the debug gprs dcca privilege EXEC command.
debug gprs dcca
Syntax Description
This command has no arguments or keywords.
Defaults
No default behavior or values.
Command Modes
Privilege EXEC
Command History
12.3(14)YQ
This command was introduced.
12.4(9)T
This command was integrated into Cisco IOS Release 12.4(9)T.
Usage Guidelines
This command is useful for system operators and development engineers if Diameter protocol problems are encountered on the GGSN.
Examples
Example 1
The following is a sample of DCCA debug information with pre-allocated quota.
Router# debug gprs dccaRouter#Jun 2 03:13:45.827: GPRS:1234050000000010:GPRS:DCCA: 3GPP-IMSI : 214350000000000Jun 2 03:13:45.831: GPRS:1234050000000010:GPRS:DCCA: 3GPP-Charging-Id : 613053186Jun 2 03:13:45.831: GPRS:1234050000000010:GPRS:DCCA: 3GPP-PDP-Type : 0Jun 2 03:13:45.831: GPRS:1234050000000010:GPRS:DCCA: 3GPP-CG-Address : 20.1.1.1Jun 2 03:13:45.831: GPRS:1234050000000010:GPRS:DCCA: 3GPP-QoS-Profile : 99-0911012964FFFF1100FFFFJun 2 03:13:45.831: GPRS:1234050000000010:GPRS:DCCA: 3GPP-SGSN-Address : 11.20.1.1Jun 2 03:13:45.831: GPRS:1234050000000010:GPRS:DCCA: 3GPP-GGSN-Address : 10.20.61.1Jun 2 03:13:45.831: GPRS:1234050000000010:GPRS:DCCA: 3GPP-IMSI-MCC-MNC : 21435Jun 2 03:13:45.831: GPRS:1234050000000010:GPRS:DCCA: 3GPP-GGSN-MCC-MNC : 001002Jun 2 03:13:45.831: GPRS:1234050000000010:GPRS:DCCA: 3GPP-NSAPI : 1Jun 2 03:13:45.831: GPRS:1234050000000010:GPRS:DCCA: 3GPP-Selection-Mode : 0Jun 2 03:13:45.831: GPRS:1234050000000010:3GPP-Charging-Char : 0100Jun 2 03:13:45.831: GPRS:1234050000000010:GPRS DCCA: Starting Tx timer , value = 100000Jun 2 03:13:45.831: GPRS:1234050000000010:DCCA FSM:Event = CCR_INITIAL, Old State = IDLE, New State = PENDING_IJun 2 03:13:46.287: GPRS:1234050000000010:GPRS DCCA: Result-Code = 2001Jun 2 03:13:46.287: GPRS:1234050000000010:GPRS DCCA: Stopping Tx timerJun 2 03:13:46.287: GPRS:1234050000000010:GPRS DCCA: Result-Code for Category : 1 = 2001Jun 2 03:13:46.287: GPRS:1234050000000010:DCCA FSM:Event = CCA_SUCCESS, Old State = PENDING_I, New State = OPENRouter#Router#show gprs gtp pdp tid 1234050000000010 ser allDiameter Credit Control: EnabledCurrent Billing status: PrepaidReason to convert to postpaid: N/ACharging Profile Index: 1DCCA profile name: dcca-profile1, Source: charging profileRule base id: 1, Source: DCCA serverServiceID State Quota(octets)1 AUTHORIZED 5000Router#PDP being deletedExample 2
The following is a sample of DCCA debug information without pre-allocated quota.
Router# show debugGPRS:GPRS DCCA Events debugging is onRouter#Jun 2 03:05:07.743: GPRS:1234050000000010:GPRS:DCCA: 3GPP-IMSI : 214350000000000Jun 2 03:05:07.743: GPRS:1234050000000010:GPRS:DCCA: 3GPP-Charging-Id : 613053181Jun 2 03:05:07.743: GPRS:1234050000000010:GPRS:DCCA: 3GPP-PDP-Type : 0Jun 2 03:05:07.743: GPRS:1234050000000010:GPRS:DCCA: 3GPP-CG-Address : 20.1.1.1Jun 2 03:05:07.743: GPRS:1234050000000010:GPRS:DCCA: 3GPP-QoS-Profile : 99-0911012964FFFF1100FFFFJun 2 03:05:07.743: GPRS:1234050000000010:GPRS:DCCA: 3GPP-SGSN-Address : 11.20.1.1Jun 2 03:05:07.743: GPRS:1234050000000010:GPRS:DCCA: 3GPP-GGSN-Address : 10.20.61.1Jun 2 03:05:07.743: GPRS:1234050000000010:GPRS:DCCA: 3GPP-IMSI-MCC-MNC : 21435Jun 2 03:05:07.743: GPRS:1234050000000010:GPRS:DCCA: 3GPP-GGSN-MCC-MNC : 001002Jun 2 03:05:07.743: GPRS:1234050000000010:GPRS:DCCA: 3GPP-NSAPI : 1Jun 2 03:05:07.743: GPRS:1234050000000010:GPRS:DCCA: 3GPP-Selection-Mode : 0Jun 2 03:05:07.743: GPRS:1234050000000010:3GPP-Charging-Char : 0100Jun 2 03:05:07.743: GPRS:1234050000000010:GPRS DCCA: Starting Tx timer , value = 100000Jun 2 03:05:07.743: GPRS:1234050000000010:DCCA FSM:Event = CCR_INITIAL, Old State = IDLE, New State = PENDING_IJun 2 03:05:08.167: GPRS:1234050000000010:GPRS DCCA: Result-Code = 2001Jun 2 03:05:08.167: GPRS:1234050000000010:GPRS DCCA: Stopping Tx timerJun 2 03:05:08.167: GPRS:1234050000000010:DCCA FSM:Event = CCA_SUCCESS, Old State = PENDING_I, New State = OPENRouter#gprs5-72b#sgpt 1234050000000010 ser allDiameter Credit Control: EnabledCurrent Billing status: PrepaidReason to convert to postpaid: N/ACharging Profile Index: 1DCCA profile name: dcca-profile1, Source: charging profileRule base id: 1, Source: DCCA serverServiceID State Quota(octets)gprs5-72b#clear gprs gtp pdp allPDP deletedRouter#Jun 2 03:05:28.459: GPRS:1234050000000010:GPRS:DCCA: 3GPP-IMSI : 214350000000000Jun 2 03:05:28.459: GPRS:1234050000000010:GPRS:DCCA: 3GPP-Charging-Id : 613053181Jun 2 03:05:28.459: GPRS:1234050000000010:GPRS:DCCA: 3GPP-PDP-Type : 0Jun 2 03:05:28.459: GPRS:1234050000000010:GPRS:DCCA: 3GPP-CG-Address : 20.1.1.1Jun 2 03:05:28.459: GPRS:1234050000000010:GPRS:DCCA: 3GPP-QoS-Profile : 99-0911012964FFFF1100FFFFJun 2 03:05:28.459: GPRS:1234050000000010:GPRS:DCCA: 3GPP-SGSN-Address : 11.20.1.1Jun 2 03:05:28.459: GPRS:1234050000000010:GPRS:DCCA: 3GPP-GGSN-Address : 10.20.61.1Jun 2 03:05:28.459: GPRS:1234050000000010:GPRS:DCCA: 3GPP-IMSI-MCC-MNC : 21435Jun 2 03:05:28.459: GPRS:1234050000000010:GPRS:DCCA: 3GPP-GGSN-MCC-MNC : 001002Jun 2 03:05:28.459: GPRS:1234050000000010:GPRS:DCCA: 3GPP-NSAPI : 1Jun 2 03:05:28.459: GPRS:1234050000000010:GPRS:DCCA: 3GPP-Selection-Mode : 0Jun 2 03:05:28.459: GPRS:1234050000000010:3GPP-Charging-Char : 0100Jun 2 03:05:28.463: GPRS:1234050000000010:GPRS DCCA: Stopping Tx timerJun 2 03:05:28.463: GPRS:1234050000000010:DCCA FSM:Event = CCR_FINAL, Old State = OPEN, New State = PENDING_TJun 2 03:05:28.463: GPRS:1234050000000010:GPRS DCCA: Stopping Tx timerJun 2 03:05:28.871: GPRS:GPRS DCCA: DCCA request was cancelled, Droping AAA replyRouter#Router#sgpt 1234050000000010 ser all%ERROR: Cannot find the PDPdebug gprs redundancy
To display debug messages, errors, events, or packets related to GTP session redundancy (GTP-SR), use the debug gprs redundancy privileged EXEC command. To disable debugging output, use the no form of this command.
debug gprs redundancy [debug | errors | events | packets]
no debug gprs redundancy [debug | errors | events | packets]
Syntax Description
debug
Displays debug messages related to GTP-SR.
errors
Displays errors related to GTP-SR.
events
Displays events related to GTP-SR.
packets
Displays packets related to GTP-SR packets.
Defaults
Disabled.
Command Modes
Global configuration
Command History
Usage Guidelines
This command displays debug level messages, errors, events, or packets for GTP-SR. It is useful for system operators and development engineers if problems are encountered with communication between the two GGSNs configured as an redundant pair and on which GTP-SR is enabled.
Examples
Example 1.
The following sample outputs is for a GGSN failover and switchover of Standby to Active. There is no PDP context involved in this debug collection.
Active GGSN:
Router# show gprs redundancyGPRS redundancy is enabled and Unit-Status is StandbyRedundancy Transport Infrastructure statusRedundancy Infrastructure state: STANDBY HOTPeer Redundancy Infrastructure state: ACTIVEGGSN Redundancy system up since: 21:29:21 EDT Aug 19 2000Time of last switchover: neverTotal Number of Switchovers: 2GPRS Redundancy StatisticsLast cleared: neverCheckPointed-From-Active StatisticsTotal Number of Messages: 129Number of Context Setup messages: 19Number of Context Modify messages: 3Number of Context Remove messages: 19Number of Path Setup messages: 34Number of Path Modify messages: 5Number of Path Remove messages: 34Number of CGF Ready messages: 1Number of CGF Modify messages: 0Number of CGF Remove messages: 0Number of Internal State messages: 7Router# debug gprs redundancyGPRS CF packets debugging is onGPRS CF events debugging is onGPRS CF errors debugging is onGPRS CF debug debugging is onRouter#Router#Router#MWAM 10/2: 000064: Jun 1 2006 18:19:00.975 EDT: %HSRP-6-STATECHANGE: GigabitEthernet0/0.1100 Grp 51 state Standby -> ActiveMWAM 10/2: 000065: Jun 1 2006 18:19:00.975 EDT: GTP-SR: RF_Status=403-RF_STATUS_MAINTENANCE_ENABLE RFState=9-ACTIVE-FAST operand=0 RFPeerState=13-ACTIVEMWAM 10/2: 000066: Jun 1 2006 18:19:00.979 EDT: GTP-SR: RF_Event=200-RF_PROG_ACTIVE_FAST RFState=9-ACTIVE-FAST operand=0 RFPeerState=13-ACTIVEMWAM 10/2: 000067: Jun 1 2006 18:19:00.979 EDT: GTP-SR: Received RF Progression Active FastMWAM 10/2: 000068: Jun 1 2006 18:19:00.979 EDT: GTP-SR: RF_Event=201-RF_PROG_ACTIVE_DRAIN RFState=10-ACTIVE-DRAIN operand=0 RFPeerState=13-ACTIVEMWAM 10/2: 000069: Jun 1 2006 18:19:00.979 EDT: GTP-SR: Received RF Progression Active DrainMWAM 10/2: 000070: Jun 1 2006 18:19:00.979 EDT: GTP-SR: RF_Event=202-RF_PROG_ACTIVE_PRECONFIG RFState=11-ACTIVE_PRECONFIG operand=0 RFPeerState=13-ACTIVEMWAM 10/2: 000071: Jun 1 2006 18:19:00.979 EDT: GTP-SR: Received RF Progression Active PreConfigMWAM 10/2: 000072: Jun 1 2006 18:19:00.979 EDT: GTP-SR: RF_Event=203-RF_PROG_ACTIVE_POSTCONFIG RFState=12-ACTIVE_POSTCONFIG operand=0 RFPeerState=13-ACTIVEMWAM 10/2: 000073: Jun 1 2006 18:19:00.979 EDT: GTP-SR: Received RF Progression Active PostConfigMWAM 10/2: 000074: Jun 1 2006 18:19:00.979 EDT: GTP-SR: RF_Event=204-RF_PROG_ACTIVE RFState=13-ACTIVE operand=0 RFPeerState=13-ACTIVEMWAM 10/2: 000075: Jun 1 2006 18:19:00.979 EDT: GTP-SR: Received RF Progression ActiveMWAM 10/2: 000076: Jun 1 2006 18:19:00.979 EDT: GTP-SR: Start of the Standby-to-Active transitionMWAM 10/2: 000077: Jun 1 2006 18:19:00.979 EDT: GTP_SR: Old State Standby,Event Active Fast Received, New State ActiveMWAM 10/2: 000078: Jun 1 2006 18:19:00.979 EDT: GTP-SR:Context Type OWN, Handler Sync, Context Event OWN Ready, Context Sub Event No Sub EventMWAM 10/2: 000079: Jun 1 2006 18:19:00.979 EDT: GTP-SR:State of Redundancy Context is InitializedMWAM 10/2: 000080: Jun 1 2006 18:19:00.979 EDT: GTP-SR: Event OWN Ready, Sub Event No Sub EventMWAM 10/2: 000081: Jun 1 2006 18:19:00.979 EDT: GTP-SR: Removing element from state-list Initialized, final count 2MWAM 10/2: 000082: Jun 1 2006 18:19:00.979 EDT: GTP-SR: adding element in state-list Bulk Synch Ready, final count 2MWAM 10/2: 000083: Jun 1 2006 18:19:00.979 EDT: GTP-SR:Context Type CGF, Handler Sync, Context Event CGF Ready, Context Sub Event No Sub EventMWAM 10/2: 000084: Jun 1 2006 18:19:00.979 EDT: GTP-SR:State of Redundancy Context is InitializedMWAM 10/2: 000085: Jun 1 2006 18:19:00.979 EDT: GTP-SR: Event CGF Ready, Sub Event No Sub EventMWAM 10/2: 000086: Jun 1 2006 18:19:00.979 EDT: GTP-SR: Removing element from state-list Initialized, final count 1MWAM 10/2: 000087: Jun 1 2006 18:19:00.979 EDT: GTP-SR: adding element in state-list Bulk Synch Ready, final count 3MWAM 10/2: 000088: Jun 1 2006 18:19:00.979 EDT: GTP-SR: Invalid shdb 0x0MWAM 10/2: 000089: Jun 1 2006 18:19:00.979 EDT: GTP-SR: Transition CG 10.0.250.114 to (state 0)MWAM 10/2: 000090: Jun 1 2006 18:19:00.979 EDT: GTP-SR: Invalid shdb 0x0MWAM 10/2: 000091: Jun 1 2006 18:19:00.979 EDT: GTP-SR: Transition CG 10.0.250.115 to (state 0)MWAM 10/2: 000092: Jun 1 2006 18:19:00.983 EDT: GTP-SR: SHDB AVL tree cleanup to start in 10 secMWAM 10/2: 000093: Jun 1 2006 18:19:00.983 EDT: GTP-SR: Completion of Standby-to-Active transitionMWAM 10/2: 000094: Jun 1 2006 18:19:00.983 EDT: GTP-SR: Chkpt Status Flow Off IndicationMWAM 10/2: 000095: Jun 1 2006 18:19:00.987 EDT: %HSRP-6-STATECHANGE: GigabitEthernet0/0.301 Grp 51 state Standby -> ActiveMWAM 10/2: 000096: Jun 1 2006 18:19:00.987 EDT: GTP-SR: RF_Status=400-RF_STATUS_PEER_PRESENCE RFState=13-ACTIVE operand=0 RFPeerState=13-ACTIVEMWAM 10/2: 000097: Jun 1 2006 18:19:00.987 EDT: GTP-SR: zero elements to move to other listMWAM 10/2: 000098: Jun 1 2006 18:19:00.987 EDT: GTP-SR: zero elements to move to other listMWAM 10/2: 000099: Jun 1 2006 18:19:00.987 EDT: GTP-SR: RF_Status=401-RF_STATUS_PEER_COMM RFState=13-ACTIVE operand=0 RFPeerState=1-DISABLEDMWAM 10/2: 000100: Jun 1 2006 18:19:01.107 EDT: %HSRP-6-STATECHANGE: GigabitEthernet0/0.1151 Grp 51 state Standby -> ActiveMWAM 10/2: 000101: Jun 1 2006 18:19:01.155 EDT: %HSRP-6-STATECHANGE: GigabitEthernet0/0.250 Grp 51 state Standby -> ActiveMWAM 10/2: 000102: Jun 1 2006 18:19:01.295 EDT: %HSRP-6-STATECHANGE: GigabitEthernet0/0.1101 Grp 51 state Standby -> ActiveMWAM 10/2: 000103: Jun 1 2006 18:19:01.355 EDT: %HSRP-6-STATECHANGE: GigabitEthernet0/0.1251 Grp 51 state Standby -> ActiveMWAM 10/2: 000104: Jun 1 2006 18:19:01.451 EDT: %HSRP-6-STATECHANGE: GigabitEthernet0/0.1201 Grp 51 state Standby -> ActiveMWAM 10/2: 000105: Jun 1 2006 18:19:01.459 EDT: %HSRP-6-STATECHANGE: GigabitEthernet0/0.220 Grp 51 state Standby -> ActiveRouter-2#MWAM 10/2: 000106: Jun 1 2006 18:19:10.983 EDT: GTP-SR: SHDB AVL tree cleanup has 3 nodes removed, 0 leftoverMWAM 10/2: 000107: Jun 1 2006 18:20:25.947 EDT: GTP-SR: Chkpt Status Flow Off IndicationMWAM 10/2: 000108: Jun 1 2006 18:20:25.947 EDT: GTP-SR: RF_Status=400-RF_STATUS_PEER_PRESENCE RFState=13-ACTIVE operand=1 RFPeerState=1-DISABLEDMWAM 10/2: 000109: Jun 1 2006 18:20:25.947 EDT: GTP-SR: RF_Status=401-RF_STATUS_PEER_COMM RFState=13-ACTIVE operand=1 RFPeerState=1-DISABLEDMWAM 10/2: 000110: Jun 1 2006 18:20:25.947 EDT: GTP-SR: RF_Event=300-RF_PROG_PLATFORM_SYNC RFState=13-ACTIVE operand=0 RFPeerState=0-UNKNOWNMWAM 10/2: 000111: Jun 1 2006 18:20:25.947 EDT: GTP-SR: Received RF Progression Platform SyncMWAM 10/2: 000112: Jun 1 2006 18:20:53.899 EDT: GTP-SR: RF_Event=102-RF_PROG_STANDBY_CONFIG RFState=13-ACTIVE operand=0 RFPeerState=5-STANDBY COLD-CONFIGMWAM 10/2: 000113: Jun 1 2006 18:20:53.899 EDT: GTP-SR: Received RF Progression Standby ConfigMWAM 10/2: 000114: Jun 1 2006 18:20:53.899 EDT: GTP-SR: RF_Event=103-RF_PROG_STANDBY_FILESYS RFState=13-ACTIVE operand=0 RFPeerState=6-STANDBY COLD-FILESYSMWAM 10/2: 000115: Jun 1 2006 18:20:53.899 EDT: GTP-SR: Received RF Progression Stadnby FilesysMWAM 10/2: 000116: Jun 1 2006 18:20:53.899 EDT: GTP-SR: RF_Event=104-RF_PROG_STANDBY_BULK RFState=13-ACTIVE operand=0 RFPeerState=7-STANDBY COLD-BULKMWAM 10/2: 000117: Jun 1 2006 18:20:53.899 EDT: GTP-SR: Received RF Progression Standby BulkMWAM 10/2: 000118: Jun 1 2006 18:20:53.899 EDT: GTP-SR: Active GGSN sending Bulk Sync finished MsgMWAM 10/2: 000119: Jun 1 2006 18:20:53.899 EDT: GTP-SR: packing csg_path vaddr: 10.0.250.91MWAM 10/2: 000120: Jun 1 2006 18:20:53.899 EDT: GTP-SR: packing csg_path port: 4386MWAM 10/2: 000121: Jun 1 2006 18:20:53.899 EDT: GTP-SR: packing csg_path state: 1MWAM 10/2: 000122: Jun 1 2006 18:20:53.899 EDT: GTP-SR: Ckpt Message was sucessfully sentMWAM 10/2: 000123: Jun 1 2006 18:20:53.899 EDT: GTP-SR: Removing element from state-list Bulk Synch Ready, final count 2MWAM 10/2: 000124: Jun 1 2006 18:20:53.899 EDT: GTP-SR: adding element in state-list Synched, final count 1MWAM 10/2: 000125: Jun 1 2006 18:20:53.899 EDT: GTP-SR: sync next charging id 0x1C0AA436, local rsn 0x6B76EBDEMWAM 10/2: 000126: Jun 1 2006 18:20:53.899 EDT: GTP-SR: Packing Pair Boot time 21:29:21 EDT Aug 19 2000MWAM 10/2: 000127: Jun 1 2006 18:20:53.899 EDT: GTP-SR: Packing Switcover Count 3MWAM 10/2: 000128: Jun 1 2006 18:20:53.899 EDT: GTP-SR: Packing local restart_count 21MWAM 10/2: 000129: Jun 1 2006 18:20:53.899 EDT: GTP-SR: Ckpt Message was sucessfully sentMWAM 10/2: 000130: Jun 1 2006 18:20:53.899 EDT: GTP-SR: Removing element from state-list Bulk Synch Ready, final count 1MWAM 10/2: 000131: Jun 1 2006 18:20:53.899 EDT: GTP-SR: adding element in state-list Synched, final count 2MWAM 10/2: 000132: Jun 1 2006 18:20:53.899 EDT: GTP-SR: sync cgf gw 10.0.250.114, operatemode NOT ACTIVE, nextseq 0x7530MWAM 10/2: 000133: Jun 1 2006 18:20:53.899 EDT: GTP-SR: sync cgf gw 10.0.250.115, operatemode NOT ACTIVE, nextseq 0x7530MWAM 10/2: 000134: Jun 1 2006 18:20:53.899 EDT: GTP-SR: Ckpt Message was sucessfully sentMWAM 10/2: 000135: Jun 1 2006 18:20:53.899 EDT: GTP-SR: Removing element from state-list Bulk Synch Ready, final count 0MWAM 10/2: 000136: Jun 1 2006 18:20:53.899 EDT: GTP-SR: adding element in state-list Synched, final count 3MWAM 10/2: 000137: Jun 1 2006 18:20:53.899 EDT: GTP-SR:Active took time of 0 msec to transfer data for bulk syncMWAM 10/2: 000138: Jun 1 2006 18:20:53.899 EDT: GTP-SR: Empty list to syncMWAM 10/2: 000139: Jun 1 2006 18:20:53.899 EDT: GTP-SR: Redundancy RF Event Received is Standby Bulk Sync EndMWAM 10/2: 000140: Jun 1 2006 18:20:53.899 EDT: GTP-SR: Redundancy Event is InvalidMWAM 10/2: 000141: Jun 1 2006 18:20:53.899 EDT: GTP-SR: RF_Event=105-RF_PROG_STANDBY_HOT RFState=13-ACTIVE operand=0 RFPeerState=8-STANDBY HOTMWAM 10/2: 000142: Jun 1 2006 18:20:53.899 EDT: GTP-SR: Received RF Progression Standby HotRouterRouter# show gprs redundancyGPRS redundancy is enabled and Unit-Status is ActiveRedundancy Transport Infrastructure statusRedundancy Infrastructure state: ACTIVEPeer Redundancy Infrastructure state: STANDBY HOTGGSN Redundancy system up since: 21:29:21 EDT Aug 19 2000Time of last switchover:Total Number of Switchovers: 3GPRS Redundancy StatisticsLast cleared: neverCheckPointed-To-Standby StatisticsTotal Number of Messages: 3Number of Context Setup messages: 0Number of Context Modify messages: 0Number of Context Remove messages: 0Number of Path Setup messages: 0Number of Path Modify messages: 0Number of Path Remove messages: 0Number of CGF Ready messages: 1Number of CGF Modify messages: 0Number of CGF Remove messages: 0Number of Internal State messages: 1Example 2
The following sample outputs is for PDP context setup, prepaid user traffic, and then PDP context teardown. The debug is given for both Active and Standby GGSN. There is no GGSN switchover.
Active GGSN:
Router# debug gprs redundancyGPRS CF packets debugging is onGPRS CF events debugging is onGPRS CF errors debugging is onGPRS CF debug debugging is onRouter# show gprs redundancyGPRS redundancy is enabled and Unit-Status is ActiveRedundancy Transport Infrastructure statusRedundancy Infrastructure state: ACTIVEPeer Redundancy Infrastructure state: STANDBY HOTGGSN Redundancy system up since: 21:29:21 EDT Aug 19 2000Time of last switchover:Total Number of Switchovers: 4GPRS Redundancy StatisticsLast cleared: neverCheckPointed-To-Standby StatisticsTotal Number of Messages: 3Number of Context Setup messages: 0Number of Context Modify messages: 0Number of Context Remove messages: 0Number of Path Setup messages: 0Number of Path Modify messages: 0Number of Path Remove messages: 0Number of CGF Ready messages: 1Number of CGF Modify messages: 0Number of CGF Remove messages: 0Number of Internal State messages: 1Router#MWAM 10/2: 000073: Aug 24 2000 23:18:55.947 EDT: GTP-SR:pdpmcb handle for pdpmcb (0x24D2FC3C) is (0x3A000001)MWAM 10/2: 000074: Aug 24 2000 23:18:55.963 EDT: GTP-SR: Need to allocate redundancy contextMWAM 10/2: 000075: Aug 24 2000 23:18:55.963 EDT: GTP-SR: adding element in state-list Initialized, final count 2MWAM 10/2: 000076: Aug 24 2000 23:18:55.963 EDT: GTP-SR: Need to allocate redundancy contextMWAM 10/2: 000077: Aug 24 2000 23:18:55.963 EDT: GTP-SR: adding element in state-list Initialized, final count 3MWAM 10/2: 000078: Aug 24 2000 23:18:55.963 EDT: GTP-SR:Context Type Path, Handler Sync, Context Event Path Setup, Context Sub Event No Sub EventMWAM 10/2: 000079: Aug 24 2000 23:18:55.963 EDT: GTP-SR:State of Redundancy Context is InitializedMWAM 10/2: 000080: Aug 24 2000 23:18:55.963 EDT: GTP-SR: Event Path Setup, Sub Event No Sub EventMWAM 10/2: 000081: Aug 24 2000 23:18:55.963 EDT: GTP-SR: Removing element from state-list Initialized, final count 2MWAM 10/2: 000082: Aug 24 2000 23:18:55.963 EDT: GTP-SR: adding element in state-list Dynamic Sync Ready, final count 1MWAM 10/2: 000083: Aug 24 2000 23:18:55.963 EDT: GTP-SR: Need to allocate redundancy contextMWAM 10/2: 000084: Aug 24 2000 23:18:55.963 EDT: GTP-SR: adding element in state-list Initialized, final count 3MWAM 10/2: 000085: Aug 24 2000 23:18:55.963 EDT: GTP-SR:Context Type Path, Handler Sync, Context Event Path Setup, Context Sub Event No Sub EventMWAM 10/2: 000086: Aug 24 2000 23:18:55.963 EDT: GTP-SR:State of Redundancy Context is InitializedMWAM 10/2: 000087: Aug 24 2000 23:18:55.963 EDT: GTP-SR: Event Path Setup, Sub Event No Sub EventMWAM 10/2: 000088: Aug 24 2000 23:18:55.963 EDT: GTP-SR: Removing element from state-list Initialized, final count 2MWAM 10/2: 000089: Aug 24 2000 23:18:55.963 EDT: GTP-SR: adding element in state-list Dynamic Sync Ready, final count 2MWAM 10/2: 000090: Aug 24 2000 23:18:55.963 EDT: GTP-SR:packing pathcb->gtpv 1MWAM 10/2: 000091: Aug 24 2000 23:18:55.963 EDT: GTP-SR:Local IP address 166.11.0.11, and port 2123MWAM 10/2: 000092: Aug 24 2000 23:18:55.963 EDT: GTP-SR:Remote IP address 10.10.50.3, and port 2123MWAM 10/2: 000093: Aug 24 2000 23:18:55.963 EDT: GTP-SR:packing pathcb->num_data_socks 0MWAM 10/2: 000094: Aug 24 2000 23:18:55.963 EDT: GTP-SR:packing pathcb->flags 9MWAM 10/2: 000095: Aug 24 2000 23:18:55.963 EDT: GTP-SR:packing pathcb->restart_count_remote 1MWAM 10/2: 000096: Aug 24 2000 23:18:55.963 EDT: GTP-SR: Different lengths during path create: allowed: 63, packed: 23MWAM 10/2: 000097: Aug 24 2000 23:18:55.963 EDT: GTP-SR: Ckpt Message was sucessfully sentMWAM 10/2: 000098: Aug 24 2000 23:18:55.963 EDT: GTP-SR: Removing element from state-list Dynamic Sync Ready, final count 1MWAM 10/2: 000099: Aug 24 2000 23:18:55.963 EDT: GTP-SR: adding element in state-list Synched, final count 4MWAM 10/2: 000100: Aug 24 2000 23:18:55.963 EDT: GTP-SR:packing pathcb->gtpv 1MWAM 10/2: 000101: Aug 24 2000 23:18:55.963 EDT: GTP-SR:Local IP address 166.11.0.11, and port 2152MWAM 10/2: 000102: Aug 24 2000 23:18:55.963 EDT: GTP-SR:Remote IP address 10.10.50.3, and port 2152MWAM 10/2: 000103: Aug 24 2000 23:18:55.967 EDT: GTP-SR:packing pathcb->num_data_socks 0MWAM 10/2: 000104: Aug 24 2000 23:18:55.967 EDT: GTP-SR:packing pathcb->flags 8MWAM 10/2: 000105: Aug 24 2000 23:18:55.967 EDT: GTP-SR:packing pathcb->restart_count_remote 0MWAM 10/2: 000106: Aug 24 2000 23:18:55.967 EDT: GTP-SR: Different lengths during path create: allowed: 63, packed: 23MWAM 10/2: 000107: Aug 24 2000 23:18:55.967 EDT: GTP-SR: Ckpt Message was sucessfully sentMWAM 10/2: 000108: Aug 24 2000 23:18:55.967 EDT: GTP-SR: Removing element from state-list Dynamic Sync Ready, final count 0MWAM 10/2: 000109: Aug 24 2000 23:18:55.967 EDT: GTP-SR: adding element in state-list Synched, final count 5MWAM 10/2: 000110: Aug 24 2000 23:18:55.967 EDT: GTP-SR: Empty list to syncMWAM 10/2: 000111: Aug 24 2000 23:18:55.967 EDT: GTP-SR: Empty list to syncMWAM 10/2: 000112: Aug 24 2000 23:19:01.583 EDT: GTP-SR: Creating red context for category ID 4 username 100000000000000 on APN ms-apnMWAM 10/2: 000113: Aug 24 2000 23:19:01.583 EDT: GTP-SR: Need to allocate redundancy contextMWAM 10/2: 000114: Aug 24 2000 23:19:01.583 EDT: GTP-SR: adding element in state-list Initialized, final count 3MWAM 10/2: 000115: Aug 24 2000 23:19:01.583 EDT: GTP-SR: Removing element from state-list Initialized, final count 2MWAM 10/2: 000116: Aug 24 2000 23:19:01.583 EDT: GTP-SR: adding element in state-list Synched, final count 6MWAM 10/2: 000117: Aug 24 2000 23:19:01.583 EDT: GPRS:0100000000000050:shdb 0x95000008 created for category 4 (handle 0xD0000001)MWAM 10/2: 000118: Aug 24 2000 23:19:01.591 EDT: GTP-SR: Don't checkpoint QP4QR Clear for Create/Update after a Quota Push RespMWAM 10/2: 000119: Aug 24 2000 23:19:01.591 EDT: GTP-SR:Context Type PDP, Handler Sync, Context Event Context Setup, Context Sub Event No Sub EventMWAM 10/2: 000120: Aug 24 2000 23:19:01.591 EDT: GTP-SR:State of Redundancy Context is InitializedMWAM 10/2: 000121: Aug 24 2000 23:19:01.591 EDT: GTP-SR: Event Context Setup, Sub Event No Sub EventMWAM 10/2: 000122: Aug 24 2000 23:19:01.591 EDT: GTP-SR: Removing element from state-list Initialized, final count 1MWAM 10/2: 000123: Aug 24 2000 23:19:01.591 EDT: GTP-SR: adding element in state-list Dynamic Sync Ready, final count 1MWAM 10/2: 000124: Aug 24 2000 23:19:01.591 EDT: GTP-SR: for pdpmcb: 221 bytes to be packedMWAM 10/2: 000125: Aug 24 2000 23:19:01.591 EDT: GTP-SR: pdpmcb bitmap = 14346MWAM 10/2: 000126: Aug 24 2000 23:19:01.591 EDT: GTP-SR:packing pdpmcb->user-name 91100000000000000MWAM 10/2: 000127: Aug 24 2000 23:19:01.591 EDT: GTP-SR:packing pdpmcb->msisdn 9101000000000000F000MWAM 10/2: 000128: Aug 24 2000 23:19:01.591 EDT: GTP-SR:packing pdpmcb->selection_mode 0MWAM 10/2: 000129: Aug 24 2000 23:19:01.591 EDT: GTP-SR:packing pdpmcb->remove_staticIP 0MWAM 10/2: 000130: Aug 24 2000 23:19:01.591 EDT: GTP-SR:packing pdpmcb->llcframenum 0MWAM 10/2: 000131: Aug 24 2000 23:19:01.591 EDT: GTP-SR:packing pdpmcb->idle_timeout 3600MWAM 10/2: 000132: Aug 24 2000 23:19:01.591 EDT: GTP-SR:packing pdpmcb->session_timeout 0MWAM 10/2: 000133: Aug 24 2000 23:19:01.591 EDT: GTP-SR:packing pdpmcb->pdpmcb_handle 973078529MWAM 10/2: 000134: Aug 24 2000 23:19:01.591 EDT: GTP-SR:packing pdpmcb->shdb 2080374789MWAM 10/2: 000135: Aug 24 2000 23:19:01.591 EDT: GTP-SR:packing apn_name ms-apnMWAM 10/2: 000136: Aug 24 2000 23:19:01.591 EDT: GTP-SR:packing apnvalue ms-apnMWAM 10/2: 000137: Aug 24 2000 23:19:01.591 EDT: GTP-SR:packing pdpmcb->teid 4194305MWAM 10/2: 000138: Aug 24 2000 23:19:01.591 EDT: GTP-SR:packing pdpmcb->imsi 01000000000000F0MWAM 10/2: 000139: Aug 24 2000 23:19:01.591 EDT: GTP-SR:packing pdpmcb->pdpaddr.static_addr_allocated 0MWAM 10/2: 000140: Aug 24 2000 23:19:01.591 EDT: GTP-SR:packing pdpmcb->pdpaddr.dynamic_addr_allocated 1MWAM 10/2: 000141: Aug 24 2000 23:19:01.591 EDT: GTP-SR:packing pdpmcb->pdpaddr.dynamic_addr_requested 1MWAM 10/2: 000142: Aug 24 2000 23:19:01.591 EDT: GTP-SR:packing pdpmcb->pdpaddr.addr_source 3MWAM 10/2: 000143: Aug 24 2000 23:19:01.591 EDT: GTP-SR:packing pdpmcb->pdpaddr.allocated_prefix_len 16MWAM 10/2: 000144: Aug 24 2000 23:19:01.591 EDT: GTP-SR:packing pdpmcb->pdpaddr.aggregate_prefix_len 16MWAM 10/2: 000145: Aug 24 2000 23:19:01.591 EDT: GTP-SR:packing pdpmcb->pdpaddr.pdp_type_org 1MWAM 10/2: 000146: Aug 24 2000 23:19:01.591 EDT: GTP-SR:packing pdpmcb->pdpaddr.pdp_type_num 33MWAM 10/2: 000147: Aug 24 2000 23:19:01.591 EDT: GTP-SR:packing pdpmcb->pdpaddr.addrlen 6MWAM 10/2: 000148: Aug 24 2000 23:19:01.591 EDT: GTP-SR:packing pdpmcb-ggsn_addr_si 166.11.0.11MWAM 10/2: 000149: Aug 24 2000 23:19:01.591 EDT: GTP-SR:packing pdpmcb-ggsn_addr_data 166.11.0.11MWAM 10/2: 000150: Aug 24 2000 23:19:01.591 EDT: GTP-SR:packing pdpmcb->msisdn_len 9nGTP-SR:packing aaa charging profile index -1,MWAM 10/2: 000151: Aug 24 2000 23:19:01.591 EDT: GTP-SR:pdpmcb encoded len_t 0MWAM 10/2: 000152: Aug 24 2000 23:19:01.591 EDT: GTP-SR: pdpcb bitmap = 0MWAM 10/2: 000153: Aug 24 2000 23:19:01.591 EDT: GTP-SR:packing pdpcb->teid_cntl_remote 1MWAM 10/2: 000154: Aug 24 2000 23:19:01.591 EDT: GTP-SR:packing pdpcb->teid_data_local 4194306MWAM 10/2: 000155: Aug 24 2000 23:19:01.591 EDT: GTP-SR:packing pdpcb->teid_data_remote 1000MWAM 10/2: 000156: Aug 24 2000 23:19:01.591 EDT: GTP-SR:packing pdpcb->tid 0100000000000050MWAM 10/2: 000157: Aug 24 2000 23:19:01.591 EDT: GTP-SR:packing naspi = 5MWAM 10/2: 000158: Aug 24 2000 23:19:01.591 EDT: GTP-SR:packing pdpcb->internal_flags 9175041MWAM 10/2: 000159: Aug 24 2000 23:19:01.591 EDT: GTP-SR:packing pdpcb->mnrgflag 0MWAM 10/2: 000160: Aug 24 2000 23:19:01.591 EDT: GTP-SR:packing pdpcb->open_cdr_sent 0MWAM 10/2: 000161: Aug 24 2000 23:19:01.591 EDT: GTP-SR:packing pdpcb->charging_reserved 0MWAM 10/2: 000162: Aug 24 2000 23:19:01.591 EDT: GTP-SR:packing pdpcb->pri 1MWAM 10/2: 000163: Aug 24 2000 23:19:01.591 EDT: GTP-SR:packing pdpcb->fastswitchable 0MWAM 10/2: 000164: Aug 24 2000 23:19:01.591 EDT: GTP-SR:packing pdpcb-sgsn_addr_sig 10.10.50.3MWAM 10/2: 000165: Aug 24 2000 23:19:01.591 EDT: GTP-SR:packing pdpcb-sgsn_addr_data 10.10.50.3MWAM 10/2: 000166: Aug 24 2000 23:19:01.591 EDT: GTP-SR:packing pdpcb->sequence_sig 1MWAM 10/2: 000167: Aug 24 2000 23:19:01.591 EDT: GTP-SR:packing pdpcb->fl_sig_up 0MWAM 10/2: 000168: Aug 24 2000 23:19:01.591 EDT: GTP-SR:packing pdpcb->fl_data1_up 0MWAM 10/2: 000169: Aug 24 2000 23:19:01.591 EDT: GTP-SR:packing pdpcb->fl_sig_down 0MWAM 10/2: 000170: Aug 24 2000 23:19:01.591 EDT: GTP-SR:packing pdpcb->fl_data1_down 0MWAM 10/2: 000171: Aug 24 2000 23:19:01.591 EDT: GTP-SR:packing pdpcb->fl_data2 0MWAM 10/2: 000172: Aug 24 2000 23:19:01.591 EDT: GTP-SR:packing pdpcb->cause 128MWAM 10/2: 000173: Aug 24 2000 23:19:01.591 EDT: GTP-SR:packing pdpcb->restart_count 0MWAM 10/2: 000174: Aug 24 2000 23:19:01.591 EDT: GTP-SR: packing pdpcb->create_time Aug 24 2000 23:18:56MWAM 10/2: 000175: Aug 24 2000 23:19:01.591 EDT: GTP-SR: packing pdpcb->last_access_time Aug 24 2000 23:18:56MWAM 10/2: 000176: Aug 24 2000 23:19:01.591 EDT: GTP-SR:packing pdpcb->gtpv1_qos_req.qos_profile 152109353lMWAM 10/2: 000177: Aug 24 2000 23:19:01.591 EDT: GTP-SR:packing pdpcb->gtpv1_qos_neg.qos_profile 152109353lMWAM 10/2: 000178: Aug 24 2000 23:19:01.591 EDT: GTP-SR:packing pdpcb->teid_cntl_remote 1MWAM 10/2: 000179: Aug 24 2000 23:19:01.591 EDT: GTP-SR:packing pdpcb->teid_data_local 4194306MWAM 10/2: 000180: Aug 24 2000 23:19:01.591 EDT: GTP-SR:packing pdpcb->teid_data_remote 1000MWAM 10/2: 000181: Aug 24 2000 23:19:01.591 EDT: GTP-SR:packing pdpcb->charging_id 471179447MWAM 10/2: 000182: Aug 24 2000 23:19:01.591 EDT: GTP-SR:packing pdpcb->cdr_recseqnum 0MWAM 10/2: 000183: Aug 24 2000 23:19:01.591 EDT: GTP-SR: packing of pdpcb->reorder_required FFMWAM 10/2: 000184: Aug 24 2000 23:19:01.591 EDT: GPRS:0100000000000050:GTP-SR: Successfully pack PDPMWAM 10/2: 000185: Aug 24 2000 23:19:01.591 EDT: GTP-SR: rulebase ID MS packedMWAM 10/2: 000186: Aug 24 2000 23:19:01.591 EDT: GTP-SR: cc_session ccfh 0 failover_supported 1 reqnum 1 packedMWAM 10/2: 000187: Aug 24 2000 23:19:01.591 EDT: GTP-SR: cc_session dest_host ips-clcis1.cisco.com dest_realm cisco.com packedMWAM 10/2: 000188: Aug 24 2000 23:19:01.591 EDT: GTP-SR: category ID 4 packed:MWAM 10/2: 000189: Aug 24 2000 23:19:01.591 EDT: GTP-SR: sync data len 164MWAM 10/2: 000190: Aug 24 2000 23:19:01.591 EDT: GTP-SR: active shdb 0x95000008MWAM 10/2: 000191: Aug 24 2000 23:19:01.591 EDT: GTP-SR: CSG session ID 27599459844129MWAM 10/2: 000192: Aug 24 2000 23:19:01.591 EDT: GTP-SR: chrg last svc rec seqnum 0MWAM 10/2: 000193: Aug 24 2000 23:19:01.591 EDT: GTP-SR: category state AUTHORIZEDMWAM 10/2: 000194: Aug 24 2000 23:19:01.591 EDT: GTP-SR: category state trigger flags 0x3MWAM 10/2: 000195: Aug 24 2000 23:19:01.591 EDT: GTP-SR: category sub flags 0x0MWAM 10/2: 000196: Aug 24 2000 23:19:01.591 EDT: GTP-SR: sync flag 0x0MWAM 10/2: 000197: Aug 24 2000 23:19:01.591 EDT: GTP-SR: quotas includedMWAM 10/2: 000198: Aug 24 2000 23:19:01.591 EDT: GTP-SR: last req timestamp 0MWAM 10/2: 000199: Aug 24 2000 23:19:01.591 EDT: GTP-SR: last req seqnum 0MWAM 10/2: 000200: Aug 24 2000 23:19:01.595 EDT: GTP-SR: Ckpt Message was sucessfully sentMWAM 10/2: 000201: Aug 24 2000 23:19:01.595 EDT: GTP-SR: Removing element from state-list Dynamic Sync Ready, final count 0MWAM 10/2: 000202: Aug 24 2000 23:19:01.595 EDT: GTP-SR: adding element in state-list Synched, final count 7MWAM 10/2: 000203: Aug 24 2000 23:19:01.595 EDT: GTP-SR: Empty list to syncMWAM 10/2: 000204: Aug 24 2000 23:19:03.939 EDT: GTP-SR:Context Type PDP, Handler Sync, Context Event Context Setup, Context Sub Event No Sub EventMWAM 10/2: 000205: Aug 24 2000 23:19:03.939 EDT: GTP-SR:State of Redundancy Context is SynchedMWAM 10/2: 000206: Aug 24 2000 23:19:03.939 EDT: GTP-SR: Event Context Setup, Sub Event No Sub EventMWAM 10/2: 000207: Aug 24 2000 23:19:04.463 EDT: GTP-SR: Checkpoint SGSN init deletion via a category before final MCB deletionMWAM 10/2: 000208: Aug 24 2000 23:19:04.463 EDT: GTP-SR:Context Type Category, Handler Update, Context Event Category update, Context Sub Event No Sub EventMWAM 10/2: 000209: Aug 24 2000 23:19:04.463 EDT: GTP-SR:State of Redundancy Context is SynchedMWAM 10/2: 000210: Aug 24 2000 23:19:04.463 EDT: GTP-SR: Event Category update, Sub Event No Sub EventMWAM 10/2: 000211: Aug 24 2000 23:19:04.463 EDT: GTP-SR: MCB internal flags 0x5802 packedMWAM 10/2: 000212: Aug 24 2000 23:19:04.463 EDT: GTP-SR: cc_session reqnum 1 packedMWAM 10/2: 000213: Aug 24 2000 23:19:04.463 EDT: GTP-SR: category ID 4 packed:MWAM 10/2: 000214: Aug 24 2000 23:19:04.463 EDT: GTP-SR: sync data len 52MWAM 10/2: 000215: Aug 24 2000 23:19:04.463 EDT: GTP-SR: active shdb 0x95000008MWAM 10/2: 000216: Aug 24 2000 23:19:04.463 EDT: GTP-SR: CSG session ID 27599459844129MWAM 10/2: 000217: Aug 24 2000 23:19:04.463 EDT: GTP-SR: chrg last svc rec seqnum 0MWAM 10/2: 000218: Aug 24 2000 23:19:04.463 EDT: GTP-SR: category state PENDING_SERVICE_STOPMWAM 10/2: 000219: Aug 24 2000 23:19:04.463 EDT: GTP-SR: category state trigger flags 0x3MWAM 10/2: 000220: Aug 24 2000 23:19:04.463 EDT: GTP-SR: category sub flags 0x0MWAM 10/2: 000221: Aug 24 2000 23:19:04.463 EDT: GTP-SR: sync flag 0xAMWAM 10/2: 000222: Aug 24 2000 23:19:04.463 EDT: GTP-SR: quotas not includedMWAM 10/2: 000223: Aug 24 2000 23:19:04.463 EDT: GTP-SR: last req timestamp 0MWAM 10/2: 000224: Aug 24 2000 23:19:04.463 EDT: GTP-SR: last req seqnum 0MWAM 10/2: 000225: Aug 24 2000 23:19:04.463 EDT: GTP-SR: Different lengths during category sync: allowed 188, packed 56MWAM 10/2: 000226: Aug 24 2000 23:19:04.463 EDT: GTP-SR: Ckpt Message was sucessfully sentMWAM 10/2: 000227: Aug 24 2000 23:19:04.467 EDT: GTP-SR: Checkpoint final MCB deletion after sending a CCR FinalMWAM 10/2: 000228: Aug 24 2000 23:19:04.467 EDT: GTP-SR:Context Type PDP, Handler Delete, Context Event Context Remove, Context Sub Event No Sub EventMWAM 10/2: 000229: Aug 24 2000 23:19:04.467 EDT: GTP-SR:State of Redundancy Context is SynchedMWAM 10/2: 000230: Aug 24 2000 23:19:04.467 EDT: GTP-SR: Event Context Remove, Sub Event No Sub EventMWAM 10/2: 000231: Aug 24 2000 23:19:04.467 EDT: GTP-SR: Checkpoint final MCB deletionMWAM 10/2: 000232: Aug 24 2000 23:19:04.467 EDT: GTP-SR:Context Type PDP, Handler Delete, Context Event Context Remove, Context Sub Event No Sub EventMWAM 10/2: 000233: Aug 24 2000 23:19:04.467 EDT: GTP-SR:State of Redundancy Context is SynchedMWAM 10/2: 000234: Aug 24 2000 23:19:04.467 EDT: GTP-SR: Event Context Remove, Sub Event No Sub EventMWAM 10/2: 000235: Aug 24 2000 23:19:04.467 EDT: GTP-SR: Different lengths during PDP delete: allowed: 40, packed: 0MWAM 10/2: 000236: Aug 24 2000 23:19:04.467 EDT: GTP-SR: Ckpt Message was sucessfully sentMWAM 10/2: 000237: Aug 24 2000 23:19:04.467 EDT: GTP-SR: Removing element from state-list Synched, final count 6MWAM 10/2: 000238: Aug 24 2000 23:19:04.467 EDT: GTP-SR: adding element in state-list Delete, final count 1MWAM 10/2: 000239: Aug 24 2000 23:19:04.467 EDT: GTP-SR: Removing element from state-list Delete, final count 0MWAM 10/2: 000240: Aug 24 2000 23:19:04.467 EDT: GTP-SR: No redundancy context for sending a down event to standbyMWAM 10/2: 000241: Aug 24 2000 23:19:04.471 EDT: GTP-SR: Removing element from state-list Synched, final count 5Standby GGSN:
Router# debug gprs redundancyGPRS CF packets debugging is onGPRS CF events debugging is onGPRS CF errors debugging is onGPRS CF debug debugging is onRouter# show gprs redundancyGPRS redundancy is enabled and Unit-Status is StandbyRedundancy Transport Infrastructure statusRedundancy Infrastructure state: STANDBY HOTPeer Redundancy Infrastructure state: ACTIVEGGSN Redundancy system up since: 21:29:21 EDT Aug 19 2000Time of last switchover: neverTotal Number of Switchovers: 4GPRS Redundancy StatisticsLast cleared: neverCheckPointed-From-Active StatisticsTotal Number of Messages: 3Number of Context Setup messages: 0Number of Context Modify messages: 0Number of Context Remove messages: 0Number of Path Setup messages: 0Number of Path Modify messages: 0Number of Path Remove messages: 0Number of CGF Ready messages: 1Number of CGF Modify messages: 0Number of CGF Remove messages: 0Number of Internal State messages: 1Routerf#MWAM 10/2: 000065: Jun 1 2006 18:28:06.591 EDT: GTP-SR: Redundancy RF Event Received is Create Redundancy ContextMWAM 10/2: 000066: Jun 1 2006 18:28:06.591 EDT: GTP-SR: Redundancy Event is Path SetupMWAM 10/2: 000067: Jun 1 2006 18:28:06.591 EDT: GTP-SR: Need to allocate redundancy contextMWAM 10/2: 000068: Jun 1 2006 18:28:06.591 EDT: GTP-SR: adding element in state-list Initialized, final count 4MWAM 10/2: 000069: Jun 1 2006 18:28:06.591 EDT: GTP-SR Packet Dump: Len for dump: org_len=63, len=63MWAM 10/2: 000070: Jun 1 2006 18:28:06.591 EDT: 1 0 0 0 0 0 0 0 9 1 A6 B 0 B 8 4BMWAM 10/2: 000071: Jun 1 2006 18:28:06.591 EDT: A A 32 3 8 4B 1 0 0 0 0 0 0 0 0 0MWAM 10/2: 000072: Jun 1 2006 18:28:06.591 EDT: 0 0 0 0 0 0 0 0 0 0 0 0 0 0 0 0MWAM 10/2: 000073: Jun 1 2006 18:28:06.595 EDT: 0 0 0 0 0 0 0 0 0 0 0 0 0 0 0MWAM 10/2: 000074: Jun 1 2006 18:28:06.595 EDT: GTP-SR: un-packing u_path->gtpv 1MWAM 10/2: 000075: Jun 1 2006 18:28:06.595 EDT: GTP-SR: Local IP address 166.11.0.11, and port 2123MWAM 10/2: 000076: Jun 1 2006 18:28:06.595 EDT: GTP-SR: Remote IP address 10.10.50.3, and port 2123MWAM 10/2: 000077: Jun 1 2006 18:28:06.595 EDT: GTP-SR: un-packing u_path->num_data_socks 0MWAM 10/2: 000078: Jun 1 2006 18:28:06.595 EDT: GTP-SR: un-packing u_path->flags 9MWAM 10/2: 000079: Jun 1 2006 18:28:06.595 EDT: GTP-SR: un-packing restart_count_remote 1MWAM 10/2: 000080: Jun 1 2006 18:28:06.595 EDT: GTP-SR:Context Type Path, Handler Sync, Context Event Path Setup, Context Sub Event No Sub EventMWAM 10/2: 000081: Jun 1 2006 18:28:06.595 EDT: GTP-SR:State of Redundancy Context is InitializedMWAM 10/2: 000082: Jun 1 2006 18:28:06.595 EDT: GTP-SR: Event Path Setup, Sub Event No Sub EventMWAM 10/2: 000083: Jun 1 2006 18:28:06.595 EDT: GTP-SR: Removing element from state-list Initialized, final count 3MWAM 10/2: 000084: Jun 1 2006 18:28:06.595 EDT: GTP-SR: adding element in state-list Bulk Synch Ready, final count 2MWAM 10/2: 000085: Jun 1 2006 18:28:06.595 EDT: GTP-SR: Redundancy RF Event Received is Create Redundancy ContextMWAM 10/2: 000086: Jun 1 2006 18:28:06.595 EDT: GTP-SR: Redundancy Event is Path SetupMWAM 10/2: 000087: Jun 1 2006 18:28:06.595 EDT: GTP-SR: Need to allocate redundancy contextMWAM 10/2: 000088: Jun 1 2006 18:28:06.595 EDT: GTP-SR: adding element in state-list Initialized, final count 4MWAM 10/2: 000089: Jun 1 2006 18:28:06.595 EDT: GTP-SR Packet Dump: Len for dump: org_len=63, len=63MWAM 10/2: 000090: Jun 1 2006 18:28:06.595 EDT: 1 0 0 0 0 0 0 0 8 1 A6 B 0 B 8 68MWAM 10/2: 000091: Jun 1 2006 18:28:06.595 EDT: A A 32 3 8 68 0 0 0 0 0 0 0 0 0 0MWAM 10/2: 000092: Jun 1 2006 18:28:06.595 EDT: 0 0 0 0 0 0 0 0 0 0 0 0 0 0 0 0MWAM 10/2: 000093: Jun 1 2006 18:28:06.595 EDT: 0 0 0 0 0 0 0 0 0 0 0 0 0 0 0MWAM 10/2: 000094: Jun 1 2006 18:28:06.595 EDT: GTP-SR: un-packing u_path->gtpv 1MWAM 10/2: 000095: Jun 1 2006 18:28:06.595 EDT: GTP-SR: Local IP address 166.11.0.11, and port 2152MWAM 10/2: 000096: Jun 1 2006 18:28:06.595 EDT: GTP-SR: Remote IP address 10.10.50.3, and port 2152MWAM 10/2: 000097: Jun 1 2006 18:28:06.595 EDT: GTP-SR: un-packing u_path->num_data_socks 0MWAM 10/2: 000098: Jun 1 2006 18:28:06.595 EDT: GTP-SR: un-packing u_path->flags 8MWAM 10/2: 000099: Jun 1 2006 18:28:06.595 EDT: GTP-SR: un-packing restart_count_remote 0MWAM 10/2: 000100: Jun 1 2006 18:28:06.595 EDT: GTP-SR:Context Type Path, Handler Sync, Context Event Path Setup, Context Sub Event No Sub EventMWAM 10/2: 000101: Jun 1 2006 18:28:06.595 EDT: GTP-SR:State of Redundancy Context is InitializedMWAM 10/2: 000102: Jun 1 2006 18:28:06.595 EDT: GTP-SR: Event Path Setup, Sub Event No Sub EventMWAM 10/2: 000103: Jun 1 2006 18:28:06.595 EDT: GTP-SR: Removing element from state-list Initialized, final count 3MWAM 10/2: 000104: Jun 1 2006 18:28:06.595 EDT: GTP-SR: adding element in state-list Bulk Synch Ready, final count 3MWAM 10/2: 000105: Jun 1 2006 18:28:12.223 EDT: GTP-SR: Redundancy RF Event Received is Create Redundancy ContextMWAM 10/2: 000106: Jun 1 2006 18:28:12.223 EDT: GTP-SR: Redundancy Event is Context SetupMWAM 10/2: 000107: Jun 1 2006 18:28:12.223 EDT: GTP-SR: Need to allocate redundancy contextMWAM 10/2: 000108: Jun 1 2006 18:28:12.223 EDT: GTP-SR: adding element in state-list Initialized, final count 4MWAM 10/2: 000109: Jun 1 2006 18:28:12.223 EDT: GTP-SR Packet Dump: Len for dump: org_len=755, len=128MWAM 10/2: 000110: Jun 1 2006 18:28:12.223 EDT: 1 1 39 31 31 30 30 30 30 30 30 30 30 30 30 30MWAM 10/2: 000111: Jun 1 2006 18:28:12.223 EDT: 30 30 30 0 0 0 0 91 1 0 0 0 0 0 0 F0MWAM 10/2: 000112: Jun 1 2006 18:28:12.223 EDT: 0 0 0 0 0 0 E 10 0 0 0 0 0 0 0 0MWAM 10/2: 000113: Jun 1 2006 18:28:12.223 EDT: C0 23 1 8 5 63 69 73 63 6F 31 31 31 63 69 73MWAM 10/2: 000114: Jun 1 2006 18:28:12.227 EDT: 63 6F 0 7C 0 0 5 0 0 8 0 0 0 0 0 0MWAM 10/2: 000115: Jun 1 2006 18:28:12.227 EDT: 0 0 0 40 0 1 1 0 0 0 0 0 0 F0 B 1MWAM 10/2: 000116: Jun 1 2006 18:28:12.227 EDT: 0 1 0 0 0 0 0 0 0 0 0 0 0 0 0 0MWAM 10/2: 000117: Jun 1 2006 18:28:12.227 EDT: 0 0 0 1 1 0 0 0 3 10 10 1 21 0 6 0MWAM 10/2: 000118: Jun 1 2006 18:28:12.227 EDT: ...MWAM 10/2: 000119: Jun 1 2006 18:28:12.231 EDT: GTP-SR:pdpmcb handle for pdpmcb (0x24AA0CCC) is (0x41000001)MWAM 10/2: 000120: Jun 1 2006 18:28:12.231 EDT: GTP-SR: un-packing # of PDPs packed = 1MWAM 10/2: 000121: Jun 1 2006 18:28:12.231 EDT: GTP-SR: un-packing pdpmcb->user-name 91100000000000000MWAM 10/2: 000122: Jun 1 2006 18:28:12.231 EDT: GTP-SR: un-packing pdpmcb->msisdn 9101000000000000F000MWAM 10/2: 000123: Jun 1 2006 18:28:12.235 EDT: GTP-SR: un-packing pdpmcb->selection_mode 0MWAM 10/2: 000124: Jun 1 2006 18:28:12.235 EDT: GTP-SR: un-packing pdpmcb->remove_staticIP 0MWAM 10/2: 000125: Jun 1 2006 18:28:12.235 EDT: GTP-SR: un-packing pdpmcb->llcframenum 0MWAM 10/2: 000126: Jun 1 2006 18:28:12.235 EDT: GTP-SR: un-packing pdpmcb->idle_timeout 3600MWAM 10/2: 000127: Jun 1 2006 18:28:12.235 EDT: GTP-SR: un-packing pdpmcb->session_timeout 0MWAM 10/2: 000128: Jun 1 2006 18:28:12.235 EDT: GTP-SR: pdpmcb bitmap = 30730MWAM 10/2: 000129: Jun 1 2006 18:28:12.235 EDT: GTP-SR: apn name is ms-apnMWAM 10/2: 000130: Jun 1 2006 18:28:12.235 EDT: GTP-SR: packing pdpmcb->teid 4194305MWAM 10/2: 000131: Jun 1 2006 18:28:12.235 EDT: GTP-SR: un-packing pdpmcb->imsi 01000000000000F0MWAM 10/2: 000132: Jun 1 2006 18:28:12.235 EDT: GTP-SR: un-packing pdpmcb->pdpaddr.pdp_addr 11.1.0.1MWAM 10/2: 000133: Jun 1 2006 18:28:12.235 EDT: GTP-SR: un-packing pdpmcb->pdpaddr.static_addr_allocated 0MWAM 10/2: 000134: Jun 1 2006 18:28:12.235 EDT: GTP-SR: un-packing pdpmcb->pdpaddr.dynamic_addr_allocated 1MWAM 10/2: 000135: Jun 1 2006 18:28:12.235 EDT: GTP-SR: un-packing pdpmcb->pdpaddr.dynamic_addr_requested 1MWAM 10/2: 000136: Jun 1 2006 18:28:12.235 EDT: GTP-SR: un-packing pdpmcb->pdpaddr.addr_source 3MWAM 10/2: 000137: Jun 1 2006 18:28:12.235 EDT: GTP-SR: un-packing pdpmcb->pdpaddr.allocated_prefix_len 16MWAM 10/2: 000138: Jun 1 2006 18:28:12.235 EDT: GTP-SR: un-packing pdpmcb->pdpaddr.aggregate_prefix_len 16MWAM 10/2: 000139: Jun 1 2006 18:28:12.235 EDT: GTP-SR: un-packing pdpmcb->pdpaddr.pdp_type_org 1MWAM 10/2: 000140: Jun 1 2006 18:28:12.235 EDT: GTP-SR: un-packing pdpmcb->pdpaddr.pdp_type_num 33MWAM 10/2: 000141: Jun 1 2006 18:28:12.235 EDT: GTP-SR: un-packing pdpmcb->pdpaddr.addrlen 6MWAM 10/2: 000142: Jun 1 2006 18:28:12.235 EDT: GTP-SR: un-packing pdpmcb->pdpaddr.dhcp_addr 0.0.0.0MWAM 10/2: 000143: Jun 1 2006 18:28:12.235 EDT: GTP-SR: un-packing pdpmcb-ggsn_addr_si 166.11.0.11MWAM 10/2: 000144: Jun 1 2006 18:28:12.235 EDT: GTP-SR: un-packing pdpmcb-ggsn_addr_data 166.11.0.11MWAM 10/2: 000145: Jun 1 2006 18:28:12.235 EDT: GTP-SR: un-packing pdpmcb->msisdn_len 9MWAM 10/2: 000146: Jun 1 2006 18:28:12.247 EDT: GTP-SR: Got teid=4194305, as requestedMWAM 10/2: 000147: Jun 1 2006 18:28:12.247 EDT: GTP-SR: un-packing pdpcb->gtpv1_qos_req.qos_profile 152109353lMWAM 10/2: 000148: Jun 1 2006 18:28:12.247 EDT: GTP-SR: un-packing pdpcb->gtpv1_qos_neg.qos_profile 152109353lMWAM 10/2: 000149: Jun 1 2006 18:28:12.247 EDT: GTP-SR: un-packing pdpcb bitmap = 0MWAM 10/2: 000150: Jun 1 2006 18:28:12.247 EDT: GTP-SR: un-packing pdpcb->tid0100000000000050MWAM 10/2: 000151: Jun 1 2006 18:28:12.251 EDT: GTP-SR: un-packing nsapi = 5MWAM 10/2: 000152: Jun 1 2006 18:28:12.251 EDT: GTP-SR: un-packing pdpcb->internal_flags 9175041MWAM 10/2: 000153: Jun 1 2006 18:28:12.251 EDT: GTP-SR: un-packing pdpcb->mnrgflag 0MWAM 10/2: 000154: Jun 1 2006 18:28:12.251 EDT: GTP-SR: un-packing pdpcb->open_cdr_sent 0MWAM 10/2: 000155: Jun 1 2006 18:28:12.251 EDT: GTP-SR: un-packing pdpcb->charging_reserved 0MWAM 10/2: 000156: Jun 1 2006 18:28:12.251 EDT: GTP-SR: un-packing pdpcb->pri 1MWAM 10/2: 000157: Jun 1 2006 18:28:12.251 EDT: GTP-SR: un-packing pdpcb->fastswitchable 0MWAM 10/2: 000158: Jun 1 2006 18:28:12.251 EDT: GTP-SR: un-packing pdpcb-sgsn_addr_sig 10.10.50.3MWAM 10/2: 000159: Jun 1 2006 18:28:12.251 EDT: GTP-SR: un-packing pdpcb-sgsn_addr_data 10.10.50.3MWAM 10/2: 000160: Jun 1 2006 18:28:12.251 EDT: GTP-SR: un-packing of pdpcb->sequence_sig 1MWAM 10/2: 000161: Jun 1 2006 18:28:12.251 EDT: GTP-SR: un-packing of pdpcb->fl_sig_up 0MWAM 10/2: 000162: Jun 1 2006 18:28:12.251 EDT: GTP-SR: un-packing of pdpcb->fl_data1_up 0MWAM 10/2: 000163: Jun 1 2006 18:28:12.251 EDT: GTP-SR: un-packing of pdpcb->fl_sig_down 0MWAM 10/2: 000164: Jun 1 2006 18:28:12.251 EDT: GTP-SR: un-packing of pdpcb->fl_data1_down 0MWAM 10/2: 000165: Jun 1 2006 18:28:12.251 EDT: GTP-SR: un-packing of pdpcb->fl_data2 0MWAM 10/2: 000166: Jun 1 2006 18:28:12.251 EDT: GTP-SR: un-packing of pdpcb->cause 128MWAM 10/2: 000167: Jun 1 2006 18:28:12.251 EDT: GTP-SR: un-packing of pdpcb->restart_count 0MWAM 10/2: 000168: Jun 1 2006 18:28:12.251 EDT: GTP-SR: un-packing of pdpcb->create_time Apr 13 2006 01:25:25MWAM 10/2: 000169: Jun 1 2006 18:28:12.251 EDT: GTP-SR: un-packing of pdpcb->last_access_time Apr 13 2006 01:25:25MWAM 10/2: 000170: Jun 1 2006 18:28:12.251 EDT: GTP-SR: unpacking pdpcb->teid_cntl_remote 1MWAM 10/2: 000171: Jun 1 2006 18:28:12.251 EDT: GTP-SR: unpacking pdpcb->teid_data_local 4194306MWAM 10/2: 000172: Jun 1 2006 18:28:12.251 EDT: GTP-SR: unpacking pdpcb->teid_data_remote 1000MWAM 10/2: 000173: Jun 1 2006 18:28:12.251 EDT: GTP-SR: unpacking pdpcb->charging_id 471179447MWAM 10/2: 000174: Jun 1 2006 18:28:12.251 EDT: GTP-SR: unpacking pdpcb->cdr_recseqnum 0MWAM 10/2: 000175: Jun 1 2006 18:28:12.251 EDT: GTP-SR: un-packing of pdpcb->reorder_required FFMWAM 10/2: 000176: Jun 1 2006 18:28:12.251 EDT: GTP-SR: We wanted teid 4194306, and got 4194306MWAM 10/2: 000177: Jun 1 2006 18:28:12.251 EDT: GTP-SR: Got teid 4194306 as requestedMWAM 10/2: 000178: Jun 1 2006 18:28:12.251 EDT: pdp_create_by_tid on standby:tid 100000050, pdp 24A90B24MWAM 10/2: 000179: Jun 1 2006 18:28:12.251 EDT: GPRS:0100000000000050:GTP-SR: Successfully unpack PDPMWAM 10/2: 000180: Jun 1 2006 18:28:12.251 EDT: GTP-SR: rulebase ID MS unpackedMWAM 10/2: 000181: Jun 1 2006 18:28:12.251 EDT: GTP-SR: cc_session ccfh 0 failover_supported 1 reqnum 1 packedMWAM 10/2: 000182: Jun 1 2006 18:28:12.251 EDT: GTP-SR: new cc_session dest_host ips-clcis1.cisco.com unpackedMWAM 10/2: 000183: Jun 1 2006 18:28:12.251 EDT: GTP-SR: new cc_session dest_realm cisco.com unpackedMWAM 10/2: 000184: Jun 1 2006 18:28:12.251 EDT: GTP-SR: Unpacking 1 categoriesMWAM 10/2: 000185: Jun 1 2006 18:28:12.251 EDT: GTP-SR: Unpacking category of ID 4MWAM 10/2: 000186: Jun 1 2006 18:28:12.255 EDT: GTP-SR: Creating red context for category ID 4 username 100000000000000 on APN ms-apnMWAM 10/2: 000187: Jun 1 2006 18:28:12.255 EDT: GTP-SR: Need to allocate redundancy contextMWAM 10/2: 000188: Jun 1 2006 18:28:12.255 EDT: GTP-SR: adding element in state-list Initialized, final count 5MWAM 10/2: 000189: Jun 1 2006 18:28:12.255 EDT: GTP-SR: Removing element from state-list Initialized, final count 4MWAM 10/2: 000190: Jun 1 2006 18:28:12.255 EDT: GTP-SR: adding element in state-list Synched, final count 1MWAM 10/2: 000191: Jun 1 2006 18:28:12.255 EDT: GPRS:0100000000000050:shdb 0xC6000008 created for category 4 (handle 0xDE000001)MWAM 10/2: 000192: Jun 1 2006 18:28:12.255 EDT: GTP-SR: red context installed for the new category (shdb: active 0x95000008, standby 0xC6000008)MWAM 10/2: 000193: Jun 1 2006 18:28:12.255 EDT: GTP-SR: new category ID 4 unpacked:MWAM 10/2: 000194: Jun 1 2006 18:28:12.255 EDT: GTP-SR: sync data len 164MWAM 10/2: 000195: Jun 1 2006 18:28:12.255 EDT: GTP-SR: active shdb 0x95000008MWAM 10/2: 000196: Jun 1 2006 18:28:12.255 EDT: GTP-SR: CSG session ID 27599459844129MWAM 10/2: 000197: Jun 1 2006 18:28:12.255 EDT: GTP-SR: chrg last svc rec seqnum 0MWAM 10/2: 000198: Jun 1 2006 18:28:12.255 EDT: GTP-SR: category state AUTHORIZEDMWAM 10/2: 000199: Jun 1 2006 18:28:12.255 EDT: GTP-SR: category state trigger flags 0x3MWAM 10/2: 000200: Jun 1 2006 18:28:12.255 EDT: GTP-SR: category sub flags 0x0MWAM 10/2: 000201: Jun 1 2006 18:28:12.255 EDT: GTP-SR: sync flag 0x0MWAM 10/2: 000202: Jun 1 2006 18:28:12.255 EDT: GTP-SR: quotas includedMWAM 10/2: 000203: Jun 1 2006 18:28:12.255 EDT: GTP-SR: last req timestamp 0MWAM 10/2: 000204: Jun 1 2006 18:28:12.255 EDT: GTP-SR: last req seqnum 0MWAM 10/2: 000205: Jun 1 2006 18:28:12.255 EDT: GTP-SR: address received from active with radius source isMWAM 10/2: 000206: Jun 1 2006 18:28:12.259 EDT: GTP-SR:Context Type PDP, Handler Sync, Context Event Context Setup, Context Sub Event No Sub EventMWAM 10/2: 000207: Jun 1 2006 18:28:12.259 EDT: GTP-SR:State of Redundancy Context is InitializedMWAM 10/2: 000208: Jun 1 2006 18:28:12.259 EDT: GTP-SR: Event Context Setup, Sub Event No Sub EventMWAM 10/2: 000209: Jun 1 2006 18:28:12.259 EDT: GTP-SR: Removing element from state-list Initialized, final count 3MWAM 10/2: 000210: Jun 1 2006 18:28:12.259 EDT: GTP-SR: adding element in state-list Bulk Synch Ready, final count 4MWAM 10/2: 000211: Jun 1 2006 18:28:15.091 EDT: GTP-SR: Redundancy RF Event Received is Update Redundancy ContextMWAM 10/2: 000212: Jun 1 2006 18:28:15.091 EDT: GTP-SR: Redundancy Event is Category updateMWAM 10/2: 000213: Jun 1 2006 18:28:15.091 EDT: GTP-SR: red context found (active shdb 0x95000008, standby shdb 0xC6000008)MWAM 10/2: 000214: Jun 1 2006 18:28:15.091 EDT: GTP-SR Packet Dump: Len for dump: org_len=188, len=128MWAM 10/2: 000215: Jun 1 2006 18:28:15.091 EDT: 7C 0 0 5 0 0 58 2 0 0 0 1 0 34 34 0MWAM 10/2: 000216: Jun 1 2006 18:28:15.091 EDT: 0 0 0 0 0 0 0 0 0 0 0 0 0 0 0 95MWAM 10/2: 000217: Jun 1 2006 18:28:15.091 EDT: 0 0 8 0 0 19 1A 0 0 0 21 0 0 0 0 0MWAM 10/2: 000218: Jun 1 2006 18:28:15.091 EDT: 0 0 9 0 0 0 3 0 0 A 0 0 0 0 0 0MWAM 10/2: 000219: Jun 1 2006 18:28:15.091 EDT: 0 0 0 0 0 0 0 0 0 0 0 0 0 0 0 0MWAM 10/2: 000220: Jun 1 2006 18:28:15.095 EDT: 0 0 0 0 0 0 0 0 0 0 0 0 0 0 0 0MWAM 10/2: 000221: Jun 1 2006 18:28:15.095 EDT: 0 0 0 0 0 0 0 0 0 0 0 0 0 0 0 0MWAM 10/2: 000222: Jun 1 2006 18:28:15.095 EDT: 0 0 0 0 0 0 0 0 0 0 0 0 0 0 0 0MWAM 10/2: 000223: Jun 1 2006 18:28:15.095 EDT: ...MWAM 10/2: 000224: Jun 1 2006 18:28:15.095 EDT: GTP-SR: category found with handle 0xDE000001 shdbs: active 0x95000008 standby 0xC6000008 (MCB shdbs: active 0x7C000005, standby 0xC6000008)MWAM 10/2: 000225: Jun 1 2006 18:28:15.095 EDT: GTP-SR: MCB internal flags 0x5802 unpackedMWAM 10/2: 000226: Jun 1 2006 18:28:15.095 EDT: GTP-SR: cc_session reqnum 1 unpacked and installedMWAM 10/2: 000227: Jun 1 2006 18:28:15.095 EDT: GTP-SR: Unpacking category of ID 4MWAM 10/2: 000228: Jun 1 2006 18:28:15.095 EDT: GTP-SR: sync obj created in prep for MCB deletionMWAM 10/2: 000229: Jun 1 2006 18:28:15.095 EDT: GTP-SR: category ID 4 unpacked:MWAM 10/2: 000230: Jun 1 2006 18:28:15.095 EDT: GTP-SR: sync data len 52MWAM 10/2: 000231: Jun 1 2006 18:28:15.095 EDT: GTP-SR: active shdb 0x95000008MWAM 10/2: 000232: Jun 1 2006 18:28:15.095 EDT: GTP-SR: CSG session ID 27599459844129MWAM 10/2: 000233: Jun 1 2006 18:28:15.095 EDT: GTP-SR: chrg last svc rec seqnum 0MWAM 10/2: 000234: Jun 1 2006 18:28:15.095 EDT: GTP-SR: category state PENDING_SERVICE_STOPMWAM 10/2: 000235: Jun 1 2006 18:28:15.095 EDT: GTP-SR: category state trigger flags 0x3MWAM 10/2: 000236: Jun 1 2006 18:28:15.095 EDT: GTP-SR: category sub flags 0x0MWAM 10/2: 000237: Jun 1 2006 18:28:15.095 EDT: GTP-SR: sync flag 0xAMWAM 10/2: 000238: Jun 1 2006 18:28:15.095 EDT: GTP-SR: quotas not includedMWAM 10/2: 000239: Jun 1 2006 18:28:15.095 EDT: GTP-SR: last req timestamp 0MWAM 10/2: 000240: Jun 1 2006 18:28:15.095 EDT: GTP-SR: last req seqnum 0MWAM 10/2: 000241: Jun 1 2006 18:28:15.095 EDT: GTP-SR: Redundancy RF Event Received is Redundancy Context DeleteMWAM 10/2: 000242: Jun 1 2006 18:28:15.095 EDT: GTP-SR: Redundancy Event is Context RemoveMWAM 10/2: 000243: Jun 1 2006 18:28:15.095 EDT: GTP-SR Packet Dump: Len for dump: org_len=40, len=40MWAM 10/2: 000244: Jun 1 2006 18:28:15.095 EDT: 0 0 0 0 0 0 0 0 0 0 0 0 0 0 0 0MWAM 10/2: 000245: Jun 1 2006 18:28:15.095 EDT: 0 0 0 0 0 0 0 0 0 0 0 0 0 0 0 0MWAM 10/2: 000246: Jun 1 2006 18:28:15.095 EDT: 0 0 0 0 0 0 0 0MWAM 10/2: 000247: Jun 1 2006 18:28:15.095 EDT: GPRS:GTP-SR: Deleting v1 MCB on the standbyMWAM 10/2: 000248: Jun 1 2006 18:28:15.095 EDT: GPRS:0100000000000050:GTP-SR: Deleting v1 PDP on the standbyMWAM 10/2: 000249: Jun 1 2006 18:28:15.095 EDT: GTP-SR: MCB deletion sync obj deletedMWAM 10/2: 000250: Jun 1 2006 18:28:15.095 EDT: GTP-SR: Removing element from state-list Synched, final count 0MWAM 10/2: 000251: Jun 1 2006 18:28:15.095 EDT: GTP-SR: Removing element from state-list Bulk Synch Ready, final count 3MWAM 10/2: 000252: Jun 1 2006 18:29:15.103 EDT: GTP-SR: Redundancy RF Event Received is Redundancy Context DeleteMWAM 10/2: 000253: Jun 1 2006 18:29:15.103 EDT: GTP-SR: Redundancy Event is Path RemoveMWAM 10/2: 000254: Jun 1 2006 18:29:15.103 EDT: GTP-SR:Context Type Path, Handler Delete, Context Event Path Remove, Context Sub Event No Sub EventMWAM 10/2: 000255: Jun 1 2006 18:29:15.103 EDT: GTP-SR:State of Redundancy Context is Bulk Synch ReadyMWAM 10/2: 000256: Jun 1 2006 18:29:15.103 EDT: GTP-SR: Event Path Remove, Sub Event No Sub EventMWAM 10/2: 000257: Jun 1 2006 18:29:15.103 EDT: GTP-SR: Removing element from state-list Bulk Synch Ready, final count 2MWAM 10/2: 000258: Jun 1 2006 18:29:15.103 EDT: GTP-SR: Redundancy RF Event Received is Redundancy Context DeleteMWAM 10/2: 000259: Jun 1 2006 18:29:15.103 EDT: GTP-SR: Redundancy Event is Path RemoveMWAM 10/2: 000260: Jun 1 2006 18:29:15.103 EDT: GTP-SR:Context Type Path, Handler Delete, Context Event Path Remove, Context Sub Event No Sub EventMWAM 10/2: 000261: Jun 1 2006 18:29:15.103 EDT: GTP-SR:State of Redundancy Context is Bulk Synch ReadyMWAM 10/2: 000262: Jun 1 2006 18:29:15.103 EDT: GTP-SR: Event Path Remove, Sub Event No Sub EventMWAM 10/2: 000263: Jun 1 2006 18:29:15.103 EDT: GTP-SR: Removing element from state-list Bulk Synch Ready, final count 1Related CommandsRouter# debug gprs gtp events
debug glbp errors
To display debugging messages about Gateway Load Balancing Protocol (GLBP) error conditions, use the debug glbp errors command in privileged EXEC mode. To disable debugging output, use the no form of this command.
debug glbp errors
no debug glbp errors
Syntax Description
This command has no arguments or keywords.
Command Modes
Privileged EXEC
Command History
12.2(14)S
This command was introduced.
12.2(15)T
This command was integrated into Cisco IOS Release 12.2(15)T.
Examples
The following is sample output from the debug glbp errors command:
Router# debug glbp errorsGLBP Errors debugging is on1d19h: GLBP: Fa0/0 API active virtual address 10.21.8.32 not found1d19h: GLBP: Fa0/0 API active virtual address 10.21.8.32 not found1d19h: GLBP: Fa0/0 API active virtual address 10.21.8.32 not foundRelated Commands
debug condition glbp
Displays debugging messages about GLBP that match specific conditions.
debug glbp events
To display debugging messages about Gateway Load Balancing Protocol (GLBP) events that are occurring, use the debug glbp events command in privileged EXEC mode. To disable debugging output, use the no form of this command.
debug glbp events [all | api | cache | detail | ha | icmp | protocol | redundancy | terse | track]
no debug glbp events [all | api | cache | detail | ha | icmp | protocol | redundancy | terse | track]
Syntax Description
Command Modes
Privileged EXEC (#)
Command History
Examples
The following is sample output from the debug glbp events command when the terse keyword is specified:
Router# debug glbp events terseGLBP Events debugging is on(protocol, redundancy, track)The following is sample output from the debug glbp events command on an active RP displaying an interface shutdown event:
Router# debug glbp eventsGLBP Events debugging is on*Sep 15 09:14:53.583: GLBP: Et0/0 API Software interface going down*Sep 15 09:14:53.583: GLBP: Et0/0 API Software interface going down*Sep 15 09:14:53.583: GLBP: Et0/0 Interface down*Sep 15 09:14:53.583: GLBP: Et0/0 1.1 Listen: e/Forwarder disabled*Sep 15 09:14:53.583: GLBP: Et0/0 1.1 Listen -> Init*Sep 15 09:14:53.583: GLBP: Et0/0 Fwd 1.1 HA Encoded (state Init) into sync buffer*Sep 15 09:14:53.583: GLBP: Et0/0 1.2 Active: e/Forwarder disabled*Sep 15 09:14:53.583: GLBP: Et0/0 1.2 Active -> Init*Sep 15 09:14:53.583: %GLBP-6-FWDSTATECHANGE: Ethernet0/0 Grp 1 Fwd 2 state Active -> Init*Sep 15 09:14:53.583: GLBP: Et0/0 Fwd 1.2 HA Encoded (state Init) into sync buffer*Sep 15 09:14:53.583: GLBP: Et0/0 1 Standby: e/GLBP disabled*Sep 15 09:14:53.583: GLBP: Et0/0 1 Active router IP is unknown, was 172.24.1.2*Sep 15 09:14:53.583: GLBP: Et0/0 1 Standby router is unknown, was local*Sep 15 09:14:53.583: GLBP: Et0/0 1 Standby -> Init*Sep 15 09:14:53.583: GLBP: Et0/0 Grp 1 HA Encoded (state Init) into sync buffer*Sep 15 09:14:55.583: %LINK-5-CHANGED: Interface Ethernet0/0, changed state to administratively down*Sep 15 09:14:55.587: GLBP: API Hardware state change*Sep 15 09:14:56.595: %LINEPROTO-5-UPDOWN: Line protocol on Interface Ethernet0/0, changed state to downThe following is sample output from the debug glbp events command on a standby RP displaying an interface shutdown event:RouterRP-standby# debug glbp eventsGLBP Events debugging is on...*Sep 15 09:14:53.691: GLBP: Et0/0 Fwd 1.1 HA sync, state Listen -> Init*Sep 15 09:14:53.691: GLBP: Et0/0 Fwd 1.2 HA sync, state Active -> Init*Sep 15 09:14:53.691: GLBP: Et0/0 Grp 1 HA sync, state Standby -> InitThe following is sample output from the debug glbp events command when the cache keyword is specified:
Router# debug glbp events cacheGLBP Events debugging is on (cache)Jun 30 08:57:50.171: GLBP: Et0/0 1 Added client cache entry for 7bcf.e03d.d3bdJun 30 08:57:50.171: GLBP: Et0/0 1 Added client cache entry for c5e8.46eb.8a86Jun 30 08:57:50.171: GLBP: Et0/0 1 Added client cache entry for 69e5.9d95.0f7eJun 30 08:57:50.171: GLBP: Et0/0 1 Added client cache entry for 986e.d98a.1607Jun 30 08:57:50.171: GLBP: Et0/0 1 Added client cache entry for 1843.ee62.f62eJun 30 08:57:50.171: GLBP: Et0/0 1 Added client cache entry for 5f4c.cfc4.5dc1Related Commands
debug condition glbp
Displays debugging messages about GLBP that match specific conditions.
debug glbp packets
To display summary information about Gateway Load Balancing Protocol (GLBP) packets being sent or received, use the debug glbp packets command in privileged EXEC mode. To disable debugging output, use the no form of this command.
debug glbp packets [all | detail | hello | reply | request | terse]
no debug glbp packets [all | detail | hello | reply | request | terse]
Syntax Description
Command Modes
Privileged EXEC
Command History
12.2(14)S
This command was introduced.
12.2(15)T
This command was integrated into Cisco IOS Release 12.2(15)T.
Examples
The following sample output from the debug glbp packets command shows debugging output about GLBP hello packets:
Router# debug glbp packets helloGLBP Packets debugging is on(Hello)1d19h: GLBP: Fa0/0 Grp 10 Hello out 10.21.8.32 VG Active pri 254 vIP 10.21.8.10 11d19h: GLBP: Fa0/0 Grp 10 Hello out 10.21.8.32 VG Active pri 254 vIP 10.21.8.10 11d19h: GLBP: Fa0/0 Grp 10 Hello out 10.21.8.32 VG Active pri 254 vIP 10.21.8.10 11d19h: GLBP: Fa0/0 Grp 10 Hello out 10.21.8.32 VG Active pri 254 vIP 10.21.8.10 1Related Commands
debug condition glbp
Displays debugging messages about GLBP that match specific conditions.
debug glbp terse
To display a limited range of debugging messages about Gateway Load Balancing Protocol (GLBP) errors, events, and packets, use the debug glbp terse command in privileged EXEC mode. To disable debugging output, use the no form of this command.
debug glbp terse
no debug glbp terse
Syntax Description
This command has no arguments or keywords.
Command Modes
Privileged EXEC
Command History
12.2(14)S
This command was introduced.
12.2(15)T
This command was integrated into Cisco IOS Release 12.2(15)T.
Examples
The following is sample output from the debug glbp terse command:
Router# debug glbp terseGLBP:GLBP Errors debugging is onGLBP Events debugging is on(protocol, redundancy, track)GLBP Packets debugging is on(Request, Reply)Related Commands
debug gprs charging
To display information about general packet radio service (GPRS) charging functions on the gateway GPRS support node (GGSN), use the debug gprs charging command in privileged EXEC mode. To disable debugging output, use the no form of this command.
debug gprs charging {events | packets}
no debug gprs charging {events | packets}
Syntax Description
events
Displays events related to GPRS charging processing on the GGSN.
packets
Displays GPRS charging packets that are sent between the GGSN and the charging gateway.
Defaults
No default behavior or values
Command Modes
Privileged EXEC
Command History
Usage Guidelines
This command is useful for system operators if problems are encountered with GPRS charging functions.
Caution
Examples
The following example enables the display of events related to GPRS charging events on the GGSN:
Router# debug gprs charging eventsThe following example enables the display of GPRS charging packets sent between the GGSN and the charging gateway:
Router# debug gprs charging eventsdebug gprs dfp
To display debug messages for general packet radio service (GPRS) DFP weight calculation, use the debug gprs dfp command in privileged EXEC mode. To disable debugging output, use the no form of this command.
debug gprs dfp
no debug gprs dfp
Syntax Description
This command has no arguments or keywords.
Defaults
No default behavior or values
Command Modes
Privileged EXEC
Command History
Usage Guidelines
Caution
This command displays debug messages for GPRS DFP weight calculation. To display debug messages for the DFP agent subsystem, use the debug ip dfp agent command.
Examples
The following example configures a debug session to check all GPRS DFP weight calculation:
Router# debug gprs dfpGPRS DFP debugging is onRouter#The following example stops all debugging:
Router# no debug allAll possible debugging has been turned offRouter#debug gprs dhcp
To display information about Dynamic Host Configuration Protocol (DHCP) processing on the gateway GPRS support node (GGSN), use the debug gprs dhcp command in privileged EXEC mode. To disable debugging output, use the no form of this command.
debug gprs dhcp
no debug gprs dhcp
Syntax Description
This command has no arguments or keywords.
Defaults
No default behavior or values
Command Modes
Privileged EXEC
Command History
Usage Guidelines
This command is useful for system operators and development engineers if problems are encountered with DHCP processing on the GGSN. To display standard debug messages between the DHCP client on the router and a DHCP server, you can also use the debug dhcp or debug dhcp detail commands with the debug gprs dhcp command.
Caution
Examples
The following example shows sample output for DHCP processing on the GGSN:
Router# debug gprs dhcp2d13h: GPRS:DHCP req:TID 1111111100000099, Req 12d13h: GPRS:Requesting IP address for pdp 1111111100000099 from server 172.16.0.8tableid 02d13h: GPRS:DHCP ip allocation pass (10.88.17.43) for pdp 11111111000000992d13h: GPRS:Using DHCP ip address 10.88.17.43 for pdp 1111111100000099The following example shows sample output for standard debug messaging for DHCP processing on the router between the DHCP client and a DHCP server:
2d13h: DHCP: proxy allocate request2d13h: DHCP: new entry. add to queue2d13h: DHCP: SDiscover attempt # 1 for entry:2d13h: DHCP: SDiscover: sending 283 byte length DHCP packet2d13h: DHCP: SDiscover with directed serv 172.16.0.8, 283 bytes2d13h: DHCP: XID MATCH in dhcpc_for_us()2d13h: DHCP: Received a BOOTREP pkt2d13h: DHCP: offer received from 172.16.0.82d13h: DHCP: SRequest attempt # 1 for entry:2d13h: DHCP: SRequest- Server ID option: 172.16.0.82d13h: DHCP: SRequest- Requested IP addr option: 10.88.17.432d13h: DHCP: SRequest placed lease len option: 6048002d13h: DHCP: SRequest: 301 bytes2d13h: DHCP: SRequest: 301 bytes2d13h: DHCP: XID MATCH in dhcpc_for_us()2d13h: DHCP: Received a BOOTREP pkt2d13h: DHCP Proxy Client Pooling: ***Allocated IP address: 10.88.17.43Related Commands
debug dhcp
Displays debug messages between the DHCP client on the router and a DHCP server.
debug gprs gtp
To display information about the general packet radio service (GPRS) Tunneling Protocol (GTP), use the debug gprs gtp command in privileged EXEC mode. To disable debugging output, use the no form of this command.
debug gprs gtp {events | messages | packets | ppp {details | events}}
no debug gprs gtp {events | messages | packets | ppp {details | events}}
Syntax Description
Defaults
No default behavior or values
Command Modes
Privileged EXEC
Command History
Usage Guidelines
This command is useful for system operators and development engineers if problems are encountered with communication between the GGSN and the SGSN using GTP.
Caution
Examples
The following example enables the display of events related to GTP processing on the GGSN:
Router# debug gprs gtp eventsThe following example enables the display of GTP signaling messages:
Router# debug gprs gtp messagesThe following example enables the display of GTP packets sent between the SGSN and GGSN:
Router# debug gprs gtp packetsThe following example enables the display of GTP PPP events between the SGSN and GGSN:
Router# debug gprs gtp ppp eventsThe following example enables the display of detailed GTP PPP debug output along with GTP PPP events between the SGSN and GGSN:
Router# debug gprs gtp ppp detailsRouter# debug gprs gtp ppp eventsdebug gprs gtp-director
To display information about the general packet radio service (GPRS) Tunneling Protocol (GTP) Director Module (GDM), use the debug gprs gtp-director command in privileged EXEC mode. To disable debugging output, use the no form of this command.
debug gprs gtp-director {events | packets}
no debug gprs gtp-director {events | packets}
Syntax Description
events
Displays events related to GDM processing.
packets
Displays packets that are sent between GDM and a gateway GPRS support node (GGSN).
Defaults
No default behavior or values
Command Modes
Privileged EXEC
Command History
Usage Guidelines
This command is useful for system operators and development engineers if problems are encountered with communication between GDM and an SGSN, or between GDM and a GGSN.
Caution
Examples
The following debug examples provide sample output for a create PDP context request, delete PDP context request, and clear PDP context using PPP regeneration on the GGSN. The first three examples show output related to debug events messaging only. The last three examples show output while both debug events and details are enabled on the GGSN.
Example 1
The following example displays events related to PPP regeneration processing for a create PDP context requested received by the GGSN:
Router# debug gprs gtp-director events*Mar 1 00:02:42.787: GPRS:1111110000000000:Authen: PAP username: user@pdn.com*Mar 1 00:02:42.787: GPRS:1111110000000000:Processing Initiate PPP regen from reqQ*Mar 1 00:02:42.787: GPRS:1111110000000000:got event [REQUEST PPP REGEN] in state [IDLE]*Mar 1 00:02:42.787: GPRS:1111110000000000:state [IDLE->AUTHORIZING] on event[REQUEST PPP REGEN]*Mar 1 00:02:42.787: GPRS:1111110000000000:Got VPN authorization info*Mar 1 00:02:42.787: GPRS:1111110000000000:got event [AUTHOR SUCCESS] in state[AUTHORIZING]*Mar 1 00:02:42.787: GPRS:1111110000000000:state [AUTHORIZING->VPDN CONNECTING]on event [AUTHOR SUCCESS]*Mar 1 00:02:42.787: GPRS:1111110000000000:Author succeeded, establishing the tunnel*Mar 1 00:02:42.787: GPRS:1111110000000000:Create/Clone vaccess to negotiate PPP*Mar 1 00:02:42.791: GPRS:1111110000000000:MS no static IP addr. Get one via IPCP*Mar 1 00:02:42.827: GPRS:1111110000000000:VPDN to inform PPP regen: CONNECTED*Mar 1 00:02:42.827: GPRS:1111110000000000:got event [VPDN CONNECTED] in state[VPDN CONNECTING]*Mar 1 00:02:42.827: GPRS:1111110000000000:state [VPDN CONNECTING->PPP NEGOTIATING]on event [VPDN CONNECTED]*Mar 1 00:02:42.827: GPRS:1111110000000000:Start PPP negotiations on vaccess*Mar 1 00:02:42.831: %LINK-3-UPDOWN: Interface Virtual-Access3, changed state to up*Mar 1 00:02:42.835: GPRS:1111110000000000:IPCP is up*Mar 1 00:02:42.835: GPRS:1111110000000000:IP addr 10.10.1.187 is negotiated for MS*Mar 1 00:02:42.835: GPRS:1111110000000000:DNS - Primary: 10.3.0.1 Secondary: 0.0.0.0NetBios - Primary: 0.0.0.0, Secondary: 0.0.0.0*Mar 1 00:02:42.835: GPRS:1111110000000000:PPP connected*Mar 1 00:02:42.835: GPRS:1111110000000000:got event [PPP NEGOTIATED] in state[PPP NEGOTIATING]*Mar 1 00:02:42.835: GPRS:1111110000000000:state [PPP NEGOTIATING->PPP CONNECTED]on event [PPP NEGOTIATED]*Mar 1 00:02:42.835: GPRS:1111110000000000:PPP succeeded negotiation, session established*Mar 1 00:02:43.835: %LINEPROTO-5-UPDOWN: Line protocol on Interface Virtual-Access3,changed state to upExample 2
The following example displays events related to PPP regeneration processing for a delete PDP context requested received by the GGSN:
Router# debug gprs gtp-director events*Mar 1 00:03:18.331: GPRS:1111110000000000:GTP disconnecting the PPP regen session*Mar 1 00:03:18.331: GPRS:1111110000000000:Processing Disconnect PPP regen from reqQ*Mar 1 00:03:18.331: GPRS:1111110000000000:got event [CANCEL REGEN'ED PPP] in state[PPP CONNECTED]*Mar 1 00:03:18.331: GPRS:1111110000000000:state [PPP CONNECTED->PPP TERMINATING]on event [CANCEL REGEN'ED PPP]*Mar 1 00:03:18.331: GPRS:1111110000000000:Cancel request after VPND tunnel is up*Mar 1 00:03:18.335: GPRS:1111110000000000:PPP down*Mar 1 00:03:18.335: GPRS:1111110000000000:got event [PPP FAILED] in state[PPP TERMINATING]*Mar 1 00:03:18.339: GPRS:1111110000000000:state [PPP TERMINATING->IDLE] on event[PPP FAILED]*Mar 1 00:03:18.339: GPRS:1111110000000000:PPP failed negotiation*Mar 1 00:03:18.339: GPRS:1111110000000000:got event [CLEANUP CONTEXT] in state [IDLE]*Mar 1 00:03:18.339: GPRS:1111110000000000:VPDN to inform PPP regen: DISCONNECTED*Mar 1 00:03:18.339: GPRS:1111110000000000:got event [VPDN DISCONNECTED] in state [IDLE]*Mar 1 00:03:18.339: GPRS:1111110000000000:state [IDLE->IDLE] on event [CLEANUP CONTEXT]*Mar 1 00:03:18.339: GPRS:1111110000000000:Freeing context structure*Mar 1 00:03:18.339: %LINK-3-UPDOWN: Interface Virtual-Access3, changed state to down*Mar 1 00:03:19.331: %LINEPROTO-5-UPDOWN: Line protocol on Interface Virtual-Access3,changed state to downExample 3
The following example displays events related to PPP regeneration processing as the GGSN clears a PDP context request:
Router# debug gprs gtp-director events*Mar 1 00:04:50.083: GPRS:1111110000000000:GTP disconnecting the PPP regen session*Mar 1 00:04:50.083: GPRS:1111110000000000:Processing Disconnect PPP regen from reqQ*Mar 1 00:04:50.083: GPRS:1111110000000000:got event [CANCEL REGEN'ED PPP] in state[PPP CONNECTED]*Mar 1 00:04:50.083: GPRS:1111110000000000:state [PPP CONNECTED->PPP TERMINATING]on event [CANCEL REGEN'ED PPP]*Mar 1 00:04:50.083: GPRS:1111110000000000:Cancel request after VPND tunnel is up*Mar 1 00:04:50.087: GPRS:1111110000000000:PPP down*Mar 1 00:04:50.087: GPRS:1111110000000000:got event [PPP FAILED] in state[PPP TERMINATING]*Mar 1 00:04:50.091: GPRS:1111110000000000:state [PPP TERMINATING->IDLE] on event[PPP FAILED]*Mar 1 00:04:50.091: GPRS:1111110000000000:PPP failed negotiation*Mar 1 00:04:50.091: GPRS:1111110000000000:got event [CLEANUP CONTEXT] in state [IDLE]*Mar 1 00:04:50.091: GPRS:1111110000000000:VPDN to inform PPP regen: DISCONNECTED*Mar 1 00:04:50.091: GPRS:1111110000000000:got event [VPDN DISCONNECTED] in state [IDLE]*Mar 1 00:04:50.091: GPRS:1111110000000000:state [IDLE->IDLE] on event [CLEANUP CONTEXT]*Mar 1 00:04:50.091: GPRS:1111110000000000:Freeing context structure*Mar 1 00:04:50.091: %LINK-3-UPDOWN: Interface Virtual-Access4, changed state to down*Mar 1 00:04:51.083: %LINEPROTO-5-UPDOWN: Line protocol on Interface Virtual-Access4,changed state to downExample 4
The following example displays both debug events and details related to PPP regeneration processing for a create PDP context requested received by the GGSN:
Router# debug gprs gtp-director eventsRouter# debug gprs gtp-director details*Mar 1 00:05:21.083: PPP-REGEN state counters: pending counter is 0*Mar 1 00:05:21.083: State[IDLE] counter is 0*Mar 1 00:05:21.083: State[AUTHORIZING] counter is 0*Mar 1 00:05:21.083: State[VPDN CONNECTING] counter is 0*Mar 1 00:05:21.083: State[PPP NEGOTIATING] counter is 0*Mar 1 00:05:21.083: State[PPP CONNECTED] counter is 0*Mar 1 00:05:21.083: State[PPP TERMINATING] counter is 0*Mar 1 00:05:21.087: PPP-REGEN state counters: pending counter is 1*Mar 1 00:05:21.087: State[IDLE] counter is 1*Mar 1 00:05:21.087: State[AUTHORIZING] counter is 0*Mar 1 00:05:21.087: State[VPDN CONNECTING] counter is 0*Mar 1 00:05:21.087: State[PPP NEGOTIATING] counter is 0*Mar 1 00:05:21.087: State[PPP CONNECTED] counter is 0*Mar 1 00:05:21.087: State[PPP TERMINATING] counter is 0*Mar 1 00:05:21.087: GPRS:1111110000000000:Authen: PAP username: user@pdn.com*Mar 1 00:05:21.087: GPRS:1111110000000000:Session timer started*Mar 1 00:05:21.087: GPRS:1111110000000000:Processing Initiate PPP regen from reqQ*Mar 1 00:05:21.087: GPRS:1111110000000000:got event [REQUEST PPP REGEN] in state [IDLE]*Mar 1 00:05:21.087: PPP-REGEN state counters: pending counter is 1*Mar 1 00:05:21.087: State[IDLE] counter is 0*Mar 1 00:05:21.087: State[AUTHORIZING] counter is 1*Mar 1 00:05:21.087: State[VPDN CONNECTING] counter is 0*Mar 1 00:05:21.087: State[PPP NEGOTIATING] counter is 0*Mar 1 00:05:21.087: State[PPP CONNECTED] counter is 0*Mar 1 00:05:21.087: State[PPP TERMINATING] counter is 0*Mar 1 00:05:21.087: GPRS:1111110000000000:state [IDLE->AUTHORIZING] on event[REQUEST PPP REGEN]*Mar 1 00:05:21.087: GPRS:1111110000000000:Got VPN authorization info*Mar 1 00:05:21.087: GPRS:1111110000000000:got event [AUTHOR SUCCESS]in state [AUTHORIZING]*Mar 1 00:05:21.087: PPP-REGEN state counters: pending counter is 1*Mar 1 00:05:21.087: State[IDLE] counter is 0*Mar 1 00:05:21.087: State[AUTHORIZING] counter is 0*Mar 1 00:05:21.087: State[VPDN CONNECTING] counter is 1*Mar 1 00:05:21.087: State[PPP NEGOTIATING] counter is 0*Mar 1 00:05:21.087: State[PPP CONNECTED] counter is 0*Mar 1 00:05:21.087: State[PPP TERMINATING] counter is 0*Mar 1 00:05:21.087: GPRS:1111110000000000:state [AUTHORIZING->VPDN CONNECTING]on event [AUTHOR SUCCESS]*Mar 1 00:05:21.087: GPRS:1111110000000000:Author succeeded, establishing the tunnel*Mar 1 00:05:21.087: GPRS:1111110000000000:Create/Clone vaccess to negotiate PPP*Mar 1 00:05:21.091: GPRS:1111110000000000:MS no static IP addr. Get one via IPCP*Mar 1 00:05:21.127: GPRS:1111110000000000:VPDN to inform PPP regen: CONNECTED*Mar 1 00:05:21.127: GPRS:1111110000000000:got event [VPDN CONNECTED] in state[VPDN CONNECTING]*Mar 1 00:05:21.127: PPP-REGEN state counters: pending counter is 1*Mar 1 00:05:21.127: State[IDLE] counter is 0*Mar 1 00:05:21.127: State[AUTHORIZING] counter is 0*Mar 1 00:05:21.127: State[VPDN CONNECTING] counter is 0*Mar 1 00:05:21.127: State[PPP NEGOTIATING] counter is 1*Mar 1 00:05:21.127: State[PPP CONNECTED] counter is 0*Mar 1 00:05:21.127: State[PPP TERMINATING] counter is 0*Mar 1 00:05:21.127: GPRS:1111110000000000:state [VPDN CONNECTING->PPP NEGOTIATING]on event [VPDN CONNECTED]*Mar 1 00:05:21.127: GPRS:1111110000000000:Start PPP negotiations on vaccess*Mar 1 00:05:21.131: %LINK-3-UPDOWN: Interface Virtual-Access5, changed state to up*Mar 1 00:05:22.135: %LINEPROTO-5-UPDOWN: Line protocol on Interface Virtual-Access5,changed state to up*Mar 1 00:05:23.143: GPRS:1111110000000000:IPCP is up*Mar 1 00:05:23.143: GPRS:1111110000000000:LNS allocates 10.10.1.187 for MS*Mar 1 00:05:23.143: GPRS:1111110000000000:IP addr 10.10.1.187 is negotiated for MS*Mar 1 00:05:23.143: GPRS:1111110000000000:DNS - Primary: 10.3.0.1 Secondary: 0.0.0.0NetBios - Primary: 0.0.0.0, Secondary: 0.0.0.0*Mar 1 00:05:23.143: GPRS:1111110000000000:PPP connected*Mar 1 00:05:23.143: GPRS:1111110000000000:got event [PPP NEGOTIATED] in state[PPP NEGOTIATING]*Mar 1 00:05:23.143: PPP-REGEN state counters: pending counter is 0*Mar 1 00:05:23.143: State[IDLE] counter is 0*Mar 1 00:05:23.143: State[AUTHORIZING] counter is 0*Mar 1 00:05:23.143: State[VPDN CONNECTING] counter is 0*Mar 1 00:05:23.143: State[PPP NEGOTIATING] counter is 0*Mar 1 00:05:23.143: State[PPP CONNECTED] counter is 1*Mar 1 00:05:23.143: State[PPP TERMINATING] counter is 0*Mar 1 00:05:23.143: GPRS:1111110000000000:state [PPP NEGOTIATING->PPP CONNECTED]on event [PPP NEGOTIATED]*Mar 1 00:05:23.143: GPRS:1111110000000000:PPP succeeded negotiation, session established*Mar 1 00:05:23.143: GPRS:1111110000000000:Session timer stoppedExample 5
The following example displays both debug events and details related to PPP regeneration processing for a delete PDP context requested received by the GGSN:
Router# debug gprs gtp-director eventsRouter# debug gprs gtp-director details*Mar 1 00:05:52.399: PPP-REGEN state counters: pending counter is 0*Mar 1 00:05:52.399: State[IDLE] counter is 0*Mar 1 00:05:52.399: State[AUTHORIZING] counter is 0*Mar 1 00:05:52.399: State[VPDN CONNECTING] counter is 0*Mar 1 00:05:52.399: State[PPP NEGOTIATING] counter is 0*Mar 1 00:05:52.399: State[PPP CONNECTED] counter is 1*Mar 1 00:05:52.399: State[PPP TERMINATING] counter is 0*Mar 1 00:05:52.399: GPRS:1111110000000000:PPP regen current state PPP CONNECTED*Mar 1 00:05:52.399: GPRS:1111110000000000:GTP disconnecting the PPP regen session*Mar 1 00:05:52.399: GPRS:1111110000000000:Processing Disconnect PPP regen from reqQ*Mar 1 00:05:52.399: GPRS:1111110000000000:got event [CANCEL REGEN'ED PPP] in state[PPP CONNECTED]*Mar 1 00:05:52.399: PPP-REGEN state counters: pending counter is 1*Mar 1 00:05:52.399: State[IDLE] counter is 0*Mar 1 00:05:52.399: State[AUTHORIZING] counter is 0*Mar 1 00:05:52.399: State[VPDN CONNECTING] counter is 0*Mar 1 00:05:52.399: State[PPP NEGOTIATING] counter is 0*Mar 1 00:05:52.399: State[PPP CONNECTED] counter is 0*Mar 1 00:05:52.399: State[PPP TERMINATING] counter is 1*Mar 1 00:05:52.399: GPRS:1111110000000000:state [PPP CONNECTED->PPP TERMINATING]on event [CANCEL REGEN'ED PPP]*Mar 1 00:05:52.399: GPRS:1111110000000000:Cancel request after VPND tunnel is up*Mar 1 00:05:52.403: GPRS:1111110000000000:PPP down*Mar 1 00:05:52.403: GPRS:1111110000000000:got event [PPP FAILED] in state[PPP TERMINATING]*Mar 1 00:05:52.407: PPP-REGEN state counters: pending counter is 1*Mar 1 00:05:52.407: State[IDLE] counter is 1*Mar 1 00:05:52.407: State[AUTHORIZING] counter is 0*Mar 1 00:05:52.407: State[VPDN CONNECTING] counter is 0*Mar 1 00:05:52.407: State[PPP NEGOTIATING] counter is 0*Mar 1 00:05:52.407: State[PPP CONNECTED] counter is 0*Mar 1 00:05:52.407: State[PPP TERMINATING] counter is 0*Mar 1 00:05:52.407: GPRS:1111110000000000:state [PPP TERMINATING->IDLE] on event[PPP FAILED]*Mar 1 00:05:52.407: GPRS:1111110000000000:PPP failed negotiation*Mar 1 00:05:52.407: GPRS:1111110000000000:got event [CLEANUP CONTEXT] in state [IDLE]*Mar 1 00:05:52.407: GPRS:1111110000000000:VPDN to inform PPP regen: DISCONNECTED*Mar 1 00:05:52.407: GPRS:1111110000000000:got event [VPDN DISCONNECTED] in state [IDLE]*Mar 1 00:05:52.407: GPRS:1111110000000000:state [IDLE->IDLE] on event [CLEANUP CONTEXT]*Mar 1 00:05:52.407: GPRS:1111110000000000:Freeing context structure*Mar 1 00:05:52.407: GPRS:1111110000000000:Session timer stopped*Mar 1 00:05:52.407: PPP-REGEN state counters: pending counter is 0*Mar 1 00:05:52.407: State[IDLE] counter is 0*Mar 1 00:05:52.407: State[AUTHORIZING] counter is 0*Mar 1 00:05:52.407: State[VPDN CONNECTING] counter is 0*Mar 1 00:05:52.407: State[PPP NEGOTIATING] counter is 0*Mar 1 00:05:52.407: State[PPP CONNECTED] counter is 0*Mar 1 00:05:52.407: State[PPP TERMINATING] counter is 0*Mar 1 00:05:52.407: GPRS:1111110000000000:PPP regen context 0x6219F4BC released*Mar 1 00:05:52.407: GPRS:GTP-PPP-REGEN context magic(0x619D4FBC) invalid*Mar 1 00:05:52.407: %LINK-3-UPDOWN: Interface Virtual-Access5, changed state to down*Mar 1 00:05:53.399: %LINEPROTO-5-UPDOWN: Line protocol on Interface Virtual-Access5,changed state to downExample 6
The following example displays both debug events and details related to PPP regeneration processing as the GGSN clears a PDP context request:
Router# debug gprs gtp-director eventsRouter# debug gprs gtp-director details*Mar 1 00:06:34.907: PPP-REGEN state counters: pending counter is 0*Mar 1 00:06:34.907: State[IDLE] counter is 0*Mar 1 00:06:34.907: State[AUTHORIZING] counter is 0*Mar 1 00:06:34.907: State[VPDN CONNECTING] counter is 0*Mar 1 00:06:34.907: State[PPP NEGOTIATING] counter is 0*Mar 1 00:06:34.907: State[PPP CONNECTED] counter is 1*Mar 1 00:06:34.907: State[PPP TERMINATING] counter is 0*Mar 1 00:06:34.907: GPRS:1111110000000000:PPP regen current state PPP CONNECTED*Mar 1 00:06:34.907: GPRS:1111110000000000:GTP disconnecting the PPP regen session*Mar 1 00:06:34.907: GPRS:1111110000000000:Processing Disconnect PPP regen from reqQ*Mar 1 00:06:34.907: GPRS:1111110000000000:got event [CANCEL REGEN'ED PPP] in state[PPP CONNECTED]*Mar 1 00:06:34.907: PPP-REGEN state counters: pending counter is 1*Mar 1 00:06:34.907: State[IDLE] counter is 0*Mar 1 00:06:34.907: State[AUTHORIZING] counter is 0*Mar 1 00:06:34.907: State[VPDN CONNECTING] counter is 0*Mar 1 00:06:34.907: State[PPP NEGOTIATING] counter is 0*Mar 1 00:06:34.907: State[PPP CONNECTED] counter is 0*Mar 1 00:06:34.907: State[PPP TERMINATING] counter is 1*Mar 1 00:06:34.907: GPRS:1111110000000000:state [PPP CONNECTED->PPP TERMINATING]on event [CANCEL REGEN'ED PPP]*Mar 1 00:06:34.907: GPRS:1111110000000000:Cancel request after VPND tunnel is up*Mar 1 00:06:34.911: GPRS:1111110000000000:PPP down*Mar 1 00:06:34.911: GPRS:1111110000000000:got event [PPP FAILED] in state[PPP TERMINATING]*Mar 1 00:06:34.915: PPP-REGEN state counters: pending counter is 1*Mar 1 00:06:34.915: State[IDLE] counter is 1*Mar 1 00:06:34.915: State[AUTHORIZING] counter is 0*Mar 1 00:06:34.915: State[VPDN CONNECTING] counter is 0*Mar 1 00:06:34.915: State[PPP NEGOTIATING] counter is 0*Mar 1 00:06:34.915: State[PPP CONNECTED] counter is 0*Mar 1 00:06:34.915: State[PPP TERMINATING] counter is 0*Mar 1 00:06:34.915: GPRS:1111110000000000:state [PPP TERMINATING->IDLE] on event[PPP FAILED]*Mar 1 00:06:34.915: GPRS:1111110000000000:PPP failed negotiation*Mar 1 00:06:34.915: GPRS:1111110000000000:got event [CLEANUP CONTEXT] in state [IDLE]*Mar 1 00:06:34.915: GPRS:1111110000000000:VPDN to inform PPP regen: DISCONNECTED*Mar 1 00:06:34.915: GPRS:1111110000000000:got event [VPDN DISCONNECTED] in state [IDLE]*Mar 1 00:06:34.915: GPRS:1111110000000000:state [IDLE->IDLE] on event [CLEANUP CONTEXT]*Mar 1 00:06:34.915: GPRS:1111110000000000:Freeing context structure*Mar 1 00:06:34.915: GPRS:1111110000000000:Session timer stopped*Mar 1 00:06:34.915: PPP-REGEN state counters: pending counter is 0*Mar 1 00:06:34.915: State[IDLE] counter is 0*Mar 1 00:06:34.915: State[AUTHORIZING] counter is 0*Mar 1 00:06:34.915: State[VPDN CONNECTING] counter is 0*Mar 1 00:06:34.915: State[PPP NEGOTIATING] counter is 0*Mar 1 00:06:34.915: State[PPP CONNECTED] counter is 0*Mar 1 00:06:34.915: State[PPP TERMINATING] counter is 0*Mar 1 00:06:34.915: GPRS:1111110000000000:PPP regen context 0x62196E10 released*Mar 1 00:06:34.915: GPRS:GTP-PPP-REGEN context magic(0x619D4FBC) invalid*Mar 1 00:06:34.915: %LINK-3-UPDOWN: Interface Virtual-Access3, changed state to down*Mar 1 00:06:35.907: %LINEPROTO-5-UPDOWN: Line protocol on Interface Virtual-Access3,changed state to downdebug gprs gtp parsing
To display information about the parsing of general packet radio service (GPRS) Tunneling Protocol (GTP) information elements (IEs) in signaling requests, use the debug gprs gtp parsing command in privileged EXEC mode. To disable debugging output, use the no form of this command.
debug gprs gtp parsing
no debug gprs gtp parsing
Syntax Description
This command has no arguments or keywords.
Defaults
No default behavior or values
Command Modes
Privileged EXEC
Command History
Usage Guidelines
This command is useful for system operators and development engineers to verify parsing of GTP IEs in signaling requests that are received by GDM or by the gateway GPRS support node (GGSN). If the packet is parsed successfully, you will receive a message along with the tunnel identifier (TID) for the packet as shown in the following example:
GPRS:TID:7300000000000000:Packet Parsed successfullyThe debug gprs gtp parsing command can be used to verify GDM or GGSN processing of IEs.
Caution
Examples
The following example enables the display of debug messages that occur while GDM or the GGSN parses GTP IEs:
Router# debug gprs gtp parsingdebug gprs gtp ppp
To display information about Point-to-Point Protocol (PPP) packet data protocol (PDP) type processing on the gateway GPRS support node (GGSN), use the debug gprs gtp ppp command in privileged EXEC mode. To disable debugging output, use the no form of this command.
debug gprs gtp ppp {events | details}
no debug gprs gtp ppp {events | details}
Syntax Description
events
Displays messages specific to certain conditions that are occurring during PPP PDP type processing.
details
Displays more extensive and lower-level messages related to PPP PDP type processing.
Defaults
No default behavior or values
Command Modes
Privileged EXEC
Command History
Usage Guidelines
This command is useful for system operators and development engineers if problems are encountered with PPP PDP type processing on the GGSN.
You can enable both forms of the debug gprs gtp ppp command at the same time as separate command line entries. The events keyword generates output specific to certain conditions that are occurring, which helps qualify the output being received using the details option.
Caution
Examples
The following debug examples provide sample output for a create PDP context request and clear PDP context using PPP PDP type on the GGSN. The examples show output while both debug events and details are enabled on the GGSN.
Example 1
The following example displays details and events output related to PPP PDP context processing for a create PDP context requested received by the GGSN:
Router# debug gprs gtp ppp eventsGTP PPP events display debugging is onRouter# debug gprs gtp ppp detailsGTP PPP details display debugging is ontb9-7200b#3d23h: GPRS:3d23h: GTP-PPP Fa1/0: Create new gtp_ppp_info3d23h: GPRS:3d23h: GTP-PPP: domain gprs.cisco.com not in any VPDN group3d23h: GPRS:3d23h: GTP-PPP: aaa-group accounting not configured under APN gprs.cisco.com3d23h: GPRS:GTP-PPP: Don't cache internally generated pak's header3d23h: %LINK-3-UPDOWN: Interface Virtual-Access2, changed state to up3d23h: GPRS:3d23h: GTP-PPP Vi2: gtp_ppp_cstate_react changing states3d23h: GPRS:GTP-PPP: pdp_entry 0x62F442A4, recv ppp data pak3d23h: GPRS:GTP-PPP Vi2: proc_udp_input pak's linktype = 303d23h: GPRS:GTP-PPP: pdp_entry 0x62F442A4, recv ppp data pak3d23h: GPRS:GTP-PPP Vi2: proc_udp_input pak's linktype = 303d23h: GPRS:GTP-PPP: pdp_entry 0x62F442A4, recv ppp data pak3d23h: GPRS:GTP-PPP Vi2: proc_udp_input pak's linktype = 303d23h: GPRS:3d23h: GTP-PPP: Vi2: Concat names user00 & gprs.cisco.com3d23h: GPRS:3d23h: GTP-PPP: New username after concat: user00@gprs.cisco.com3d23h: GPRS:3d23h: GTP-PPP: Vi2: Concat names user00@gprs.cisco.com & gprs.cisco.com3d23h: GPRS:3d23h: GTP-PPP: New username after concat: user00@gprs.cisco.com3d23h: GPRS:GTP-PPP: pdp_entry 0x62F442A4, recv ppp data pak3d23h: GPRS:GTP-PPP Vi2: proc_udp_input pak's linktype = 303d23h: GPRS:GTP-PPP: pdp_entry 0x62F442A4, recv ppp data pak3d23h: GPRS:GTP-PPP Vi2: proc_udp_input pak's linktype = 303d23h: GPRS:GTP-PPP: pdp_entry 0x62F442A4, recv ppp data pak3d23h: GPRS:GTP-PPP Vi2: proc_udp_input pak's linktype = 303d23h: GPRS:GTP-PPP: pdp_entry 0x62F442A4, recv ppp data pak3d23h: GPRS:GTP-PPP Vi2: proc_udp_input pak's linktype = 303d23h: %LINEPROTO-5-UPDOWN: Line protocol on Interface Virtual-Access2, changed state toup3d23h: GPRS:GTP-PPP: pdp_entry 0x62F442A4, recv ppp data pak3d23h: GPRS:GTP-PPP Vi2: proc_udp_input pak's linktype = 303d23h: GPRS:GTP-PPP: pdp_entry 0x62F442A4, recv ppp data pak3d23h: GPRS:GTP-PPP Vi2: proc_udp_input pak's linktype = 303d23h: GPRS:3d23h: GTP-PPP Vi2: gtp_ppp_protocol_up is notified about intf UP3d23h: GPRS:3d23h: GTP-PPP Vi2: PDP w/ MS addr 98.102.0.1 inserted into IP radix treeExample 2
The following example displays both details and events related to PPP PDP type processing after clearing PDP contexts on the GGSN:
Router# clear gprs gtp pdp-context all3d23h: GPRS:GTP-PPP: pdp_entry 0x62F442A4, recv ppp data pak3d23h: GPRS:GTP-PPP Vi2: proc_udp_input pak's linktype = 303d23h: GPRS:GTP-PPP: pdp_entry 0x62F442A4, recv ppp data pak3d23h: GPRS:GTP-PPP Vi2: proc_udp_input pak's linktype = 303d23h: GPRS:3d23h: GTP-PPP Vi2: gtp_ppp_pdp_terminate shutting down the vaccess3d23h: GPRS:3d23h: GTP-PPP Vi2: gtp_ppp_pdp_shut_va shutting down intf3d23h: %LINK-3-UPDOWN: Interface Virtual-Access2, changed state to down3d23h: GPRS:3d23h: GTP-PPP Vi2: gtp_ppp_cstate_react changing states3d23h: GPRS:3d23h: GTP-PPP Vi2: gtp_ppp_free_va resetting intf vectors3d23h: %LINEPROTO-5-UPDOWN: Line protocol on Interface Virtual-Access2, changed stateto downdebug gprs gtp ppp-regeneration
To display information about Point-to-Point Protocol (PPP) regeneration processing on the gateway GPRS support node (GGSN), use the debug gprs gtp ppp-regeneration command in privileged EXEC mode. To disable debugging output, use the no form of this command.
debug gprs gtp ppp-regeneration {events | details}
no debug gprs gtp ppp-regeneration {events | details}
Syntax Description
Defaults
No default behavior or values
Command Modes
Privileged EXEC
Command History
Usage Guidelines
This command is useful for system operators and development engineers if problems are encountered with communication between GDM and a GGSN.
You can enable both forms of the debug gprs gtp ppp-regeneration command at the same time as separate command line entries. The events keyword generates output specific to certain conditions that are occurring, which helps qualify the output being received using the details option.
Caution
Examples
The following debug examples provide sample output for a create PDP context request and clear PDP context using PPP regeneration on the GGSN. The examples show output while both debug events and details are enabled on the GGSN.
Example 1
The following example displays details and events output related to PPP regeneration processing for a create PDP context requested received by the GGSN:
Router# debug gprs gtp ppp-regeneration detailsGTP PPP regeneration details display debugging is onRouter# debug gprs gtp ppp-regeneration eventsGTP PPP regeneration events display debugging is on06:24:02: PPP-REGEN state counters: pending counter is 006:24:02: State[IDLE] counter is 006:24:02: State[AUTHORIZING] counter is 006:24:02: State[VPDN CONNECTING] counter is 006:24:02: State[PPP NEGOTIATING] counter is 006:24:02: State[PPP CONNECTED] counter is 006:24:02: State[PPP TERMINATING] counter is 006:24:02: PPP-REGEN state counters: pending counter is 106:24:02: State[IDLE] counter is 106:24:02: State[AUTHORIZING] counter is 006:24:02: State[VPDN CONNECTING] counter is 006:24:02: State[PPP NEGOTIATING] counter is 006:24:02: State[PPP CONNECTED] counter is 006:24:02: State[PPP TERMINATING] counter is 006:24:02: GPRS:1011111111500001:Authen: PAP username: tomy1@corporate_1.com06:24:02: GPRS:1011111111500001:Session timer started06:24:02: GPRS:Processing PPP regen reqQ06:24:02: GPRS:1011111111500001:Processing Initiate PPP regen from reqQ06:24:02: GPRS:1011111111500001:got event [REQUEST PPP REGEN] in state [IDLE]06:24:02: PPP-REGEN state counters: pending counter is 106:24:02: State[IDLE] counter is 006:24:02: State[AUTHORIZING] counter is 106:24:02: State[VPDN CONNECTING] counter is 006:24:02: State[PPP NEGOTIATING] counter is 006:24:02: State[PPP CONNECTED] counter is 006:24:02: State[PPP TERMINATING] counter is 006:24:02: GPRS:1011111111500001:state [IDLE->AUTHORIZING] on event [REQUEST PPP REGEN]06:24:02: GPRS:1011111111500001:Got VPN authorization info06:24:02: GPRS:1011111111500001:got event [AUTHOR SUCCESS] in state [AUTHORIZING]06:24:02: PPP-REGEN state counters: pending counter is 106:24:02: State[IDLE] counter is 006:24:02: State[AUTHORIZING] counter is 006:24:02: State[VPDN CONNECTING] counter is 106:24:02: State[PPP NEGOTIATING] counter is 006:24:02: State[PPP CONNECTED] counter is 006:24:02: State[PPP TERMINATING] counter is 006:24:02: GPRS:1011111111500001:state [AUTHORIZING->VPDN CONNECTING] on event[AUTHOR SUCCESS]06:24:02: GPRS:1011111111500001:Author succeeded, establishing the tunnel06:24:02: GPRS:1011111111500001:Create/Clone vaccess to negotiate PPP06:24:02: GPRS:1011111111500001:no need to set NS ppp_config06:24:02: GPRS:1011111111500001:MS no static IP addr. Get one via IPCP06:24:02: GPRS:1011111111500001:VPDN to inform PPP regen: CONNECTED06:24:02: GPRS:1011111111500001:got event [VPDN CONNECTED] in state [VPDN CONNECTING]06:24:02: PPP-REGEN state counters: pending counter is 106:24:02: State[IDLE] counter is 006:24:02: State[AUTHORIZING] counter is 006:24:02: State[VPDN CONNECTING] counter is 006:24:02: State[PPP NEGOTIATING] counter is 106:24:02: State[PPP CONNECTED] counter is 006:24:02: State[PPP TERMINATING] counter is 006:24:02: GPRS:1011111111500001:state [VPDN CONNECTING->PPP NEGOTIATING] on event[VPDN CONNECTED]06:24:02: GPRS:1011111111500001:Start PPP negotiations on vaccess06:24:02: %LINK-3-UPDOWN: Interface Virtual-Access2, changed state to up06:24:02: GPRS:1011111111500001:IPCP is up06:24:02: GPRS:1011111111500001:LNS allocates 10.100.1.1 for MS06:24:02: GPRS:1011111111500001:IP addr 10.100.1.1 is negotiated for MS06:24:02: GPRS:1011111111500001:PPP connected06:24:02: GPRS:1011111111500001:got event [PPP NEGOTIATED] in state [PPP NEGOTIATING]06:24:02: PPP-REGEN state counters: pending counter is 006:24:02: State[IDLE] counter is 006:24:02: State[AUTHORIZING] counter is 006:24:02: State[VPDN CONNECTING] counter is 006:24:02: State[PPP NEGOTIATING] counter is 006:24:02: State[PPP CONNECTED] counter is 106:24:02: State[PPP TERMINATING] counter is 006:24:02: GPRS:1011111111500001:state [PPP NEGOTIATING->PPP CONNECTED] on event[PPP NEGOTIATED]06:24:02: GPRS:1011111111500001:PPP succeeded negotiation, session established06:24:02: GPRS:1011111111500001:Session timer stopped06:24:03: %LINEPROTO-5-UPDOWN: Line protocol on Interface Virtual-Access2, changedstate to upExample 2
The following example displays both details and events related to PPP regeneration processing after clearing PDP contexts on the GGSN:Router# clear gprs gtp pdp-context all06:28:05: PPP-REGEN state counters: pending counter is 006:28:05: State[IDLE] counter is 006:28:05: State[AUTHORIZING] counter is 006:28:05: State[VPDN CONNECTING] counter is 006:28:05: State[PPP NEGOTIATING] counter is 006:28:05: State[PPP CONNECTED] counter is 106:28:05: State[PPP TERMINATING] counter is 006:28:05: GPRS:1011111111500001:PPP regen current state PPP CONNECTED06:28:05: GPRS:1011111111500001:GTP disconnecting the PPP regen session06:28:05: GPRS:Processing PPP regen reqQ06:28:05: GPRS:1011111111500001:Processing Disconnect PPP regen from reqQ06:28:05: GPRS:1011111111500001:got event [CANCEL REGEN'ED PPP] in state [PPP CONNECTED]06:28:05: PPP-REGEN state counters: pending counter is 106:28:05: State[IDLE] counter is 006:28:05: State[AUTHORIZING] counter is 006:28:05: State[VPDN CONNECTING] counter is 006:28:05: State[PPP NEGOTIATING] counter is 006:28:05: State[PPP CONNECTED] counter is 006:28:05: State[PPP TERMINATING] counter is 106:28:05: GPRS:1011111111500001:state [PPP CONNECTED->PPP TERMINATING] on event[CANCEL REGEN'ED PPP]06:28:05: GPRS:1011111111500001:Cancel request after VPND tunnel is up06:28:05: PPP-REGEN state counters: pending counter is 106:28:05: State[IDLE] counter is 006:28:05: State[AUTHORIZING] counter is 006:28:05: State[VPDN CONNECTING] counter is 006:28:05: State[PPP NEGOTIATING] counter is 006:28:05: State[PPP CONNECTED] counter is 006:28:05: State[PPP TERMINATING] counter is 106:28:05: GPRS:1011111111500001:PPP down06:28:05: GPRS:1011111111500001:got event [PPP FAILED] in state [PPP TERMINATING]06:28:05: PPP-REGEN state counters: pending counter is 106:28:05: State[IDLE] counter is 106:28:05: State[AUTHORIZING] counter is 006:28:05: State[VPDN CONNECTING] counter is 006:28:05: State[PPP NEGOTIATING] counter is 006:28:05: State[PPP CONNECTED] counter is 006:28:05: State[PPP TERMINATING] counter is 006:28:05: GPRS:1011111111500001:state [PPP TERMINATING->IDLE] on event [PPP FAILED]06:28:05: GPRS:1011111111500001:LCP went down06:28:05: GPRS:1011111111500001:VPDN disconnect06:28:05: GPRS:1011111111500001:got event [CLEANUP CONTEXT] in state [IDLE]06:28:05: GPRS:1011111111500001:state [IDLE->IDLE] on event [CLEANUP CONTEXT]06:28:05: GPRS:1011111111500001:Freeing context structure06:28:05: GPRS:1011111111500001:VPDN handle invalid, no need to free it06:28:05: GPRS:1011111111500001:remove PPP regen context from Vi206:28:05: GPRS:1011111111500001:Session timer stopped06:28:05: PPP-REGEN state counters: pending counter is 006:28:05: State[IDLE] counter is 006:28:05: State[AUTHORIZING] counter is 006:28:05: State[VPDN CONNECTING] counter is 006:28:05: State[PPP NEGOTIATING] counter is 006:28:05: State[PPP CONNECTED] counter is 006:28:05: State[PPP TERMINATING] counter is 006:28:05: GPRS:1011111111500001:PPP regen context 0x633F196C released06:28:05: %LINK-3-UPDOWN: Interface Virtual-Access2, changed state to down06:28:06: %LINEPROTO-5-UPDOWN: Line protocol on Interface Virtual-Access2, changedstate to downdebug gprs radius
To display information about Remote Access Dial-In User Service (RADIUS) processing on the gateway general packet radio service (GPRS) support node (GGSN), use the debug gprs radius privileged EXEC command. To disable debugging output, use the no form of this command.
debug gprs radius
no debug gprs radius
Syntax Description
This command has no arguments or keywords.
Defaults
No default behavior or values
Command Modes
Privileged EXEC
Command History
Usage Guidelines
This command is useful for system operators and development engineers if problems are encountered with communication between a RADIUS server and the GGSN.
Caution
Examples
The following example enables the display of debug messages related to RADIUS processing on the GGSN:
Router# debug gprs radius
![]()
![]()
![]()
![]()
![]()
![]()
![]()
![]()
Posted: Mon Jul 2 06:48:24 PDT 2007
All contents are Copyright © 1992--2007 Cisco Systems, Inc. All rights reserved.
Important Notices and Privacy Statement.