|
|

Table Of Contents
debug aaa dead-criteria transactions
Debug Commands
This chapter contains an alphabetical listing of the debug commands and their descriptions. Documentation for each command includes a brief description of its use, command syntax, usage guidelines, sample output, and a description of that output.
debug aaa accounting
To display information on accountable events as they occur, use the debug aaa accounting command in privileged EXEC mode. To disable debugging output, use the no form of this command.
debug aaa accounting
no debug aaa accounting
Syntax Description
This command has no arguments or keywords.
Command Modes
Privileged EXEC
Usage Guidelines
The information displayed by the debug aaa accounting command is independent of the accounting protocol used to transfer the accounting information to a server. Use the debug tacacs and debug radius protocol-specific commands to get more detailed information about protocol-level issues.
You can also use the show accounting command to step through all active sessions and to print all the accounting records for actively accounted functions. The show accounting command allows you to display the active "accountable events" on the system. It provides systems administrators a quick look at what is happening, and may also be useful for collecting information in the event of a data loss of some kind on the accounting server. The show accounting command displays additional data on the internal state of the authentication, authorization, and accounting (AAA) security system if debug aaa accounting is turned on as well.
Examples
The following is sample output from the debug aaa accounting command:
Router# debug aaa accounting16:49:21: AAA/ACCT: EXEC acct start, line 1016:49:32: AAA/ACCT: Connect start, line 10, glare16:49:47: AAA/ACCT: Connection acct stop:task_id=70 service=exec port=10 protocol=telnet address=172.31.3.78 cmd=glare bytes_in=308 bytes_out=76 paks_in=45 paks_out=54 elapsed_time=14Related Commands
debug aaa authentication
To display information on authentication, authorization, and accounting (AAA) TACACS+ authentication, use the debug aaa authentication command in privileged EXEC mode. To disable debugging output, use the no form of this command.
debug aaa authentication
no debug aaa authentication
Syntax Description
This command has no arguments or keywords.
Command Modes
Privileged EXEC
Usage Guidelines
Use this command to learn the methods of authentication being used and the results of these methods.
Examples
The following is sample output from the debug aaa authentication command. A single EXEC login that uses the "default" method list and the first method, TACACS+, is displayed. The TACACS+ server sends a GETUSER request to prompt for the username and then a GETPASS request to prompt for the password, and finally a PASS response to indicate a successful login. The number 50996740 is the session ID, which is unique for each authentication. Use this ID number to distinguish between different authentications if several are occurring concurrently.
Router# debug aaa authentication6:50:12: AAA/AUTHEN: create_user user='' ruser='' port='tty19' rem_addr='172.31.60.15' authen_type=1 service=1 priv=16:50:12: AAA/AUTHEN/START (0): port='tty19' list='' action=LOGIN service=LOGIN6:50:12: AAA/AUTHEN/START (0): using "default" list6:50:12: AAA/AUTHEN/START (50996740): Method=TACACS+6:50:12: TAC+ (50996740): received authen response status = GETUSER6:50:12: AAA/AUTHEN (50996740): status = GETUSER6:50:15: AAA/AUTHEN/CONT (50996740): continue_login6:50:15: AAA/AUTHEN (50996740): status = GETUSER6:50:15: AAA/AUTHEN (50996740): Method=TACACS+6:50:15: TAC+: send AUTHEN/CONT packet6:50:15: TAC+ (50996740): received authen response status = GETPASS6:50:15: AAA/AUTHEN (50996740): status = GETPASS6:50:20: AAA/AUTHEN/CONT (50996740): continue_login6:50:20: AAA/AUTHEN (50996740): status = GETPASS6:50:20: AAA/AUTHEN (50996740): Method=TACACS+6:50:20: TAC+: send AUTHEN/CONT packet6:50:20: TAC+ (50996740): received authen response status = PASS6:50:20: AAA/AUTHEN (50996740): status = PASSdebug aaa authorization
To display information on authentication, authorization, and accounting (AAA) TACACS+ authorization, use the debug aaa authorization command in privileged EXEC mode. To disable debugging output, use the no form of this command.
debug aaa authorization
no debug aaa authorization
Syntax Description
This command has no arguments or keywords.
Command Modes
Privileged EXEC
Usage Guidelines
Use this command to learn the methods of authorization being used and the results of these methods.
Examples
The following is sample output from the debug aaa authorization command. In this display, an EXEC authorization for user "carrel" is performed. On the first line, the username is authorized. On the second and third lines, the attribute value (AV) pairs are authorized. The debug output displays a line for each AV pair that is authenticated. Next, the display indicates the authorization method used. The final line in the display indicates the status of the authorization process, which, in this case, has failed.
Router# debug aaa authorization2:23:21: AAA/AUTHOR (0): user='carrel'2:23:21: AAA/AUTHOR (0): send AV service=shell2:23:21: AAA/AUTHOR (0): send AV cmd*2:23:21: AAA/AUTHOR (342885561): Method=TACACS+2:23:21: AAA/AUTHOR/TAC+ (342885561): user=carrel2:23:21: AAA/AUTHOR/TAC+ (342885561): send AV service=shell2:23:21: AAA/AUTHOR/TAC+ (342885561): send AV cmd*2:23:21: AAA/AUTHOR (342885561): Post authorization status = FAILThe aaa authorization command causes a request packet containing a series of AV pairs to be sent to the TACACS+ daemon as part of the authorization process. The daemon responds in one of the following three ways:
•
Accepts the request as is
•
•
Table 2 describes AV pairs associated with the debug aaa authorization command that may appear in the debug output.
debug aaa cache filterserver
To help troubleshoot your filter cache configurations, use the debug aaa cache filterserver command in privileged EXEC mode. To disable debugging output, use the no form of this command.
debug aaa cache filterserver
no debug aaa cache filterserver
Syntax Description
This command has no arguments or keywords.
Command Modes
Privileged EXEC
Command History
Examples
The following is sample output from the debug aaa cache filterserver command:
Router# debug aaa cache filterserverAAA/FLTSV: need "myfilter" (fetch), call 0x612DAC64AAA/FLTSV: send req, call 0x612DAC50AAA/FLTSV: method SERVER_GROUP myradiusAAA/FLTSV: recv reply, call 0x612DAC50 (PASS)AAA/FLTSV: create cacheAAA/FLTSV: add attr "call-inacl"AAA/FLTSV: add attr "call-inacl"AAA/FLTSV: add attr "call-inacl"AAA/FLTSV: skip attr "filter-cache-refresh"AAA/FLTSV: skip attr "filter-cache-time"AAA/CACHE: set "AAA filtserv cache" entry "myfilter" refresh? noAAA/CACHE: set "AAA filtserv cache" entry "myfilter" cachetime 15AAA/FLTSV: add attr to list "call-inacl" call 0x612DAC64AAA/FLTSV: add attr to list "call-inacl" call 0x612DAC64AAA/FLTSV: add attr to list "call-inacl" call 0x612DAC64AAA/FLTSV: PASS call 0x612DAC64AAA/CACHE: timer "AAA filtserv cache", next in 10 secs (0 entries)AAA/CACHE: timer "AAA filtserv cache", next in 10 secs (1 entry)AAA/CACHE: destroy "AAA filtserv cache" entry "myfilter"AAA/CACHE: timer "AAA filtserv cache", next in 10 secs (0 entries)
Related Commands
aaa authorization cache filterserver
Enables AAA authorization caches and the downloading of ACL configurations from a RADIUS filter server.
debug aaa dead-criteria transactions
To display authentication, authorization, and accounting (AAA) dead-criteria transaction values, use the debug aaa dead-criteria transactions command in privileged EXEC mode. To disable dead-criteria debugging, use the no form of this command.
debug aaa dead-criteria transactions
no debug aaa dead-criteria transactions
Syntax Description
This command has no arguments or keywords.
Defaults
If the command is not configured, debugging is not turned on.
Command Modes
Privileged EXEC
Command History
Usage Guidelines
Dead-criteria transaction values may change with every AAA transaction. Some of the values that can be displayed are estimated outstanding transactions, retransmit tries, and dead-detect intervals. These values are explained in Table 3.
Examples
The following example shows dead-criteria transaction information for a particular server group:
Router# debug aaa dead-criteria transactionsAAA Transaction debugs debugging is on*Nov 14 23:44:17.403: AAA/SG/TRANSAC: Computed Retransmit Tries: 10, Current Tries: 3, Current Max Tries: 10*Nov 14 23:44:17.403: AAA/SG/TRANSAC: Computed Dead Detect Interval: 10s, Elapsed Time: 317s, Current Max Interval: 10s*Nov 14 23:44:17.403: AAA/SG/TRANSAC: Estimated Outstanding Transactions: 6, Current Max Transactions: 6Table 3 describes the significant fields shown in the display.
Related Commands
debug aaa per-user
To display debugging information about PPP session per-user activities, use the debug aaa per-user command in privileged EXEC mode. To turn off debugging, use the no form of this command.
debug aaa per-user
no debug aaa per-user
Syntax Description
This command has no arguments or keywords.
Command Modes
Privileged EXEC
Command History
Usage Guidelines
The per-user module is responsible for installing per-user attributes for PPP sessions.
Examples
The following example displays the configuration commands that were generated by the per-user process:
Router# debug aaa per-userAAA/PER-USER: line=[ip access-list standard Virtual-Access2#31]AAA/PER-USER: line=[deny 10.0.0.2 0.0.0.0]AAA/PER-USER: line=[permit any]The fields in the display are self-explanatory.
Related Commands
debug aaa pod
To display debug messages related to packet of disconnect (POD) packets, use the debug aaa pod command in privileged EXEC mode. To disable debugging output, use the no form of this command.
debug aaa pod
no debug aaa pod
Syntax Description
This command has no keywords or arguments.
Defaults
Debugging for POD packets is not enabled.
Command Modes
Privileged EXEC
Command History
Examples
The following example shows output from a successful POD request, when using the show debug command:
Router# debug aaa podAAA POD packet processing debugging is onRouter# show debugGeneral OS:AAA POD packet processing debugging is onRouter#Apr 25 17:15:59.318:POD:172.19.139.206 request queuedApr 25 17:15:59.318:voice_pod_request:Apr 25 17:15:59.318:voip_populate_pod_attr_list:Apr 25 17:15:59.318:voip_pod_get_guid:Apr 25 17:15:59.318:voip_pod_get_vsa_attr_val:Apr 25 17:15:59.318:voip_pod_get_vsa_attr_val:attr_len=50Apr 25 17:15:59.318:voip_pod_get_vsa_attr_val:attr=h323-conf-idApr 25 17:15:59.318:voip_pod_get_vsa_attr_val:attr_len=50 value_len=35Apr 25 17:15:59.318:voip_pod_get_guid:conf-id=FFA7785F F7F607BB00000000 993FB1F4 n_bytes=35Apr 25 17:15:59.318:voip_pod_get_guid:GUID = FFA7785F F7F607BB 00000000993FB1F4Apr 25 17:15:59.318:voip_populate_pod_attr_list:Apr 25 17:15:59.318:voip_pod_get_vsa_attr_val:Apr 25 17:15:59.318:voip_pod_get_vsa_attr_val:attr_len=23Apr 25 17:15:59.318:voip_pod_get_vsa_attr_val:attr=h323-originateApr 25 17:15:59.318:voip_pod_get_vsa_attr_val:attr_len=23 value_len=6Apr 25 17:15:59.318:voip_get_call_direction:Apr 25 17:15:59.318:voip_get_call_direction:returning answerApr 25 17:15:59.318:voip_eval_pod_attr:Apr 25 17:15:59.318:cc_api_trigger_disconnect:Apr 25 17:15:59.322:POD:Sending ACK to 172.19.139.206/1700Apr 25 17:15:59.322:voip_pod_clean:Related Commands
debug aaa sg-server selection
To obtain information about why the RADIUS and TACACS+ server group system in a router chooses a particular server, use the debug aaa sg-server selection command in privileged EXEC mode. To disable debugging output, use the no form of this command.
debug aaa sg-server selection
no debug aaa sg-server selection
Syntax Description
This command has no arguments or keywords.
Command Defaults
Debugging is not turned on.
Command Modes
Privileged EXEC
Command History
Examples
The following example shows that debugging has been set to display information about the server selection:
Router# debug aaa sg-server selectionThe following two debug outputs display the behavior of RADIUS transactions within a server group with the RADIUS Server Reorder on Failure feature configured.
Debug 1
In the following sample output, the RADIUS Server Reorder on Failure feature is configured. Server retransmits are set to 0 (so each server is attempted only once before failover to the next configured server), and the transmissions per transaction are set to 4 (the transmissions stop on the third failover). The third server in the server group (192.0.2.118) accepts the transaction on the third transmission (second failover).
00:38:35: %SYS-5-CONFIG-I: Configured from console by console00:38:53: RADIUS/ENCODE(OOOOOOOF) : ask "Username: "00:38:53: RADIUS/ENCODE (0000000F) : send packet; GET-USER00:38:58: RADIUS/ENCODE (0000000F) : ask "Password: "00:38:58: RADIUS/ENCODE(0000000F) : send packet; GET-PASSWORD00:38:59: RADIUS: AAA Unsupported [152] 400:38:59: RADIUS: 7474 [tt]00:38:59: RADIUS (0000000F) : Storing nasport 2 in rad-db00:38:59: RADIUS/ENCODE(0000000F) : dropping service type, "radius-serverattribute 6 on-for-login-auth" is off00:38:59: RADIUS (0000000F) : Config NAS IP: 192.168.2.400:38:59: RADIUS/ENCODE (0000000F) : acct-session-id: 1500:38:59: RADIUS (0000000F) : sending00:38:59: RADIUS/ENCODE: Best Local IP-Address 192.168.2.130 for Radius-Server 192.168.2.100:38:59: RAPIUS(0000000F) : Send Access-Request to 192.168.2.1:1645 id 21645/11, len 7800:38:59: RADIUS:: authenticator 4481 E6 65 2D 5F 6F OA -lE F5 81 8F 4E 1478 9C00:38:59: RADIUS: User-Name [1] 7 "username"00:38:59: RADIUS: User-Password [2] 18 *00:38:59: RADIUS: NAS-Port fSl 6 200:~8:59: RADIUS: NAS-Port-Type [61] 6 Virtual [5]00:38:59: RADIUS: Calling-Station-Id [31] 15 "192.168.2.23"00:39:00: RADIUS: NAS-IP-Address [4] 6 192.168.2.13000:39:02: RADIUS: Fail-over to (192.168.2.2:1645,1646) for id 21645/1100:39:02: RADIUS/ENCODE: Best Local IP-Address 192.168.2.130 for Radius-Server 192.168.2.200:39:04: RADIUS: Fail-over to (192.168.2.118:1645,1646) for id 21645/1100:39:04: RADIUS/ENCODE: Best Local IP-Address 192.168.2.130 for Radius-Server192.168.2.11800:39:05: RADIUS: Received from id 21645/11 192.168.2.118:1645, Access-Accept, len 2600:39:05: RADIUS: authenticator 5609 56 F9 64 4E DF 19- F3 A2 DD 73 EE 3F 982600:39:05: RADIUS: Service-Type [6] 6 Login [1]Debug 2
In the following sample output, the RADIUS Server Reorder on Failure feature is configured. Server retransmits are set to 0, and the transmissions per transaction are set to 8. In this transaction, the transmission to server 192.168.2.1 has failed on the eighth transmission.
00:42:30: RADIUS(00000011): Received from id 21645/1300:43:34: RADIUS/ENCODE(00000012) : ask "Username: "00:43:34: RADIUS/ENCODE(00000012) : send packet; GET-USER00:43:39: RADIUS/ENCODE(00000012) : ask "Password: "00:43:39: RADIUS/ENCODE(00000012) : send packet; GET-PASSWORD00:43:40: RADIUS: AAA Unsupported [152] 400:43:40: RADIUS: 7474 [tt]00:43:40: RADIUS(00000012) : Storing nasport 2 in rad-db00:43:40: RADIUS/ENCODE(00000012): dropping service type, "radius-server attribute 6on-for-login-auth" is off00:43:40: RADIUS(00000012) : Co~fig NAS IP: 192.168.2.400:43:40: RADIUS/ENCODE(00000012) : acct-session-id: 1800:43:40: RADIUS(00000012) : sending00:43:40: RADIUS/ENCODE: Best Local IP-Address 192.168.2.130 for Radius-Server 192.168.2.11800:43:40: RADIUS(00000012) : Send Access-Request to 192.168.2.118:1645 id 21645/14, len 7800:43:40: RADIUS: authenticator B8 OA 51 3A AF A6 0018 -B3 2E 94 5E 07 OB 2A00:43:40: RADIUS: User-Name [1] 7 "username"00:43:40: RADIUS: User-Password [2] 18 *00:43:40: RADIUS: NAS-Port [5] 6 200:43:40: RADIUS: NAS-Port-Type [61] 6 Virtual [5]00:43:40: RADIUS: Calling-Station-]d [31] 15 "192.168.2.23"00:43:40: RADIUS: NAS-IP-Address [4] 6 192.168.2.13000:43:42: RADIUS: Fail-over to (192.168.2,1:1645,1646) for id 21645/1400:43:42: RADIUS/ENCODE: Best Local IP-Address 192.168.2.130 for Radius-Server 192.168.2.100:43:44: RADius: Fail-over to (192.168.2.2:1645,1646) for id 21645/1400:43:44: RADIUS/ENCODE: Best Local IP-Address 192.168.2.130 for Radius-Server 192.168.2.200:43:46: RADIUS: Fail-over to (192.168.2.118:1645,1646) for id 21645/1400:43:46: RADIUS/ENCODE: Best Local IP-Address 192.168.2.130 for Radius-Server 192.168.2.11800:43:48: RADIUS: Fail-over to (192.168.2.1:1645,1646) for id 21645/1400:43:48: RADIUS/ENCODE: Best Local IP-Address 192.168.2.130 for Radius-Server 192.168.2.100:43:50: RADIUS: Fail-over to (192.168.2.2:1645,1646) for id 21645/1400:43:50: RADIUS/ENCODE: Best Local IP-Address 192.168.2.130 for Radius-Server 192.168.2.200:43:52: RADIUS: Fail-over to (192.168.2.118:1645,1646) for id 21645/1400:43:52: RADIUS/ENCODE: Best Local IP-Address 192.168.2.130 for Radius-Server 192.168.2.11800:43:54: RADIUS: Fail-over to (192.168.2.1:1645,1646) for id 21645/1400:43:54: RADIUS/ENCODE: Best Local IP-Address 192.168.2.130 for Radius-Server 192.168.2.100:43:56: RADIUS: No response from (192.168.2.1:1645,1646) for id 21645/1400:43:56:RADIUS/DECODE: parse response no app start; FAIL00:43:56: RADIUS/DECODE: parse response;FAILThe field descriptions are self-explanatory.
Debug 3
In the following sample output, the RADIUS Server Load Balancing feature is enabled with a batch size of 3. The server selection, based on the load balancing algorithm, is shown as five access-requests that are sent to the server group.
Router# debug aaa sg-server selectionJul 16 03:15:05: AAA/SG/SERVER_SELECT: Obtaining least loaded server.Jul 16 03:15:05: AAA/SG/SERVER_SELECT: [3] transactions remaining in batch. Reusing server.Jul 16 03:15:05: AAA/SG/SERVER_SELECT: Obtaining least loaded server.Jul 16 03:15:05: AAA/SG/SERVER_SELECT: [2] transactions remaining in batch. Reusing server.Jul 16 03:15:05: AAA/SG/SERVER_SELECT: Obtaining least loaded server.Jul 16 03:15:05: AAA/SG/SERVER_SELECT: [1] transactions remaining in batch. Reusing server.Jul 16 03:15:05: AAA/SG/SERVER_SELECT: Obtaining least loaded server.Jul 16 03:15:05: AAA/SG/SERVER_SELECT: No more transactions in batch. Obtaining a new server.Jul 16 03:15:05: AAA/SG/SERVER_SELECT: Obtaining a new least loaded server.Jul 16 03:15:05: AAA/SG/SERVER_SELECT: Server[0] load: 3Jul 16 03:15:05: AAA/SG/SERVER_SELECT: Server[1] load: 0Jul 16 03:15:05: AAA/SG/SERVER_SELECT: Server[2] load: 0Jul 16 03:15:05: AAA/SG/SERVER_SELECT: Selected Server[1] with load 0Jul 16 03:15:05: AAA/SG/SERVER_SELECT: [3] transactions remaining in batch.Jul 16 03:15:05: AAA/SG/SERVER_SELECT: Obtaining least loaded server.Jul 16 03:15:05: AAA/SG/SERVER_SELECT: [2] transactions remaining in batch. Reusing server.
The field descriptions are self-explanatory.
Related Commands
debug aaa test
To show when the idle timer or dead timer has expired, when test packets are sent, the server response status, and the server state for RADIUS server load balancing, use the debug aaa test command in privileged EXEC mode. To disable debugging output, use the no form of this command.
debug aaa test
no debug aaa test
Syntax Description
This command has no arguments or keywords.
Command Defaults
Debugging is not enabled.
Command Modes
Privileged EXEC
Command History
12.2(28)SB
This command was introduced.
12.4(11)T
This command was integrated into Cisco IOS Release 12.4(11)T.
Examples
In the following sample output, the RADIUS Server Load Balancing feature is enabled. The idle timer has expired.
Router# debug aaa testRouter#Jul 16 00:07:01: AAA/SG/TEST: Server (192.168.2.245:1700,1701) quarantined.Jul 16 00:07:01: AAA/SG/TEST: Sending test request(s) to server (192.168.2.245:1700,1701)Jul 16 00:07:01: AAA/SG/TEST: Sending 1 Access-Requests, 1 Accounting-Requests in current batch.Jul 16 00:07:01: AAA/SG/TEST(Req#: 1): Sending test AAA Access-Request.Jul 16 00:07:01: AAA/SG/TEST(Req#: 1): Sending test AAA Accounting-Request.Jul 16 00:07:01: AAA/SG/TEST: Obtained Test response from server (192.168.2.245:1700,1701)Jul 16 00:07:01: AAA/SG/TEST: Obtained Test response from server (192.168.2.245:1700,1701)Jul 16 00:07:01: AAA/SG/TEST: Necessary responses received from server (192.168.2.245:1700,1701)Jul 16 00:07:01: AAA/SG/TEST: Server (192.168.2.245:1700,1701) marked ALIVE. Idle timer set for 60 sec(s).Jul 16 00:07:01: AAA/SG/TEST: Server (192.168.2.245:1700,1701) removed from quarantine.Related Commands
debug acircuit
To display errors and events that occur on the attachment circuits (the circuits between the provider edge (PE) and customer edge (CE) routers), use the debug acircuit command in privileged EXEC mode. To disable debugging output, use the no form of this command.
debug acircuit {error | event}
no debug acircuit {error | event}
Syntax Description
error
Displays errors that occur in attachment circuits.
event
Displays events that occur in attachment circuits.
Command Modes
Privileged EXEC
Command History
Usage Guidelines
Use the debug acircuit command to identify provisioning events, setup failures, circuit up and down events, and configuration failures on attachment circuits.
An attachment circuit connects a PE router to a CE router. A router can have many attachment circuits. The attachment circuit manager controls all the attachment circuits from one central location. Therefore, when you enable the debug messages for the attachment circuit, you receive information about all the attachment circuits.
Examples
The following is sample output from the debug acircuit event command when you enable an interface:
Router# debug acircuit event*Jan 28 15:19:03.070: ACLIB: ac_cstate() Handling circuit UP for interface Se2/0*Jan 28 15:19:03.070: ACLIB [11.0.1.1, 200]: pthru_intf_handle_circuit_up() callingacmgr_circuit_up*Jan 28 15:19:03.070: ACLIB [11.0.1.1, 200]: Setting new AC state to Ac-Connecting*Jan 28 15:19:03.070: ACMGR: Receive <Circuit Up> msg*Jan 28 15:19:03.070: Se2/0 ACMGR: circuit up event, SIP state chg down to connecting,action is service request*Jan 28 15:19:03.070: Se2/0 ACMGR: Sent a sip service request*Jan 28 15:19:03.070: ACLIB [11.0.1.1, 200]: AC updating switch context.*Jan 28 15:19:03.070: Se2/0 ACMGR: Rcv SIP msg: resp connect forwarded, hdl 9500001D,l2ss_hdl 700001E*Jan 28 15:19:03.070: Se2/0 ACMGR: service connected event, SIP state chg connecting toconnected, action is respond forwarded*Jan 28 15:19:03.070: ACLIB: pthru_intf_response hdl is 9500001D, response is 1*Jan 28 15:19:03.070: ACLIB [11.0.1.1, 200]: Setting new AC state to Ac-ConnectedThe following is sample output from the debug acircuit event command when you disable an interface:
Router# debug acircuit event*Jan 28 15:25:57.014: ACLIB: SW AC interface INTF-DOWN for interface Se2/0*Jan 28 15:25:57.014: ACLIB [11.0.1.1, 200]: Setting new AC state to Ac-Idle*Jan 28 15:25:57.014: ACLIB: SW AC interface INTF-DOWN for interface Se2/0*Jan 28 15:25:57.014: Se2/0 ACMGR: Receive <Circuit Down> msg*Jan 28 15:25:57.014: Se2/0 ACMGR: circuit down event, SIP state chg connected to end,action is service disconnect*Jan 28 15:25:57.014: Se2/0 ACMGR: Sent a sip service disconnect*Jan 28 15:25:57.014: ACLIB [11.0.1.1, 200]: AC deleting switch context.*Jan 28 15:25:59.014: %LINK-5-CHANGED: Interface Serial2/0, changed state toadministratively down*Jan 28 15:25:59.014: ACLIB: ac_cstate() Handling circuit DOWN for interface Se2/0*Jan 28 15:26:00.014:%LINEPROTO-5-UPDOWN: Line protocol on Interface Serial2/0, changed state to downThe following example shows output from the debug acircuit command for an Xconnect session on an Ethernet interface:
Router# debug acircuit23:28:35: ACLIB [10.0.3.201, 5]: SW AC interface UP for Ethernet interface Et2/123:28:35: ACLIB [10.0.3.201, 5]: pthru_intf_handle_circuit_up() calling acmgr_circuit_up23:28:35: ACLIB [10.0.3.201, 5]: Setting new AC state to Ac-Connecting23:28:35: ACLIB [10.0.3.201, 5]: SW AC interface UP for Ethernet interface Et2/123:28:35: ACLIB [10.0.3.201, 5]: pthru_intf_handle_circuit_up() ignoring up event. Already connected or connecting.23:28:35: ACMGR: Receive <Circuit Up> msg23:28:35: Et2/1 ACMGR: circuit up event, SIP state chg down to connecting, action is service request23:28:35: Et2/1 ACMGR: Sent a sip service request23:28:37: %LINK-3-UPDOWN: Interface Ethernet2/1, changed state to up23:28:38: %LINEPROTO-5-UPDOWN: Line protocol on Interface Ethernet2/1, changed state to up23:28:53: Et2/1 ACMGR: Rcv SIP msg: resp connect forwarded, hdl D6000002, sss_hdl 9E00000F23:28:53: Et2/1 ACMGR: service connected event, SIP state chg connecting to connected, action is respond forwarded23:28:53: ACLIB: pthru_intf_response hdl is D6000002, response is 123:28:53: ACLIB [10.0.3.201, 5]: Setting new AC state to Ac-ConnectedThe command output is self-explanatory.
Related Commands
debug adjacency
To enable the display of information about the adjacency database, use the debug adjacency command in privileged EXEC mode. To disable the display of these events, use the no form of this command.
debug adjacency [epoch | ipc | state | table] [prefix] [interface] [connectionid id] [link {ipv4 | ipv6 | mpls}]
no debug adjacency [epoch | ipc | state | table] [prefix] [interface] [connectionid id] [link {ipv4 | ipv6 | mpls}]
Syntax Description
Defaults
Debugging events are not displayed.
Command Modes
Privileged EXEC
Command History
Usage Guidelines
You can use any combination of the prefix, interface, connectionid id, and link {ipv4 | ipv6 | mpls} keywords and arguments (in any order) as a filter to enable debugging for a specified subset of adjacencies.
Examples
The following example shows how to display information about the adjacency database:
Router# debug adjacency*Jan 27 06:22:50.543: ADJ-ios_mgr: repopulate adjs on up event for Ethernet3/0*Jan 27 06:22:50.543: ADJ: IPV6 adj out of Ethernet3/0, addr FE80::20C:CFFF:FEDF:6854 (incomplete) no src set: init/update from interface*Jan 27 06:22:50.543: ADJ: IPV6 adj out of Ethernet3/0, addr FE80::20C:CFFF:FEDF:6854 (incomplete) no src set: set bundle to IPv6 adjacency oce*Jan 27 06:22:50.543: ADJ: IPV6 adj out of Ethernet3/0, addr FE80::20C:CFFF:FEDF:6854 (incomplete) no src set: allocated, setup and inserted OK*Jan 27 06:22:50.543: ADJ: IPV6 adj out of Ethernet3/0, addr FE80::20C:CFFF:FEDF:6854 (incomplete) src IPv6 ND: source IPv6 ND added OK*Jan 27 06:22:50.543: ADJ: IPV6 adj out of Ethernet3/0, addr FE80::20C:CFFF:FEDF:6854 (incomplete) src IPv6 ND: computed macstring (len 14): OK*Jan 27 06:22:50.543: ADJ: IPV6 adj out of Ethernet3/0, addr FE80::20C:CFFF:FEDF:6854 src IPv6 ND: made complete (macstring len 0 to 14/0 octets)00:04:40: %LINK-3-UPDOWN: Interface Ethernet3/0, changed state to up00:04:41: %LINEPROTO-5-UPDOWN: Line protocol on Interface Ethernet3/0, changedRelated Commands
debug alarm-interface
To show real-time activities in the data channel or the management channel of the Alarm Interface Controller (AIC), use the debug alarm-interface command in privileged EXEC mode. To disable debugging output, use the no form of this command.
debug alarm-interface slot-number {data | management}
no debug alarm-interface slot-number {data | management}
Syntax Description
Defaults
No default behavior or values
Command Modes
Privileged EXEC
Command History
12.2(2)XG
This command was introduced for the Cisco 2600 series and the Cisco 3600 series.
12.2(8)T
This command was integrated into Cisco IOS Release 12.2(8)T.
Usage Guidelines
This command allows you to observe the management channel activity from the AIC in the specified slot. Such activity shows that the software running on the AIC CPU has reached a minimum level of working order.
Examples
The following is sample output from the debug alarm-interface command:
Router# debug alarm-interfaceAIC Slot 1:STATUS receivedThe following is sample output from the debug alarm-interface 1 data command:
Router# debug alarm-interface 1 dataAIC Slot 1:STATUS receivedaic_fastsend:particle count=1, len=1504aic_pak_to_txring:scattered particle count=1, tx bytes=1504, leftover=0aic_interrupt:# 30419 gstar=0x1000000aic_safe_start:particle count=1, len=524aic_pak_to_txring:scattered particle count=1, tx bytes=524, leftover=0aic_process_TXivq:ivq - 0x42040000 at 15, slice 1aic_interrupt:# 30420 gstar=0x1000000aic_process_TXivq:ivq - 0x42040000 at 16, slice 1aic_interrupt:# 30421 gstar=0x10000000aic_scc_rx_intr:sts_dlen=0xC5E10000, len=1504, RSTA=0xA0aic_serial_RX_interrupt:rxtype=1, len=1504, aic_scc_rx_intr:last_rxbd has aged, 2aic_process_RXivq:ivq - 0x60000 at 13, slice 1aic_interrupt:# 30422 gstar=0x10000000aic_scc_rx_intr:sts_dlen=0xC20D0000, len=524, RSTA=0xA0aic_serial_RX_interrupt:rxtype=1, len=524, aic_process_RXivq:ivq - 0x60000 at 14,slice 1aic_interrupt:# 30423 gstar=0x20000000aic_scc_rx_intr:sts_dlen=0xC00D0000, len=12, RSTA=0xA0aic_mgmt_RX_interrupt:len=12aic_mgmt_fastsend:particle count=1, len=20 / 20aic_pak_to_txring:scattered particle count=1, tx bytes=20, leftover=0aic_scc_rx_intr:last_rxbd has aged, 2aic_process_RXivq:ivq - 0x10060000 at 37, slice 1aic_interrupt:# 30424 gstar=0x2000000aic_process_TXivq:ivq - 0x52040000 at 24, slice 1Related Commands
alarm-interface
Enters the alarm interface mode and configures the AIC.
reset
Resets the AIC CPU.
debug alps ascu
To enable debugging for airline product set (ALPS) agent set control units (ASCUs) use the debug alps ascu command in privileged EXEC mode. To disable debugging output, use the no form of this command.
debug alps ascu {event | packet | detail | all | format {ipars | router | both}} [interface [ascu id]]
no debug alps ascu {event | packet | detail | all | format {ipars | router | both}} [interface [ascu id]]
Syntax Description
Defaults
Debugging is off.
Command Modes
Privileged EXEC
Command History
Usage Guidelines
To enable debugging for a group of ASCUs, enter a separate command for each ASCU interface and IA combination.
The interface option applies only to the event, packet, detail, and all keywords.
Note
Examples
The following output is from the debug alps ascu event command, showing events or protocol errors in router format for ASCU 42 on interface Serial7:
Router# debug alps ascu format routerRouter# debug alps ascu event Serial7 42ALPS ASCU: T1 expired for ascu 42 on i/f Serial7ALPS ASCU: DOWN event while UP for ascu 42 on i/f Serial7 : C1 count = 1
Note
The following output is from the debug alps ascu event command, showing events or protocol errors in ipars format for ASCU 42 on interface Serial7:
Router# debug alps ascu format iparsRouter# debug alps ascu event Serial7 42ALPS ASCU: T1 expired for ascu 42/2F on i/f Serial7ALPS ASCU: DOWN event while UP for ascu 42/2F on i/f Serial7 : C1 count = 1The following output is from the debug alps ascu detail command, showing all protocol events in router format for ASCU 42 on interface Serial6:
Router# debug alps ascu format routerRouter# debug alps ascu detail Serial6 42ALPS ASCU: Tx ALC POLL MSG (+ 0 pad bytes) to ascu 42 on i/f Serial6ALPS ASCU: ALC GO AHD MSG rcvd from ascu 42 on i/f Serial6ALPS ASCU: Tx ALC POLL MSG (+ 0 pad bytes) to ascu 42 on i/f Serial6ALPS ASCU: ALC GO AHD MSG rcvd from ascu 42 on i/f Serial6ALPS ASCU: Tx ALC POLL MSG (+ 0 pad bytes) to ascu 42 on i/f Serial6ALPS ASCU: Rx ALC DATA MSG (14 bytes + CCC) from ascu 42 on i/f Serial6, fwd to cktRTP_MATIPALPS ASCU: ALC GO AHD MSG rcvd from ascu 42 on i/f Serial6ALPS ASCU: Tx ALC DATA MSG (14 bytes + CCC + 0 pad bytes) to ascu 42 on i/f Serial6ALPS ASCU: Tx ALC POLL MSG (3 bytes + CCC + 0 pad bytes) to ascu 42 on i/f Serial6
Note
The following output is from the debug alps ascu detail command, showing all protocol events in both format for ASCU 42 on interface Serial6:
Router# debug alps ascu format bothRouter# debug alps ascu detail Serial6 42ALPS ASCU: Tx ALC POLL MSG (+ 0 pad bytes) to ascu 42/2F on i/f Serial6ALPS ASCU: ALC GO AHD MSG rcvd from ascu 42/2F on i/f Serial6ALPS ASCU: Tx ALC POLL MSG (+ 0 pad bytes) to ascu 42/2F on i/f Serial6ALPS ASCU: ALC GO AHD MSG rcvd from ascu 42/2F on i/f Serial6ALPS ASCU: Tx ALC POLL MSG (+ 0 pad bytes) to ascu 42/2F on i/f Serial6ALPS ASCU: Rx ALC DATA MSG (14 bytes + CCC) from ascu 42/2F on i/f Serial6, fwd to cktRTP_MATIPALPS ASCU: ALC GO AHD MSG rcvd from ascu 42/2F on i/f Serial6ALPS ASCU: Tx ALC DATA MSG (14 bytes + CCC + 0 pad bytes) to ascu 42/2F on i/f Serial6ALPS ASCU: Tx ALC POLL MSG (3 bytes + CCC + 0 pad bytes) to ascu 42/2F on i/f Serial6The following output is from the debug alps ascu packet command, showing all packets sent or received in router format for ASCU 42 on interface Serial6:
Router# debug alps ascu packet format router Serial6 42ALPS ASCU: Tx ALC SERVICE MSG (18 bytes + CCC + 0 pad bytes) to ascu 42 on i/f Serial602321D26 0C261616140C0D18 26163135 0611C6ALPS ASCU: Rx ALC DATA MSG (14 bytes + CCC) from ascu 42 on i/f Serial6, fwd cktRTP_MATIP42607866 6571786665717966 755124ALPS ASCU: Tx ALC DATA MSG (14 bytes + CCC + 0 pad bytes) to ascu 42 on i/f Serial6022038 2625313826253139 263511E4The following output is from the debug alps ascu packet command, showing all packets sent or received in ipars format for ASCU 42 on interface Serial6:
Router# debug alps ascu packet format ipars Serial6 42ALPS ASCU: Tx ALC SERVICE MSG (18 bytes + CCC + 0 pad bytes) to ascu 42/2F on i/f Serial6ALPS IPARS Format:2F2C1126 3326252535331339 26251C14 271DC6ALPS ASCU: Rx ALC DATA MSG (14 bytes + CCC) from ascu 42/2F on i/f Serial6, fwd cktRTP_MATIPALPS IPARS Format:2F3E3826 161C3826161C1826 141D24ALPS ASCU: Tx ALC DATA MSG (14 bytes + CCC + 0 pad bytes) to ascu 42/2F on i/f Serial6ALPS IPARS Format:2F3E38 26161C3826161C18 26141DE4The following output is from the debug alps ascu packet command, showing all packets sent or received in both formats for ASCU 42 on interface Serial6:
Router# debug alps ascu packet format both Serial6 42ALPS ASCU: Tx ALC SERVICE MSG (18 bytes + CCC + 0 pad bytes) to ascu 42/2F on i/f Serial6ALPS Router Format:02321D26 0C261616140C0D18 26163135 0611C6ALPS IPARS Format:2F2C1126 3326252535331339 26251C14 271DC6ALPS ASCU: Rx ALC DATA MSG (14 bytes + CCC) from ascu 42/2F on i/f Serial6, fwd cktRTP_MATIPALPS Router Format:42607866 6571786665717966 755124ALPS IPARS Format:2F3E3826 161C3826161C1826 141D24ALPS ASCU: Tx ALC DATA MSG (14 bytes + CCC + 0 pad bytes) to ascu 42/2F on i/f Serial6ALPS Router Format:022038 2625313826253139 263511E4ALPS IPARS Format:2F3E38 26161C3826161C18 26141DE4debug alps circuit event
To enable event debugging for airline product set (ALPS) circuits, use the debug alps circuit event command in privileged EXEC mode. To disable debugging output, use the no form of this command.
debug alps circuit event [name]
no debug alps circuit event [name]
Syntax Description
name
(Optional) Name given to identify an ALPS circuit on the remote customer premises equipment (CPE).
Defaults
If no circuit name is specified, then debugging is enabled for every ALPS circuit.
Command Modes
Privileged EXEC
Command History
Usage Guidelines
To enable debugging for a single ALPS circuit, specify the name of the circuit.
To enable debugging for a group of circuits, enter a separate command for each circuit name.
Examples
The following is sample output from the debug alps circuit event command for circuit RTP_AX25:
alps-rcpe# debug alps circuit event RTP_AX25ALPS P1024 CKT: FSM - Ckt= RTP_AX25, State= OPEN, Event= DISABLE:(CloseAndDisable)->DISCALPS P1024 CKT: FSM - Ckt= RTP_AX25, State= DISC, Event= ENABLE:(TmrStartNullRetry)->INOPALPS P1024 CKT: Ckt= RTP_AX25, Open - peer set to 200.100.40.2ALPS P1024 CKT: Ckt= RTP_AX25, Open - peer open.ALPS P1024 CKT: FSM - Ckt= RTP_AX25, State= INOP, Event= RETRY_TIMEOUT:(Open)->OPNGALPS P1024 CKT: FSM - Ckt= RTP_AX25, State= OPNG, Event= CKT_OPEN_CFM:(CacheAndFwdAscuData)->OPENalps-ccpe# debug alps circuit event RTP_AX25ALPS AX.25 FSM: Ckt= RTP_AX25, State= OPEN, Event= CktClose, Rsn= 12:(PvcKill,CktRemove,TmrStartClose)->INOPALPS AX.25 FSM: Ckt= RTP_AX25, State= INOP, Event= X25PvcInact, Rsn= 0:(-,-,-)->INOPALPS AX.25 FSM: Ckt= RTP_AX25, State= INOP, Event= X25VcDeleted, Rsn= 0:(-,CktDestroy,TmrStop)->INOPALPS AX.25 FSM: Ckt= RTP_AX25, State= INOP, Event= CktOpReq, Rsn= 4:(PvcMake,CktAdd,TmrStartOpen)->OPNGALPS AX.25 FSM: Ckt= RTP_AX25, State= OPNG, Event= X25ResetTx, Rsn= 0:(-,-,-)->OPNGALPS AX.25 FSM: Ckt= RTP_AX25, State= OPNG, Event= X25VcUp, Rsn= 0:(-,OpnCfm,TmrStop)->OPENdebug alps peer
To enable event or packet debugging for airline product set (ALPS) peers, use the debug alps peer command in privileged EXEC mode. To disable debugging output, use the no form of this command.
debug alps peer {event | packet} [ip-address]
no debug alps peer {event | packet} [ip-address]
Syntax Description
event
Specifies debugging for an event.
packet
Specifies debugging for a packet.
ip-address
(Optional) Remote peer IP address.
Defaults
If no IP address is specified, then debugging is enabled for every peer connection.
Command Modes
Privileged EXEC
Command History
Usage Guidelines
To enable debugging for a single remote ALPS peer, specify the peer IP address.
To enable debugging for a set of remote peers, enter the command for each peer IP address.
Examples
The following is sample output from the debug alps peer packet command:
Router# debug alps peer packetALPS PEER:Peer (10.227.50.106, MATIP_A_CKT-1) - TX Peer Data Msg (18 bytes)040A5320: 01 00001241040A5330:45546B5F 6F4F7757 67477B5B 51ALPS PEER:Peer (10.227.50.106, MATIP_A_CKT-1) - RX Peer Data Msg (18 bytes)04000550: 01000012 4145546B 5F6F4F7704000560:5767477B 5B51ALPS PEER:Peer (10.227.50.106, MATIP_A_CKT-1) - TX Peer Data Msg (18 bytes)0409F6E0: 01 00001241 45546B5F0409F6F0:6F4F7757 67477B5B 51ALPS PEER:Peer (10.227.50.106, MATIP_A_CKT-1) - RX Peer Data Msg (18 bytes)04000680: 01000012 4145546B04000690:5F6F4F77 5767477B 5B51debug alps peer event
To enable event debugging for airline product set (ALPS) peers, use the debug alps peer event command in privileged EXEC mode. To disable debugging output, use the no form of this command.
debug alps peer event ipaddr
no debug alps peer event ipaddr
Syntax Description
Defaults
If no IP address is specified, debugging is enabled for every peer connection.
Command Modes
Privileged EXEC
Command History
Usage Guidelines
To enable debugging for a single remote ALPS peer, specify the peer IP address.
To enable debugging for a set of remote peers, enter the command for each peer IP address.
Examples
The following is sample output from the debug alps peer event command:
Router# debug alps peer eventALPS PEER: FSM - Peer 200.100.25.2, Event ALPS_CLOSED_IND, State OPENEDALPS PEER: peer 200.100.25.2 closed - closing peer circuits.ALPS PEER: Promiscuous peer created for 200.100.25.2ALPS PEER: TCP Listen - passive open 200.100.25.2(11003) -> 10000ALPS PEER: FSM - Peer 200.100.25.2, Event ALPS_OPEN_IND, State DISCONNALPS PEER: peer 200.100.25.2 opened OK.debug alps snmp
To enable debugging for airline product set (ALPS) Simple Network Management Protocol (SNMP) agents, use the debug alps snmp command in privileged EXEC mode. To disable debugging output, use the no form of this command.
debug alps snmp
no debug alps snmp
Syntax Description
This command has no arguments or keywords.
Defaults
Debugging for SNMP agents is not enabled.
Command Modes
Privileged EXEC
Command History
Examples
The following output is from the debug alps snmp command. The first line shows a circuit event status change. The second line shows an ASCU status change. The third line shows a peer connection status change.
Router# debug alps snmpALPS CktStatusChange Notification for circuit CKT-1ALPS AscuStatusChange Notification for ascu (Serial3, 41)PeerConnStatusChange Notification for peer (10.227.50.106, MATIP_A_CKT-1)The following output shows that an open failure has occurred on circuit 1:
ALPS CktOpenFailure Notification for circuit CKT1The following output shows that a partial rejection to an ALPS circuit peer open request has occurred on circuit 1:
ALPS CktPartialReject Notification for ascu (Serial2, 41) on circuit CKT1debug appfw
To display debug messages about Cisco IOS Firewall events, use the debug appfw command in privileged EXEC mode. To disable debugging output, use the no form of this command.
debug appfw {application protocol | function-trace | object-creation | object-deletion | events | timers | detailed}
no debug appfw {application protocol | function-trace | object-creation | object-deletion | events | timers | detailed}
Syntax Description
Command Modes
Privileged EXEC
Command History
Examples
The following sample configuration shows how to configure an HTTP policy with application firewall debugging enabled:
Router(config)# appfw policy-name myPolicyAPPFW FUNC:appfw_policy_findAPPFW FUNC:appfw_policy_find -- Policy myPolicy is not foundAPPFW FUNC:appfw_policy_allocAPPFW FUNC:appfw_policy_alloc -- policy_alloc 0x65727278APPFW FUNC:appfw_policy_alloc -- Policy 0x65727278 is set to validAPPFW FUNC:appfw_policy_alloc -- Policy myPolicy has been createdAPPFW FUNC:appfw_policy_command -- memlock policy 0x65727278! Debugging sample for application (HTTP) creationRouter(cfg-appfw-policy)# application httpAPPFW FUNC:appfw_http_commandAPPFW FUNC:appfw_http_appl_findAPPFW FUNC:appfw_http_appl_find -- Application not foundAPPFW FUNC:appfw_http_appl_allocAPPFW FUNC:appfw_http_appl_alloc -- appl_http 0x64D7A25CAPPFW FUNC:appfw_http_appl_alloc -- Application HTTP parser structure 64D7A25C created! Debugging sample for HTTP-specific application inspectionRouter(cfg-appfw-policy-http)#Router(cfg-appfw-policy-http)# strict-http action reset alarmAPPFW FUNC:appfw_http_subcommandAPPFW FUNC:appfw_http_subcommand -- strict-http cmd turned onRouter# debug appfw detailedAPPFW Detailed Debug debugging is onfw7-7206a#debug appfw object-creationAPPFW Object Creations debugging is onfw7-7206a#debug appfw object-deletionAPPFW Object Deletions debugging is ondebug apple arp
To enable debugging of the AppleTalk Address Resolution Protocol (AARP), use the debug apple arp command in privileged EXEC mode. To disable debugging output, use the no form of this command.
debug apple arp [type number]
no debug apple arp [type number]
Syntax Description
Command Modes
Privileged EXEC
Usage Guidelines
This command is helpful when you experience problems communicating with a node on the network you control (a neighbor). If the debug apple arp display indicates that the router is receiving AARP probes, you can assume that the problem does not reside at the physical layer.
Examples
The following is sample output from the debug apple arp command:
Router# debug apple arpEther0: AARP: Sent resolve for 4160.26Ether0: AARP: Reply from 4160.26(0000.0c00.0453) for 4160.154(0000.0c00.8ea9)Ether0: AARP: Resolved waiting request for 4160.26(0000.0c00.0453)Ether0: AARP: Reply from 4160.19(0000.0c00.0082) for 4160.154(0000.0c00.8ea9)Ether0: AARP: Resolved waiting request for 4160.19(0000.0c00.0082)Ether0: AARP: Reply from 4160.19(0000.0c00.0082) for 4160.154(0000.0c00.8ea9)Explanations for representative lines of output follow.
The following line indicates that the router has requested the hardware MAC address of the host at network address 4160.26:
Ether0: AARP: Sent resolve for 4160.26The following line indicates that the host at network address 4160.26 has replied, giving its MAC address (0000.0c00.0453). For completeness, the message also shows the network address to which the reply was sent and its hardware MAC address (also in parentheses).
Ether0: AARP: Reply from 4160.26(0000.0c00.0453) for 4160.154(0000.0c00.8ea9)The following line indicates that the MAC address request is complete:
Ether0: AARP: Resolved waiting request for 4160.26(0000.0c00.0453)debug apple domain
To enable debugging of the AppleTalk domain activities, use the debug apple domain command in privileged EXEC mode. To disable debugging output, use the no form of this command.
debug apple domain
no debug apple domain
Syntax Description
This command has no arguments or keywords.
Command Modes
Privileged EXEC
Usage Guidelines
Use the debug apple domain command to observe activity for domains and subdomains. Use this command in conjunction with the debug apple remap command to observe interaction between remapping and domain activity. Messages are displayed when the state of a domain changes, such as creating a new domain, deleting a domain, and updating a domain.
Examples
The following is sample output from the debug apple domain command intermixed with output from the debug apple remap command; the two commands show related events:
Router# debug apple domainRouter# debug apple remapAT-REMAP: RemapProcess for net 30000 domain AURP Domain 1AT-REMAP: ReshuffleRemapList for subdomain 1AT-REMAP: Could not find a remap for cable 3000-3001AT-DOMAIN: atdomain_DisablePort for Tunnel0AT-DOMAIN: CleanUpDomain for domain 1 [AURP Domain 1]AT-DOMAIN: Disabling interface Ethernet1AT-DOMAIN: atdomain_DisablePort for Ethernet1AT-DOMAIN: CleanUpDomain for domain 1 [AURP Domain 1]AT-DOMAIN: CleanSubDomain for inbound subdomain 1AT-REMAP: Remap for net 70 inbound subdomain 1 has been deletedAT-DOMAIN: DeleteAvRemapList for inbound subdomain 1AT-DOMAIN: DeleteRemapTable for subdomain 1AT-DOMAIN: DeleteAvRemapList for inbound subdomain 1AT-DOMAIN: CleanSubDomain for outbound subdomain 1AT-DOMAIN: DeleteRemapTable for subdomain 1AT-REMAP: RemapProcess for net 30000 domain AURP Domain 1 Remapped Net 10000AT-REMAP: Remap for net 50 outbound subdomain 1 has been deletedAT-DOMAIN: DeleteAvRemapList for outbound subdomain 1AT-DOMAIN: DeleteAvRemapList for outbound subdomain 1AT-DOMAIN: CleanUpDomain for domain 1 [AURP Domain 1]AT-DOMAIN: CleanSubDomain for inbound subdomain 1AT-DOMAIN: DeleteRemapTable for subdomain 1AT-DOMAIN: DeleteAvRemapList for inbound subdomain 1AT-DOMAIN: CleanSubDomain for outbound subdomain 1AT-DOMAIN: DeleteRemapTable for subdomain 1AT-DOMAIN: DeleteAvRemapList for outbound subdomain 1Related Commands
debug apple errors
To display errors occurring in the AppleTalk network, use the debug apple errors command in privileged EXEC mode. To disable debugging output, use the no form of this command.
debug apple errors [type number]
no debug apple errors [type number]
Syntax Description
Command Modes
Privileged EXEC
Usage Guidelines
In a stable AppleTalk network, the debug apple errors command produces little output.
To solve encapsulation problems, enable debug apple errors and debug apple packet together.
Examples
The following is sample output from the debug apple errors command when a router is brought up with a zone that does not agree with the zone list of other routers on the network:
Router# debug apple errors%AT-3-ZONEDISAGREES: Ethernet0: AppleTalk port disabled; zone list incompatible with 4160.19%AT-3-ZONEDISAGREES: Ethernet0: AppleTalk port disabled; zone list incompatible with 4160.19%AT-3-ZONEDISAGREES: Ethernet0: AppleTalk port disabled; zone list incompatible with 4160.19As the output suggests, a single error message indicates zone list incompatibility; this message is sent out periodically until the condition is corrected or the debug apple errors command is turned off.
Most of the other messages that the debug apple errors command can generate are obscure or indicate a serious problem with the AppleTalk network. Some of these other messages follow.
In the following message, RTMPRsp, RTMPReq, ATP, AEP, ZIP, ADSP, or SNMP could replace NBP, and "llap dest not for us" could replace "wrong encapsulation":
Packet discarded, src 4160.12-254,dst 4160.19-254,NBP,wrong encapsulationIn the following message, in addition to an invalid echo packet error, other possible errors are unsolicited AEP echo reply, unknown echo function, invalid ping packet, unknown ping function, and bad responder packet type:
Ethernet0: AppleTalk packet error; no source address availableAT: pak_reply: dubious reply creation, dst 4160.19AT: Unable to get a buffer for reply to 4160.19Processing error, src 4160.12-254,dst 4160.19-254,AEP, invalid echo packetThe debug apple errors command can print out additional messages when other debugging commands are also turned on. When you turn on both the debug apple errors and debug apple events commands, the following message can be generated:
Proc err, src 4160.12-254,dst 4160.19-254,ZIP,NetInfo Reply format is invalidIn the preceding message, in addition to the NetInfo Reply format is invalid error, other possible errors are NetInfoReply not for me, NetInfoReply ignored, NetInfoReply for operational net ignored, NetInfoReply from invalid port, unexpected NetInfoReply ignored, cannot establish primary zone, no primary has been set up, primary zone invalid, net information mismatch, multicast mismatch, and zones disagree.
When you turn on both the debug apple errors and debug apple nbp commands, the following message can be generated:
Processing error,...,NBP,NBP name invalidIn the preceding message, in addition to the NBP name invalid error, other possible errors are NBP type invalid, NBP zone invalid, not operational, error handling brrq, error handling proxy, NBP fwdreq unexpected, No route to srcnet, Proxy to "*" zone, Zone "*" from extended net, No zone info for "*", and NBP zone unknown.
When you turn on both the debug apple errors and debug apple routing commands, the following message can be generated:
Processing error,...,RTMPReq, unknown RTMP requestIn the preceding message, in addition to an unknown RTMP request error, other possible errors are RTMP packet header bad, RTMP cable mismatch, routed RTMP data, RTMP bad tuple, and Not Req or Rsp.
debug apple events
To display information about AppleTalk special events, neighbors becoming reachable or unreachable, and interfaces going up or down, use the debug apple events command in privileged EXEC mode. To disable debugging output, use the no form of this command.
debug apple events [type number]
no debug apple events [type number]
Syntax Description
Command Modes
Privileged EXEC
Usage Guidelines
Only significant events (for example, neighbor and route changes) are logged.
The debug apple events command is useful for solving AppleTalk network problems because it provides an overall picture of the stability of the network. In a stable network, the debug apple events command does not return any information. If the command generates numerous messages, those messages can indicate possible sources of the problems.
When configuring or making changes to a router or interface for AppleTalk, enable the debug apple events command to alert you to the progress of the changes or to any errors that might result. Also use this command periodically when you suspect network problems.
The debug apple events command is also useful to determine whether network flapping (nodes toggling online and offline) is occurring. If flapping is excessive, look for routers that only support 254 networks.
When you enable the debug apple events command, you will see any messages that the apple event-logging configuration command normally displays. Turning on the debug apple events command, however, does not cause the apple event-logging command to be maintained in nonvolatile memory. Only turning on the apple event-logging command explicitly stores it in nonvolatile memory. Furthermore, if the apple event-logging command is already enabled, turning on or off the debug apple events command does not affect the apple event-logging command.
Examples
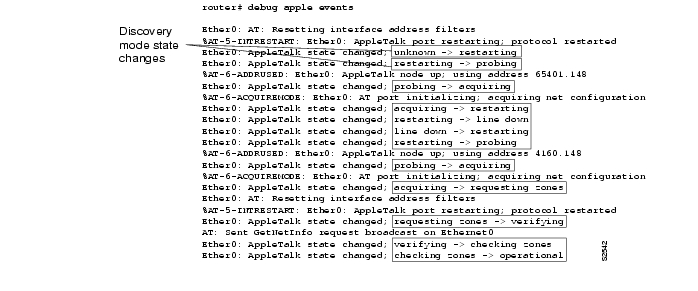
The following is sample output from the debug apple events command that describes a nonseed router coming up in discovery mode:
As the output shows, the debug apple events command is useful in tracking the discovery mode state changes through which an interface progresses. When no problems are encountered, the state changes progress as follows:
1.
2.
3.
4.
5.
6.
7.
8.
Explanations for individual lines of output follow.
The following message indicates that a port is set. In this case, the zone multicast address is being reset.
Ether0: AT: Resetting interface address filtersThe following messages indicate that the router is changing to restarting mode:
%AT-5-INTRESTART: Ether0: AppleTalk port restarting; protocol restartedEther0: AppleTalk state changed; unknown -> restartingThe following message indicates that the router is probing in the startup range of network numbers (65280 to 65534) to discover its network number:
Ether0: AppleTalk state changed; restarting -> probingThe following message indicates that the router is enabled as a nonrouting node using a provisional network number within its startup range of network numbers. This type of message only appears if the network address the router will use differs from its configured address. This is always the case for a discovery-enabled router; it is rarely the case for a nondiscovery-enabled router.
%AT-6-ADDRUSED: Ether0: AppleTalk node up; using address 65401.148The following messages indicate that the router is sending out GetNetInfo requests to discover the default zone name and the actual network number range in which its network number can be chosen:
Ether0: AppleTalk state changed; probing -> acquiring%AT-6-ACQUIREMODE: Ether0: AT port initializing; acquiring net configurationNow that the router has acquired the cable configuration information, the following message indicates that it restarts using that information:
Ether0: AppleTalk state changed; acquiring -> restartingThe following messages indicate that the router is probing for its actual network address:
Ether0: AppleTalk state changed; restarting -> line downEther0: AppleTalk state changed; line down -> restartingEther0: AppleTalk state changed; restarting -> probingThe following message indicates that the router has found an actual network address to use:
%AT-6-ADDRUSED: Ether0: AppleTalk node up; using address 4160.148The following messages indicate that the router is sending out GetNetInfo requests to verify the default zone name and the actual network number range from which its network number can be chosen:
Ether0: AppleTalk state changed; probing -> acquiring%AT-6-ACQUIREMODE: Ether0: AT port initializing; acquiring net configurationThe following message indicates that the router is requesting the list of zones for its cable:
Ether0: AppleTalk state changed; acquiring -> requesting zonesThe following messages indicate that the router is sending out GetNetInfo requests to make sure its understanding of the configuration is correct:
Ether0: AppleTalk state changed; requesting zones -> verifyingAT: Sent GetNetInfo request broadcast on Ethernet0The following message indicates that the router is rechecking its list of zones for its cable:
Ether0: AppleTalk state changed; verifying -> checking zonesThe following message indicates that the router is now fully operational as a routing node and can begin routing:
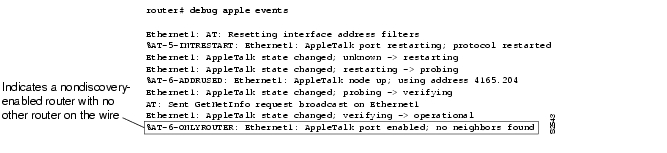
Ether0: AppleTalk state changed; checking zones -> operationalThe following shows sample debug apple events output that describes a nondiscovery-enabled router coming up when no other router is on the wire.
As the output shows, a nondiscovery-enabled router can come up when no other router is on the wire; however, it must assume that its configuration (if accurate syntactically) is correct, because no other router can verify it. Notice that the last line indicates this situation.
The following is sample output from the debug apple events command that describes a discovery-enabled router coming up when there is no seed router on the wire:
Router# debug apple eventsEther0: AT: Resetting interface address filters%AT-5-INTRESTART: Ether0: AppleTalk port restarting; protocol restartedEther0: AppleTalk state changed; unknown -> restartingEther0: AppleTalk state changed; restarting -> probing%AT-6-ADDRUSED: Ether0: AppleTalk node up; using address 65401.148Ether0: AppleTalk state changed; probing -> acquiringAT: Sent GetNetInfo request broadcast on Ether0AT: Sent GetNetInfo request broadcast on Ether0AT: Sent GetNetInfo request broadcast on Ether0AT: Sent GetNetInfo request broadcast on Ether0AT: Sent GetNetInfo request broadcast on Ether0As the output shows, when you attempt to bring up a nonseed router without a seed router on the wire, it never becomes operational; instead, it hangs in the acquiring mode and continues to send out periodic GetNetInfo requests.
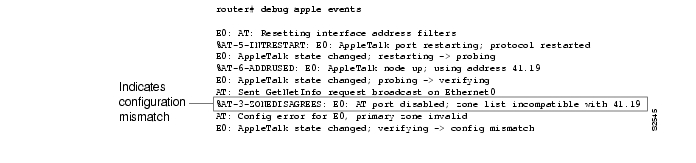
The following is sample output from the debug apple events command when a nondiscovery-enabled router is brought up on an AppleTalk internetwork that is in compatibility mode (set up to accommodate extended as well as nonextended AppleTalk) and the router has violated internetwork compatibility:
The following three configuration command lines indicate the part of the configuration of the router that caused the configuration mismatch:
lestat(config)# interface ethernet 0lestat(config-if)# apple cab 41-41lestat(config-if)# apple zone MarketingThe router shown had been configured with a cable range of 41-41 instead of 40-40, which would have been accurate. Additionally, the zone name was configured incorrectly; it should have been "Marketing," rather than being misspelled as "Markting."
debug apple nbp
To display debugging output from the Name Binding Protocol (NBP) routines, use the debug apple nbp command in privileged EXEC mode. To disable debugging output, use the no form of this command.
debug apple nbp [type number]
no debug apple nbp [type number]
Syntax Description
Command Modes
Privileged EXEC
Usage Guidelines
To determine whether the router is receiving NBP lookups from a node on the AppleTalk network, enable debug apple nbp at each node between the router and the node in question to determine where the problem lies.
Caution
Examples
The following is sample output from the debug apple nbp command:
Router# debug apple nbpAT: NBP ctrl = LkUp, ntuples = 1, id = 77AT: 4160.19, skt 2, enum 0, name: =:ciscoRouter@Low End SW LabAT: LkUp =:ciscoRouter@Low End SW LabAT: NBP ctrl = LkUp-Reply, ntuples = 1, id = 77AT: 4160.154, skt 254, enum 1, name: lestat.Ether0:ciscoRouter@Low End SW LabAT: NBP ctrl = LkUp, ntuples = 1, id = 78AT: 4160.19, skt 2, enum 0, name: =:IPADDRESS@Low End SW LabAT: NBP ctrl = LkUp, ntuples = 1, id = 79AT: 4160.19, skt 2, enum 0, name: =:IPGATEWAY@Low End SW LabAT: NBP ctrl = LkUp, ntuples = 1, id = 83AT: 4160.19, skt 2, enum 0, name: =:ciscoRouter@Low End SW LabAT: LkUp =:ciscoRouter@Low End SW LabAT: NBP ctrl = LkUp, ntuples = 1, id = 84AT: 4160.19, skt 2, enum 0, name: =:IPADDRESS@Low End SW LabAT: NBP ctrl = LkUp, ntuples = 1, id = 85AT: 4160.19, skt 2, enum 0, name: =:IPGATEWAY@Low End SW LabAT: NBP ctrl = LkUp, ntuples = 1, id = 85AT: 4160.19, skt 2, enum 0, name: =:IPGATEWAY@Low End SW LabThe first three lines describe an NBP lookup request:
AT: NBP ctrl = LkUp, ntuples = 1, id = 77AT: 4160.19, skt 2, enum 0, name: =:ciscoRouter@Low End SW LabAT: LkUp =:ciscoRouter@Low End SW LabTable 4 describes the fields in the first line of output.
Table 5 describes the fields in the second line of output.
The third line in the output essentially reiterates the information in the two lines above it, indicating that a lookup request has been made regarding name-address pairs for all objects of the ciscoRouter type in the Low End SW Lab zone.
Because the router is defined as an object of type ciscoRouter in zone Low End SW Lab, the router sends an NBP lookup reply in response to this NBP lookup request. The following two lines of output show the response of the router:
AT: NBP ctrl = LkUp-Reply, ntuples = 1, id = 77AT: 4160.154, skt 254, enum 1, name: lestat.Ether0:ciscoRouter@Low End SW LabIn the first line, ctrl = LkUp-Reply identifies this NBP packet as an NBP lookup request. The same value in the id field (id = 77) associates this lookup reply with the previous lookup request. The second line indicates that the network address associated with the entity name of the router (lestat.Ether0:ciscoRouter@Low End SW Lab) is 4160.154. The fact that no other entity name/network address is listed indicates that the responder only knows about itself as an object of type ciscoRouter in zone Low End SW Lab.
debug apple packet
To display per-packet debugging output, use the debug apple packet command in privileged EXEC mode. To disable debugging output, use the no form of this command.
debug apple packet [type number]
no debug apple packet [type number]
Syntax Description
Command Modes
Privileged EXEC
Usage Guidelines
With this command, you can monitor the types of packets being slow switched. It displays at least one line of debugging output per AppleTalk packet processed.
The output reports information online when a packet is received or a transmission is attempted.
When invoked in conjunction with the debug apple routing, debug apple zip, and debug apple nbp commands, the debug apple packet command adds protocol processing information in addition to generic packet details. It also reports successful completion or failure information.
When invoked in conjunction with the debug apple errors command, the debug apple packet command reports packet-level problems, such as those concerning encapsulation.
Caution
Examples
The following is sample output from the debug apple packet command:
Router# debug apple packetEther0: AppleTalk packet: enctype SNAP, size 60, encaps000000000000000000000000AT: src=Ethernet0:4160.47, dst=4160-4160, size=10, 2 rtes, RTMP pkt sentAT: ZIP Extended reply rcvd from 4160.19AT: ZIP Extended reply rcvd from 4160.19AT: src=Ethernet0:4160.47, dst=4160-4160, size=10, 2 rtes, RTMP pkt sentEther0: AppleTalk packet: enctype SNAP, size 60, encaps000000000000000000000000Ether0: AppleTalk packet: enctype SNAP, size 60, encaps000000000000000000000000Table 6 describes the fields in the first line of output.
Table 7 describes the fields in the second line of output.
The third line indicates the type of packet received and its source AppleTalk address. This message is repeated in the fourth line because AppleTalk hosts can send multiple replies to a given GetNetInfo request.
debug apple remap
To enable debugging of the AppleTalk remap activities, use the debug apple remap command in privileged EXEC mode. To disable debugging output, use the no form of this command.
debug apple remap
no debug apple remap
Syntax Description
This command has no arguments or keywords.
Command Modes
Privileged EXEC
Usage Guidelines
Use the debug apple remap command with the debug apple domain command to observe activity between domains and subdomains. Messages from the debug apple remap command are displayed when a particular remapping function occurs, such as creating remaps or deleting remaps.
Examples
The following is sample output from the debug apple remap command intermixed with output from the debug apple domain command; the two commands show related events.
Router# debug apple remapRouter# debug apple domainAT-REMAP: RemapProcess for net 30000 domain AURP Domain 1AT-REMAP: ReshuffleRemapList for subdomain 1AT-REMAP: Could not find a remap for cable 3000-3001AT-DOMAIN: atdomain_DisablePort for Tunnel0AT-DOMAIN: CleanUpDomain for domain 1 [AURP Domain 1]AT-DOMAIN: Disabling interface Ethernet1AT-DOMAIN: atdomain_DisablePort for Ethernet1AT-DOMAIN: CleanUpDomain for domain 1 [AURP Domain 1]AT-DOMAIN: CleanSubDomain for inbound subdomain 1AT-REMAP: Remap for net 70 inbound subdomain 1 has been deletedAT-DOMAIN: DeleteAvRemapList for inbound subdomain 1AT-DOMAIN: DeleteRemapTable for subdomain 1AT-DOMAIN: DeleteAvRemapList for inbound subdomain 1AT-DOMAIN: CleanSubDomain for outbound subdomain 1AT-DOMAIN: DeleteRemapTable for subdomain 1AT-REMAP: RemapProcess for net 30000 domain AURP Domain 1 Remaped Net 10000AT-REMAP: Remap for net 50 outbound subdomain 1 has been deletedAT-DOMAIN: DeleteAvRemapList for outbound subdomain 1AT-DOMAIN: DeleteAvRemapList for outbound subdomain 1AT-DOMAIN: CleanUpDomain for domain 1 [AURP Domain 1]AT-DOMAIN: CleanSubDomain for inbound subdomain 1AT-DOMAIN: DeleteRemapTable for subdomain 1AT-DOMAIN: DeleteAvRemapList for inbound subdomain 1AT-DOMAIN: CleanSubDomain for outbound subdomain 1AT-DOMAIN: DeleteRemapTable for subdomain 1AT-DOMAIN: DeleteAvRemapList for outbound subdomain 1Related Commands
debug apple routing
To enable debugging output from the Routing Table Maintenance Protocol (RTMP) routines, use the debug apple routing command in privileged EXEC mode. To disable debugging output, use the no form of this command.
debug apple routing [type number]
no debug apple routing [type number]
Syntax Description
Command Modes
Privileged EXEC
Usage Guidelines
This command can be used to monitor acquisition of routes, aging of routing table entries, and advertisement of known routes. It also reports conflicting network numbers on the same network if the network is misconfigured.
Caution
Examples
The following is sample output from the debug apple routing command:
Router# debug apple routingAT: src=Ethernet0:4160.41, dst=4160-4160, size=19, 2 rtes, RTMP pkt sentAT: src=Ethernet1:41069.25, dst=41069, size=427, 96 rtes, RTMP pkt sentAT: src=Ethernet2:4161.23, dst=4161-4161, size=427, 96 rtes, RTMP pkt sentAT: Route ager starting (97 routes)AT: Route ager finished (97 routes)AT: RTMP from 4160.19 (new 0,old 94,bad 0,ign 0, dwn 0)AT: RTMP from 4160.250 (new 0,old 0,bad 0,ign 2, dwn 0)AT: RTMP from 4161.236 (new 0,old 94,bad 0,ign 1, dwn 0)AT: src=Ethernet0:4160.41, dst=4160-4160, size=19, 2 rtes, RTMP pkt sentTable 8 describes the fields in the first line of sample debug apple routing output.
The following two messages indicate that the ager has started and finished the aging process for the routing table and that this table contains 97 entries:
AT: Route ager starting (97 routes)AT: Route ager finished (97 routes)Table 9 describes the fields in the following line of the debug apple routing command output:
AT: RTMP from 4160.19 (new 0,old 94,bad 0,ign 0, dwn 0)
debug apple zip
To display debugging output from the Zone Information Protocol (ZIP) routines, use the debug apple zip command in privileged EXEC mode. To disable debugging output, use the no form of this command.
debug apple zip [type number]
no debug apple zip [type number]
Syntax Description
Command Modes
Privileged EXEC
Usage Guidelines
This command reports significant events such as the discovery of new zones and zone list queries. It generates information similar to that generated by the debug apple routing command, but generates it for ZIP packets instead of Routing Table Maintenance Protocol (RTMP) packets.
You can use the debug apple zip command to determine whether a ZIP storm is taking place in the AppleTalk network. You can detect the existence of a ZIP storm when you see that no router on a cable has the zone name corresponding to a network number that all the routers have in their routing tables.
Examples
The following is sample output from the debug apple zip command:
Router# debug apple zipAT: Sent GetNetInfo request broadcast on Ether0AT: Recvd ZIP cmd 6 from 4160.19-6AT: 3 query packets sent to neighbor 4160.19AT: 1 zones for 31902, ZIP XReply, src 4160.19AT: net 31902, zonelen 10, name US-FloridaThe first line indicates that the router has received an RTMP update that includes a new network number and is now requesting zone information:
AT: Sent GetNetInfo request broadcast on Ether0The second line indicates that the neighbor at address 4160.19 replies to the zone request with a default zone:
AT: Recvd ZIP cmd 6 from 4160.19-6The third line indicates that the router responds with three queries to the neighbor at network address 4160.19 for other zones on the network:
AT: 3 query packets sent to neighbor 4160.19The fourth line indicates that the neighbor at network address 4160.19 responds with a ZIP extended reply, indicating that one zone has been assigned to network 31902:
AT: 1 zones for 31902, ZIP XReply, src 4160.19The fifth line indicates that the router responds that the zone name of network 31902 is US-Florida, and the zone length of that zone name is 10:
AT: net 31902, zonelen 10, name US-Floridadebug appn all
To turn on all possible debugging messages for Advanced Peer-to-Peer Networking (APPN), use the debug appn all command in privileged EXEC mode. To disable debugging output, use the no form of this command.
debug appn all
no debug appn all
Note
Syntax Description
This command has no arguments or keywords.
Command Modes
Privileged EXEC
Usage Guidelines
This command shows all APPN events. Use other forms of the debug appn command to display specific types of events.
Caution
Caution
Examples
Refer to the documentation for specific debug appn commands for examples and explanations.
Related Commands
debug appn cs
To display Advanced Peer-to-Peer Networking (APPN) Configuration Services (CS) component activity, use the debug appn cs command in privileged EXEC mode. To disable debugging output, use the no form of this command.
debug appn cs
no debug appn cs
Syntax Description
This command has no arguments or keywords.
Command Modes
Privileged EXEC
Usage Guidelines
The CS component is responsible for defining link stations, ports, and connection networks. It is responsible for the activation and deactivation of ports and link stations and handles status queries for these resources.
Examples
The following is sample output from the debug appn cs command. In this example a link station is being stopped.
Router# debug appn csTurned on event 008000FFRouter# appn stop link PATTYAPPN: ----- CS ----- Deq STOP_LS messageAPPN: ----- CS ----- FSM LS: 75 17 5 8APPN: ----- CS ----- Sending DEACTIVATE_AS - station PATTYAPPN: ----- CS ----- deactivate_as_p->ips_header.lpid = A80A60APPN: ----- CS ----- deactivate_as_p->ips_header.lpid = A80A60APPN: ----- CS ----- Sending DESTROY_TG to PC - station PATTY - lpid=A80A60APPN: ----- CS ----- Deq DESTROY_TG - station PATTYAPPN: ----- CS ----- FSM LS: 22 27 8 0APPN: ----- CS ----- Sending TG update for LS PATTY to TRSAPPN: ----- CS ----- ENTERING XID_PROCESSING: 4%APPN-6-APPNSENDMSG: Link Station PATTY stoppedTable 10 describes the significant fields and messages shown in the display.
Related Commands
debug appn ds
To display debugging information on Advanced Peer-to-Peer Networking (APPN) Directory Services (DS) component activity, use the debug appn ds command in privileged EXEC mode. To disable debugging output, use the no form of this command.
debug appn ds
no debug appn ds
Syntax Description
This command has no arguments or keywords.
Command Modes
Privileged EXEC
Usage Guidelines
The DS component manages searches for resources in the APPN network. DS is also responsible for registration of resources within the network.
Examples
The following is sample output from the debug appn ds command. In this example a search has been received.
Router# debug appn dsTurned on event 080000FFAPPN: NEWDS: LS: search from: NETA.PATTYAPPN: NEWDS: pcid: DD3321E8B5667111APPN: NEWDS: Invoking FSM NNSoluAPPN: NEWDS: LSfsm_NNSolu: 00A67AA0 pcid: DD3321E8B5667111 row: 0 col: 0 inp: 80200000APPN: NEWDS: LSfsm_parent: 00A89940 row: 0 col: 0 inp: 80000000APPN: NEWDS: Rcvd a LMRQAPPN: NEWDS: LSfsm_NNSolu: 00A67AA0 pcid: DD3321E8B5667111 row: 12 col: 1 inp: 40000000APPN: NEWDS: LSfsm_parent: 00A89940 row: 8 col: 1 inp: 40000000APPN: NEWDS: LSfsm_child: 00A89BE8 row: 0 col: 0 inp: 80000080APPN: NEWDS: PQenq REQUEST_ROUTE(RQ) to TRSAPPN: NEWDS: LSfsm_child: 00A8A1C0 row: 1 col: 0 inp: 80000008APPN: NEWDS: LSfsm_NNSolu: 00A67AA0 pcid: DD3321E8B5667111 row: 5 col: 1 inp: 80C04000APPN: NEWDS: LSfsm_child: 00A8A1C0 row: 7 col: 1 inp: 80844008APPN: NEWDS: Rcvd a LMRYAPPN: NEWDS: LSfsm_NNSolu: 00A67AA0 pcid: DD3321E8B5667111 row: 16 col: 6 inp: 40800000APPN: NEWDS: LSfsm_child: 00A8A1C0 row: 14 col: 5 inp: 40800000APPN: NEWDS: LSfsm_parent: 00A89940 row: 3 col: 1 inp: 80840000APPN: NEWDS: send locate to node: NETA.PATTYTable 11 describes the significant fields shown in the display.
Related Commands
debug appn hpr
To display debugging information related to High Performance Routing (HPR) code execution, use the debug appn hpr command in privileged EXEC mode. To disable debugging output, use the no form of this command.
debug appn hpr
no debug appn hpr
Syntax Description
This command has no arguments or keywords.
Command Modes
Privileged EXEC
Examples
The following is sample output from the debug appn hpr command:
Router# debug appn hprAPPN: -- ncl.ncl_map_dlc_type() -- mapping TOKEN_RING(4) to NCL_TR(3)APPN: -- ncl.ncl_port() -- called with port_type:3, cisco_idb:893A14, hpr_ssap:C8APPN: -- ncl.process_port_change() -- port coming upAPPN: -- ncl.process_port_change() -- PORT_UPAPPN: -- ncl.ncl_port_fsm -- FSM Invoked: Input:0, State:0->1, Action:0APPN: -- ncl.ncl_port_fsm -- FSM Invoked: Input:1, State:1->2, Action:1APPN: -- ncl.ncl_unmap_dlc_type() -- mapping NCL(3) to CLS(3)APPN: ----- ANR ----- Sending ACTIVATE_SAP.reqAPPN: -- cswncsnd.main() -- received LSA_IPS ips.APPN: -- ncl.ncl_port_fsm -- FSM Invoked: Input:3, State:2->3, Action:4APPN: -- ncl.ncl_assign_anr() -- Assigned ANR,anr:8002APPN: -- ncl.ncl_map_dlc_type() -- mapping TOKEN_RING(4) to NCL_TR(3)APPN: -- ncl.ncl_populate_anr() -- anr:8002, dlc_type:3, idb 893A14APPN: -- ncl.ncl_populate_anr() -- send anr_tbl_update to owning cswncsndAPPN: -- ncl.ncl_ls_fsm -- FSM Invoked: Input:0, State:0->1, Action:0APPN: ncl.ncl_send_reqopn_stn_reqAPPN: -- ncl.ncl_unmap_dlc_type() -- mapping NCL(3) to CLS(3)APPN: -- ncl.ncl_ls_fsm() -- send anr_tbl_update to owning cswncsndAPPN: -- cswncsnd.main() -- received ANR_TBL_UPDATE ips.APPN: -- cswncsnd.apply_anr_table_update() -- ANR:8002APPN: -- cswncsnd.main() -- received ANR_TBL_UPDATE ips.APPN: -- cswncsnd.apply_anr_table_update() -- ANR:8002APPN: -- cswncsnd.main() -- received LSA_IPS ips.APPN: -- ncl.ncl_ls_fsm -- FSM Invoked: Input:1, State:1->2, Action:1APPN: -- ncl.ncl_ls_fsm -- P_CEP_ID:AAF638APPN: -- ncl.ncl_ls_fsm() -- send anr_tbl_update to owning cswncsndAPPN: -- cswncsnd.main() -- received ANR_TBL_UPDATE ips.APPN: -- cswncsnd.apply_anr_table_update() -- ANR:8002APPN: rtpm: rtp_send() sent data over connection B9D5E8APPN: hpr timer: rtt start time clocked at 135952 msAPPN: -- cswncsnd.main() -- received NCL_SND_MSG ips.APPN: -- cswncsnd.process_nlp_from_rtp() -- label: 8002, send to p_cep 00AAF638.APPN: hpr timer: rtt end time clocked at 135972 msAPPN: hpr timer: round trip time measured at 20 msTable 12 describes the significant fields shown in the display.
Related Commands
debug appn ms
To display debugging information on Advanced Peer-to-Peer Networking (APPN) Management Services (MS) component activity, use the debug appn ms command in privileged EXEC mode. To disable debugging output, use the no form of this command.
debug appn ms
no debug appn ms
Syntax Description
This command has no arguments or keywords.
Command Modes
Privileged EXEC
Usage Guidelines
The MS component is responsible for generating, sending, and forwarding network management information in the form of traps and alerts to a network management focal point, such as Netview, in the APPN network.
Examples
The following is sample output from the debug appn ms command. In this example an error occurred that caused an alert to be generated.
Router# debug appn msAPPN: ----- MSS00 ---- Deq ALERT_MSU msgAPPN: --- MSP70 --- ALERT MV FROM APPN WITH VALID LGTHAPPN: --- MSCPL --- Find Active FPAPPN: --- MSP30 --- Entering Build MS TransportAPPN: --- MSP31 --- Entering Building Routing Info.APPN: --- MSP34 --- Entering Build GDSAPPN: --- MSP32 --- Entering Building UOW correlatorAPPN: --- MSP34 --- Entering Build GDSAPPN: --- MSP30 --- Building GDS 0x1310APPN: --- MSP30 --- Building MS TransportAPPN: --- MSP72 --- ACTIVE FP NOT FOUND, SAVE ONLYAPPN: --- MSUTL --- UOW <= 60, ALL COPIED in extract_uowAPPN: --- MSCAT --- by enq_cached_ms QUEUE SIZE OF QUEUE after enq 4Table 13 describes the significant fields shown in the display.
Table 13 debug appn ms Field Descriptions
APPN
Indicates that this is APPN debugging output.
MSP
Indicates that this is MS component output.
Related Commands
debug appn nof
To display debugging information on Advanced Peer-to-Peer Networking (APPN) Node Operator Facility (NOF) component activity, use the debug appn nof command in privileged EXEC mode. To disable debugging output, use the no form of this command.
debug appn nof
no debug appn nof
Syntax Description
This command has no arguments or keywords.
Command Modes
Privileged EXEC
Usage Guidelines
The NOF component is responsible for processing commands entered by the user such as start, stop, show, and configuration commands. NOF forwards these commands to the proper component and waits for the response.
Examples
The following is sample output from the debug appn nof command. In this example, an APPN connection network is being defined.
Router# debug appn nofTurned on event 010000FFRouter# config termEnter configuration commands, one per line. End with CNTL/Z.Router(config)# appn connection-network NETA.CISCORouter(config-appn-cn)# port TR0Router(config-appn-cn)# completerouter(config)#APPN: ----- NOF ----- Define Connection Network Verb ReceivedAPPN: ----- NOF ----- send define_cn_t ips to csAPPN: ----- NOF ----- waiting for define_cn rsp from csrouter(config)#Table 14 describes the significant fields shown in the display.
Related Commands
![]()
![]()
![]()
![]()
![]()
![]()
![]()
![]()
Posted: Mon Jul 2 07:34:42 PDT 2007
All contents are Copyright © 1992--2007 Cisco Systems, Inc. All rights reserved.
Important Notices and Privacy Statement.